ここではWebサイトで公開されて生データを使用してMatplotlibのfill_between()メソッドで線グラフが交差する部分を塗りつぶす方法を解説します。
Matplotlibのfill_between()メソッドは、plot()メソッドで作成した複数の線グラフが交差する部分を条件付きで塗りつぶすことができます。
たとえば、業種別給料の線グラフを作成して線が交差している箇所を塗りつぶすといったことが可能です。
またCOVID-19の感染者数の線グラフを作成して中央値以上の箇所と中央値以下の箇所を別々の色で塗りつぶすことも可能です。
線グラフにfill_between()を適用して塗りつぶすと新規感染がどの期間に増えたのか、減ったのかが一目で分かります。
COVID-19の感染者の推移とか、株価の推移を調べるのに向いています。
最初に厚労省のWebサイトからCOVID-19のデータをダウンロードしてMatplotlibのplot()メソッドで複数の線グラフを作成します。
次にfill_between()メソッドを使用して条件付きで線グラフが交差する部分を塗りつぶします。
また、GAFAなどの株価やBitcoinなどの仮想通貨(暗号通貨)にfill_between()を適用する方法も紹介します。
厚労省のWebサイトからCOVIC-19のデータをダウンロードするにはPandasのread_csv()メソッドを使用します。
read_csv()の引数にCSVファイルのURLを指定すると手動でダウンロードすることなく完全に自動化できます。
なお、COVIC-19のデータは「記事(Article013)」で作成しています。
事前に「記事(Article013)」で解説している手順でCSVファイルを作成しておいてください。
Yahoo! FinanceのWebサイトから株価や仮想通貨(暗号通貨)の価格をダウンロードするにはPandasのDataReaderを使用します。
DataReader()で株価をダウンロードするには引数に企業のティッカーシンボル(Apple▶AAPL)、開始日、終了日を指定します。
Yahoo! FinanceのWebサイトから仮想通貨(暗号通貨)の価格をダウンロードする場合も株価と同様PandasのDataReaderを使用します。
ビットコインの価格をダウンロードするにはDataReader()の引数に「BTC-JPY」「BTC-USD」のように指定します。
つまり、日本円に換算するときは「BTC-JPY」、米ドルに換算するときは「BTC-USD」のように指定します。
株価も仮想通貨(暗号通貨)の価格をダウンロードするのも完全に自動化できますので手動でダウンロードする必要はありません。
ここではVisula Studio Code(VSC)の「Python Interactive window」
を使用してJupter(IPython Notebook)のような環境で説明します。
VSCを通常の環境からインタラクティブな環境に切り換えるにはコードを記述するときコメント「# %%」を入力します。
詳しい、操作手順については「ここ」
を参照してください。
インタラクティブな環境では、Pythonの「print(), plt.show()」などを使う必要がないので掲載しているコードでは省略しています。
VSCで通常の環境で使用するときは、必要に応じて「print(), plt.show()」等を追加してください。
この記事では、Pandas、Matplotlibのライブラリを使用しますので
「記事(Article001) | 記事(Article002) | 記事(Article003) | 記事(Article004)」
を参照して事前にインストールしておいてください。
Pythonのコードを入力するときにMicrosoftのVisula Studio Codeを使用します。
まだ、インストールしていないときは「記事(Article001)」を参照してインストールしておいてください。
説明文の左側に図の画像が表示されていますが縮小されています。
画像を拡大するにはマウスを画像上に移動してクリックします。
画像が拡大表示されます。拡大された画像を閉じるには右上の[X]をクリックします。
画像の任意の場所をクリックして閉じることもできます。
-
PandasのDataFrameにサンプルデータを取り込んで線グラフを作成する
Visual Studio Codeを起動したら以下のコードを入力して実行[Ctrl+Enter]します。
行3-4ではPythonのライブラリを取り込んでいます。
行7ではPandasのread_csv()メソッドを使用してCSVファイルのデータをPandasのDataFrameに取り込んでいます。
ここではローカルディスクから取り込んでいます。
このサンプルをコピペして実行するときは行7をコメントにして行8-9のコメントを外してください。
これでCSVファイルを当サイトから自動的にダウンロードすることができます。
行14ではMatplotlibで日本語が使えるようにCSSに「font.family」プロパティに日本語のフォント「Meiryo」を設定しています。
行16-19ではDataFrameに格納されているデータを変数に格納しています。
行22-24ではmatplotlibのplot()メソッドで全技術者の平均給料の線グラフを作成しています。
行25ではmatplotlibのplot()メソッドでPythonの技術者の平均給料の線グラフを作成しています。
行29ではmatplotlibのlegend()メソッドで凡例を表示しています。
行31-33では図のタイトル、X軸のラベル、Y軸のラベルを設定しています。
行35ではmatplotlibのtight_layout()メソッドでグラフが綺麗に表示されるようにしています。
この設定はNOTE-PCを使用するときに効果があります。
行37ではmatplotlibのshow()メソッドでグラフを表示しています。
Visual Studio Codeのインタラクティブ環境/Jupterの環境で使用するときは不要です。
# Article018_Matplotlib Filling Area on Line Plots Part1.py
# %%
import pandas as pd
from matplotlib import pyplot as plt

# 0) Load data
df = pd.read_csv('data/csv/article018/salaries_jp.csv')
#url = 'https://money-or-ikigai.com/menu/python/article/data/article018/salaries_jp.csv'
#df = pd.read_csv(url)

# 1) Draw two line chart

# Set the font to support Japanese
plt.rcParams['font.family'] = 'Meiryo'  # Meiryo, Yu Gothic

ages = df['Age']
all_salaries = df['All_Devs']
py_salaries = df['Python']
js_salaries = df['JavaScript']

# All developers
plt.plot(ages, all_salaries,
    color='#444444',
    linestyle='--', label='全技術者')

# Python developers
plt.plot(ages, py_salaries, label='Python技術者')

plt.legend()

plt.title('年齢別給料の中央値')
plt.xlabel('年齢')
plt.ylabel('給料の中央値(円)')

plt.tight_layout()

plt.show()
 図1
図1は実行結果です。2本の線が引かれています。
図1
図1は実行結果です。2本の線が引かれています。
-
給料が中央値以上と以下の部分を塗りつぶす
行16では給料の中央値を設定しています。
行18ではmatplotlibのfill_between()メソッドで中央値の上下の部分を塗りつぶしています。
fill_between()の引数1にはX軸の値(年齢)、引数2にはY軸の値(給料)、引数3には給料の中央値を指定しています。
さらに引数「alpha=0.25」を追加して塗りつぶす色の透明度を指定しています。
# 2) Fill area

ages = df['Age']
all_salaries = df['All_Devs']
py_salaries = df['Python']
js_salaries = df['JavaScript']

# All developers
plt.plot(ages, all_salaries,
    color='#444444',
    linestyle='--', label='全技術者')

# Python developers
plt.plot(ages, py_salaries, label='Python技術者')

overall_median = 4500000

plt.fill_between(ages, py_salaries, overall_median, alpha=0.25)

plt.legend()

plt.title('年齢別給料の中央値')
plt.xlabel('年齢')
plt.ylabel('給料の中央値(円)')
plt.tight_layout()

plt.show()
 図2
図2は実行結果です。中央値を基点に線グラフの領域が塗りつぶされています。
図2
図2は実行結果です。中央値を基点に線グラフの領域が塗りつぶされています。
-
給料が中央値以上と以下の部分を別々の色で塗りつぶす
行18-21ではmatplotlibのfill_between()メソッドで線が中央値を超える部分を塗りつぶしています。
ここでは色を省略しているので塗りつぶす色はデフォルトの色になります。
行23-27ではfill_between()メソッドで線が中央値以下の部分を「赤」で塗りつぶしています。
この例のように2本の線がクロスするときは、
fill_between()に引数「interpolate=True」を追加して線がクロスした部分も塗りつぶすようにします。
# 3) Fill area with different colors

ages = df['Age']
all_salaries = df['All_Devs']
py_salaries = df['Python']
js_salaries = df['JavaScript']

# All developers
plt.plot(ages, all_salaries,
    color='#444444',
    linestyle='--', label='全技術者')

# Python developers
plt.plot(ages, py_salaries, label='Python技術者')

overall_median = 4500000

plt.fill_between(ages, py_salaries, overall_median,
    where=(py_salaries > overall_median),
    interpolate=True,
    alpha=0.25)

plt.fill_between(ages, py_salaries, overall_median,
    where=(py_salaries <= overall_median),
    interpolate=True,
    color='red',
    alpha=0.25)

plt.legend()

plt.title('年齢別給料の中央値')
plt.xlabel('年齢')
plt.ylabel('給料の中央値(円)')

plt.tight_layout()

plt.show()
 図3
図3は実行結果です。線グラフが中央値以上の部分と中央値以下の部分が異なる色で塗りつぶされています。
図3
図3は実行結果です。線グラフが中央値以上の部分と中央値以下の部分が異なる色で塗りつぶされています。
-
全技術者とPython技術者の差額の部分を別々の色で塗りつぶす
行17では中央値の代わりに全技術者の平均給料と比較しています。
行22も同様に中央値の代わりに全技術者の平均給料と比較しています。
これで2本の線で囲まれて部分が塗りつぶされるようになります。
つまり、差額の部分が塗りつぶされます。
# 4) Fill area with different colors

ages = df['Age']
all_salaries = df['All_Devs']
py_salaries = df['Python']
js_salaries = df['JavaScript']

# All developers
plt.plot(ages, all_salaries,
    color='#444444',
    linestyle='--', label='全技術者')

# Python developers
plt.plot(ages, py_salaries, label='Python技術者')

plt.fill_between(ages, py_salaries, all_salaries,
    where=(py_salaries > all_salaries),
    interpolate=True,
    alpha=0.25)

plt.fill_between(ages, py_salaries, all_salaries,
    where=(py_salaries <= all_salaries),
    interpolate=True,
    color='red',
    alpha=0.25)

plt.legend()

plt.title('年齢別給料の差額 (全技術者 vs Python技術者)')
plt.xlabel('年齢')
plt.ylabel('給料(円)')

plt.tight_layout()

plt.show()
 図4
図4は実行結果です。2本の線で囲まれた部分(差額)が塗りつぶされています。
図4
図4は実行結果です。2本の線で囲まれた部分(差額)が塗りつぶされています。
-
グラフを塗りつぶした部分の凡例を表示する
行19と行25では引数「label=」を追加して差額の部分の凡例を表示しています。
これで差額の部分が何を意味するかが分かります。
# 5) Add lables

ages = df['Age']
all_salaries = df['All_Devs']
py_salaries = df['Python']
js_salaries = df['JavaScript']

# All developers
plt.plot(ages, all_salaries,
    color='#444444',
    linestyle='--', label='全技術者')

# Python developers
plt.plot(ages, py_salaries, label='Python技術者')

plt.fill_between(ages, py_salaries, all_salaries,
    where=(py_salaries > all_salaries),
    interpolate=True,
    alpha=0.25, label='平均以上')

plt.fill_between(ages, py_salaries, all_salaries,
    where=(py_salaries <= all_salaries),
    interpolate=True,
    color='red',
    alpha=0.25, label='平均以下')

plt.legend()

plt.title('年齢別給料の差額 (全技術者 vs Python技術者)')
plt.xlabel('年齢')
plt.ylabel('給料(円)')

plt.tight_layout()

plt.show()
 図5
図5は実行結果です。図の差額部分の意味を示す凡例が表示されています。
図5
図5は実行結果です。図の差額部分の意味を示す凡例が表示されています。
-
ここで解説したコードをまとめて掲載
最後にここで解説したすべてのコードをまとめて掲載しましたので参考にしてください。
# Article018_Matplotlib Filling Area on Line Plots Part1.py
# %%
import pandas as pd
from matplotlib import pyplot as plt

# %%

# 0) Load data
df = pd.read_csv('data/csv/article018/salaries_jp.csv')
#url = 'https://money-or-ikigai.com/menu/python/article/data/article018/salaries_jp.csv'
#df = pd.read_csv(url)

# %%

# 1) Draw two line chart

# Set the font to support Japanese
plt.rcParams['font.family'] = 'Meiryo'  # Meiryo, Yu Gothic
plt.figure(figsize=(10,6))

ages = df['Age']
all_salaries = df['All_Devs']
py_salaries = df['Python']
js_salaries = df['JavaScript']

# All developers
plt.plot(ages, all_salaries,
    color='#444444',
    linestyle='--', label='全技術者')

# Python developers
plt.plot(ages, py_salaries, label='Python技術者')

plt.legend()

plt.title('年齢別給料の中央値')
plt.xlabel('年齢')
plt.ylabel('給料の中央値(円)')

plt.tight_layout()

plt.show()

# %%

# 2) Fill area
plt.figure(figsize=(10,6))

ages = df['Age']
all_salaries = df['All_Devs']
py_salaries = df['Python']
js_salaries = df['JavaScript']

# All developers
plt.plot(ages, all_salaries,
    color='#444444',
    linestyle='--', label='全技術者')

# Python developers
plt.plot(ages, py_salaries, label='Python技術者')

overall_median = 4500000

#plt.fill_between(ages, py_salaries)
#plt.fill_between(ages, py_salaries, alpha=0.25)
plt.fill_between(ages, py_salaries, overall_median, alpha=0.25)

plt.legend()

plt.title('年齢別給料の中央値')
plt.xlabel('年齢')
plt.ylabel('給料の中央値(円)')
plt.tight_layout()

plt.show()

# %%

# 3) Fill area with different colors : using overall_median
plt.figure(figsize=(10,6))

ages = df['Age']
all_salaries = df['All_Devs']
py_salaries = df['Python']
js_salaries = df['JavaScript']

# All developers
plt.plot(ages, all_salaries,
    color='#444444',
    linestyle='--', label='全技術者')

# Python developers
plt.plot(ages, py_salaries, label='Python技術者')

overall_median = 4500000

#plt.fill_between(ages, py_salaries)
#plt.fill_between(ages, py_salaries, alpha=0.25)
#plt.fill_between(ages, py_salaries, overall_median, alpha=0.25)
plt.fill_between(ages, py_salaries, overall_median,
    where=(py_salaries > overall_median),
    interpolate=True,
    alpha=0.25)

plt.fill_between(ages, py_salaries, overall_median,
    where=(py_salaries <= overall_median),
    interpolate=True,
    color='red',
    alpha=0.25)

plt.legend()

plt.title('年齢別給料の中央値')
plt.xlabel('年齢')
plt.ylabel('給料の中央値(円)')

plt.tight_layout()

plt.show()

# %%

# 4) Fill area with different colors
plt.figure(figsize=(10,6))

ages = df['Age']
all_salaries = df['All_Devs']
py_salaries = df['Python']
js_salaries = df['JavaScript']

# All developers
plt.plot(ages, all_salaries,
    color='#444444',
    linestyle='--', label='全技術者')

# Python developers
plt.plot(ages, py_salaries, label='Python技術者')

plt.fill_between(ages, py_salaries, all_salaries,
    where=(py_salaries > all_salaries),
    interpolate=True,
    alpha=0.25)

plt.fill_between(ages, py_salaries, all_salaries,
    where=(py_salaries <= all_salaries),
    interpolate=True,
    color='red',
    alpha=0.25)

plt.legend()

plt.title('年齢別給料の差額 (全技術者 vs Python技術者)')
plt.xlabel('年齢')
plt.ylabel('給料(円)')

plt.tight_layout()

plt.show()

# %%

# 5) Add lables
plt.figure(figsize=(10,6))

ages = df['Age']
all_salaries = df['All_Devs']
py_salaries = df['Python']
js_salaries = df['JavaScript']

# All developers
plt.plot(ages, all_salaries,
    color='#444444',
    linestyle='--', label='全技術者')

# Python developers
plt.plot(ages, py_salaries, label='Python技術者')

plt.fill_between(ages, py_salaries, all_salaries,
    where=(py_salaries > all_salaries),
    interpolate=True,
    alpha=0.25, label='平均以上')

plt.fill_between(ages, py_salaries, all_salaries,
    where=(py_salaries <= all_salaries),
    interpolate=True,
    color='red',
    alpha=0.25, label='平均以下')

plt.legend()

plt.title('年齢別給料の差額 (全技術者 vs Python技術者)')
plt.xlabel('年齢')
plt.ylabel('給料(円)')

plt.tight_layout()

plt.show()

# %%
-
PandasのDataFrameにCOVID-19のデータを取り込んで加工する
# Article018_Matplotlib Filling Area on Line Plots Part3 COVID-19.py
# %%

# Import the necessary libraries
from os import terminal_size
import pandas as pd
from pandas.core.frame import DataFrame
import pandas_datareader.data as web    # pip install pandas_datareader
import matplotlib.pyplot as plt
import matplotlib.dates as mpl_dates
import matplotlib.style as style
from datetime import datetime, timedelta
import numpy as np
import warnings
warnings.simplefilter('ignore')

# %%

# 0) Load the csv files
csv_file = 'data/csv/covid-19/japan/combined_v2.csv'
#csv_file = 'https://money-or-ikigai.com/menu/python/article/data/covid-19/combined_v2.csv'
raw = pd.read_csv(csv_file, parse_dates=['date'])
#raw.info()
#raw.head()

# %%

# 1) Create a CSV file  'data/csv/covid-19/japan/combined2.csv'

df = raw
prefs = ['Tokyo','Osaka','Saitama','Kanagawa','Chiba']

for pref in prefs:
    # Filter prefecture
    filter_by =  filter_by = (df['prefecture'] == pref)
    dfx = df[filter_by]
    pref = pref.lower()
    dfx.rename(columns={
        'new_cases': f'new_cases_{pref}',
        'new_deaths': f'new_deaths_{pref}',
        'severe_cases': f'severe_cases_{pref}'
        }, inplace=True)
    dfx = dfx[['date', f'new_cases_{pref}', f'new_deaths_{pref}', f'severe_cases_{pref}']]
    dfx.set_index('date')
    if pref == 'tokyo':
        dfall = dfx
    else:
        dfall = pd.merge(dfall, dfx)

csv_file = 'data/csv/covid-19/japan/combined2.csv'
dfall.to_csv(csv_file, index=False)
 図9 COVID-19
-
感染者(東京)の線グラフを作成して中央値以上の部分と以下の部分を別々の色で塗りつぶす
# 2) Plot line chart for new_cases : 感染者 線グラフ

# Set the font to support Japanese
plt.rcParams['font.family'] = 'Meiryo'  # Meiryo, Yu Gothic
plt.style.use('fivethirtyeight')    # 'fivethirtyeight' 'ggplot'
plt.figure(figsize=(12,5))

df = raw
filter_by = (df['prefecture'] == 'Tokyo') & (df['date'] >= '2020-01-01')
dfx = df[filter_by]    # Tokyo

median = dfx.new_cases.median()
median_cases = np.repeat(median, len(dfx.new_cases))

plt.plot(dfx.date, dfx.new_cases, linewidth=1, label='感染者')
plt.plot(dfx.date, median_cases, color='#444444', linestyle='dashed', linewidth=1, label='中央値')

plt.fill_between(dfx.date, dfx.new_cases, median_cases,
    where=(dfx.new_cases > median_cases),
    interpolate=True,
    alpha=0.25, label='中央値以上')

plt.fill_between(dfx.date, dfx.new_cases, median_cases,
    where=(dfx.new_cases <= median_cases),
    interpolate=True,
    alpha=0.25, label='中央値以下')

plt.gcf().autofmt_xdate()
date_format = mpl_dates.DateFormatter('%Y/%m/%d')
plt.gca().xaxis.set_major_formatter(date_format)

plt.xticks(rotation=45)
plt.ylabel('人数')
plt.title('COVID-19 東京: 感染者\n(2020-2021)')
plt.legend(loc='best')
plt.tight_layout()
plt.show()

# %%

# 3) Plot line chart for new_cases : 感染者 線グラフ

# Set the font to support Japanese
plt.rcParams['font.family'] = 'Meiryo'  # Meiryo, Yu Gothic
plt.style.use('fivethirtyeight')    # 'fivethirtyeight' 'ggplot'
plt.figure(figsize=(12,5))

df = raw
filter_by = (df['prefecture'] == 'Tokyo') & (df['date'] >= '2021-01-01')
dfx =  df[filter_by]    # Tokyo

median = dfx.new_cases.median()
median_cases = np.repeat(median, len(dfx.new_cases))

plt.plot(dfx.date, dfx.new_cases, linewidth=1, label='感染者')
plt.plot(dfx.date, median_cases, color='#444444', linestyle='dashed', linewidth=1, label='中央値')

plt.fill_between(dfx.date, dfx.new_cases, median_cases,
    where=(dfx.new_cases > median_cases),
    interpolate=True,
    alpha=0.25, label='中央値以上')

plt.fill_between(dfx.date, dfx.new_cases, median_cases,
    where=(dfx.new_cases <= median_cases),
    interpolate=True,
    alpha=0.25, label='中央値以下')

plt.gcf().autofmt_xdate()
date_format = mpl_dates.DateFormatter('%m/%d')
plt.gca().xaxis.set_major_formatter(date_format)

plt.xticks(rotation=45)
plt.ylabel('人数')
plt.title('COVID-19 東京: 感染者\n(2021)')
plt.legend(loc='best')
plt.tight_layout()
plt.show()
 図10 東京(感染)
-
感染者/重症者/死亡者(東京)の線グラフを作成して交差する部分を別々の色で塗りつぶす
# 4) Plot line chart for severe_cases, new_deaths and fill area : 重症者 vs 死亡者 線グラフ

# Set the font to support Japanese
plt.rcParams['font.family'] = 'Meiryo'  # Meiryo, Yu Gothic
plt.style.use('fivethirtyeight')    # 'fivethirtyeight' 'ggplot'
plt.figure(figsize=(12,8))

df = raw
filter_by = (df['prefecture'] == 'Tokyo') & (df['date'] >= '2021-01-01')
dfx =  df[filter_by]    # Tokyo

plt.plot(dfx.date, dfx.severe_cases,linewidth=1)
plt.plot(dfx.date, dfx.new_deaths, color='#444444', linestyle='dashed', linewidth=1)

plt.fill_between(dfx.date, dfx.severe_cases, dfx.new_deaths,
    where=(dfx.severe_cases > dfx.new_deaths),
    interpolate=True,
    alpha=0.25, label='重症者')

plt.fill_between(dfx.date, dfx.new_deaths, 0,
    where=(dfx.new_deaths <= dfx.severe_cases),
    interpolate=True,
    alpha=0.25, label='死亡者')

plt.gcf().autofmt_xdate()
#date_format = mpl_dates.DateFormatter('%Y/%m/%d')
date_format = mpl_dates.DateFormatter('%m/%d')
plt.gca().xaxis.set_major_formatter(date_format)

plt.xticks(rotation=45)
plt.ylabel('人数')
plt.title('COVID-19 東京: 重症者 vs 死亡者\n(2021)')
plt.legend(loc='best')
plt.tight_layout()
plt.show()

# %%

# 5) Plot line chart for new_cases, severe_cases and fill area : 感染者 vs 重症者 線グラフ

# Set the font to support Japanese
plt.rcParams['font.family'] = 'Meiryo'  # Meiryo, Yu Gothic
plt.style.use('fivethirtyeight')    # 'fivethirtyeight' 'ggplot'
plt.figure(figsize=(12,5))

df = raw
filter_by = (df['prefecture'] == 'Tokyo') & (df['date'] >= '2021-01-01')
dfx =  df[filter_by]    # Tokyo

plt.plot(dfx.date, dfx.new_cases, linewidth=1)
plt.plot(dfx.date, dfx.severe_cases, color='#444444', linestyle='dashed', linewidth=1)

plt.fill_between(dfx.date, dfx.new_cases, dfx.severe_cases,
    where=(dfx.new_cases > dfx.severe_cases),
    interpolate=True,
    alpha=0.25, label='感染者')

plt.fill_between(dfx.date, dfx.severe_cases, 0,
    where=(dfx.severe_cases <= dfx.new_cases),
    interpolate=True,
    alpha=0.25, label='重症者')

plt.yscale('log')

plt.gcf().autofmt_xdate()
#date_format = mpl_dates.DateFormatter('%Y/%m/%d')
date_format = mpl_dates.DateFormatter('%m/%d')
plt.gca().xaxis.set_major_formatter(date_format)

plt.xticks(rotation=45)
plt.ylabel('人数: yscale(log)')
plt.title('COVID-19 東京: 感染者 vs 重症者\n(2021)')
plt.legend(loc='upper right')
plt.tight_layout()
plt.show()
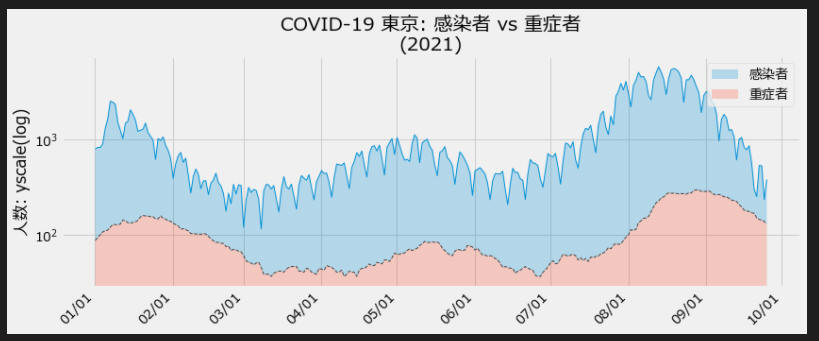 図11-1 東京(感染/重症)
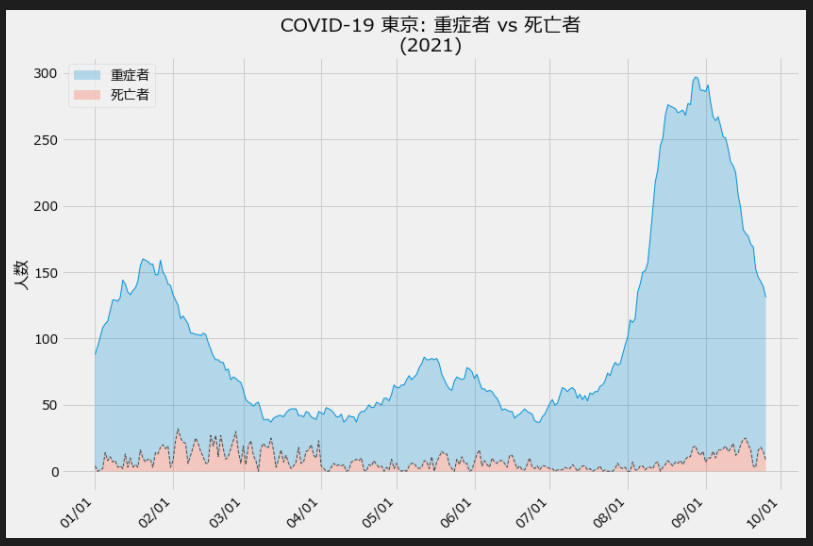 図11-2 東京(重症/死亡)
-
感染者/重症者/死亡者(東京)の線グラフを作成して交差する部分を別々の色で塗りつぶす
# 6) Plot line chart for new_cases, severe_cases, new_deaths and fill area : 感染者 / 重症者 / 死亡者 線グラフ

# Set the font to support Japanese
plt.rcParams['font.family'] = 'Meiryo'  # Meiryo, Yu Gothic
plt.style.use('fivethirtyeight')    # 'fivethirtyeight' 'ggplot'
plt.figure(figsize=(12,7))

df = raw
filter_by = (df['prefecture'] == 'Tokyo') & (df['date'] >= '2021-01-01')
dfx =  df[filter_by]    # Tokyo

plt.plot(dfx.date, dfx.new_cases, color='#444444', linewidth=1)
plt.plot(dfx.date, dfx.severe_cases, color='#444444', linestyle='dashed', linewidth=1)
plt.plot(dfx.date, dfx.new_deaths, color='#444444', linestyle='dashed', linewidth=1)

plt.fill_between(dfx.date, dfx.new_cases, dfx.severe_cases,
    where=(dfx.new_cases > dfx.severe_cases),
    interpolate=True,
    alpha=0.25, label='感染者')

plt.fill_between(dfx.date, dfx.severe_cases, dfx.new_deaths,
    where=(dfx.severe_cases > dfx.new_deaths),
    interpolate=True,
    alpha=0.25, label='重症者')

plt.fill_between(dfx.date, dfx.new_deaths, 0,
    where=(dfx.new_deaths <= dfx.severe_cases),
    interpolate=True,
    alpha=0.25, label='死亡者')

plt.yscale('log')

plt.gcf().autofmt_xdate()
#date_format = mpl_dates.DateFormatter('%Y/%m/%d')
date_format = mpl_dates.DateFormatter('%m/%d')
plt.gca().xaxis.set_major_formatter(date_format)

plt.xticks(rotation=45)
plt.ylabel('人数: yscale(log)')
plt.title('COVID-19 東京: 感染者 / 重症者 / 死亡者\n(2021)')
plt.legend(loc='best')
plt.tight_layout()
plt.show()
 図12 東京(感/重/死)
-
都道府県別の感染者の線グラフを作成して交差する部分を別々の色で塗りつぶす
# 7) Plot line chart for new_cases and fill area : 埼玉 vs 千葉  感染者 線グラフ

csv_file = 'data/csv/covid-19/japan/combined2.csv'
#csv_file = 'https://money-or-ikigai.com/menu/python/article/data/covid-19/combined2.csv'
raw = pd.read_csv(csv_file, parse_dates=['date'])
#raw.info()
#raw.head()

# Set the font to support Japanese
plt.rcParams['font.family'] = 'Meiryo'  # Meiryo, Yu Gothic
plt.style.use('fivethirtyeight')    # 'fivethirtyeight' 'ggplot'
plt.figure(figsize=(12,7))

# Filter Date
df = raw
filter_by = (df['date'] >= '2021-01-01')
dfx =  df[filter_by]

plt.plot(dfx.date, dfx.new_cases_saitama, color='#444444', linewidth=1)
plt.plot(dfx.date, dfx.new_cases_chiba, color='#444444', linestyle='dashed', linewidth=1)

plt.fill_between(dfx.date, dfx.new_cases_saitama, dfx.new_cases_chiba,
    where=(dfx.new_cases_saitama > dfx.new_cases_chiba),
    interpolate=True,
    alpha=0.25, label='埼玉')

plt.fill_between(dfx.date, dfx.new_cases_saitama, dfx.new_cases_chiba,
    where=(dfx.new_cases_saitama <= dfx.new_cases_chiba),
    interpolate=True,
    alpha=0.25, label='千葉')

#plt.yscale('log')

plt.gcf().autofmt_xdate()
#date_format = mpl_dates.DateFormatter('%Y/%m/%d')
date_format = mpl_dates.DateFormatter('%m/%d')
plt.gca().xaxis.set_major_formatter(date_format)

plt.xticks(rotation=45)
plt.ylabel('人数)')
plt.title('COVID-19 感染者: 埼玉 vs 千葉\n(2021)')
plt.legend(loc='upper right')
plt.tight_layout()
plt.show()

# %%

# 8) Plot line chart for new_cases and fill area : 神奈川 vs 埼玉  感染者 線グラフ

# Set the font to support Japanese
plt.rcParams['font.family'] = 'Meiryo'  # Meiryo, Yu Gothic
plt.style.use('fivethirtyeight')    # 'fivethirtyeight' 'ggplot'
plt.figure(figsize=(12,7))

# Filter Date
df = raw
filter_by = (df['date'] >= '2021-01-01')
dfx =  df[filter_by]

plt.plot(dfx.date, dfx.new_cases_kanagawa, color='#444444', linewidth=1)
plt.plot(dfx.date, dfx.new_cases_saitama, color='#444444', linestyle='dashed', linewidth=1)

plt.fill_between(dfx.date, dfx.new_cases_kanagawa, dfx.new_cases_saitama,
    where=(dfx.new_cases_kanagawa > dfx.new_cases_saitama),
    interpolate=True,
    alpha=0.25, label='神奈川')

plt.fill_between(dfx.date, dfx.new_cases_kanagawa, dfx.new_cases_saitama,
    where=(dfx.new_cases_kanagawa <= dfx.new_cases_saitama),
    interpolate=True,
    alpha=0.25, label='埼玉')

#plt.yscale('log')

plt.gcf().autofmt_xdate()
#date_format = mpl_dates.DateFormatter('%Y/%m/%d')
date_format = mpl_dates.DateFormatter('%m/%d')
plt.gca().xaxis.set_major_formatter(date_format)

plt.xticks(rotation=45)
plt.ylabel('人数)')
plt.title('COVID-19 感染者: 神奈川 vs 埼玉\n(2021)')
plt.legend(loc='upper right')
plt.tight_layout()
plt.show()

# %%

# 9) Plot line chart for new_cases and fill area : 東京 vs 大阪  感染者 線グラフ

# Set the font to support Japanese
plt.rcParams['font.family'] = 'Meiryo'  # Meiryo, Yu Gothic
plt.style.use('fivethirtyeight')    # 'fivethirtyeight' 'ggplot'
plt.figure(figsize=(12,7))

# Filter Date
df = raw
filter_by = (df['date'] >= '2021-01-01')
dfx =  df[filter_by]

plt.plot(dfx.date, dfx.new_cases_tokyo, color='#444444', linewidth=1)
plt.plot(dfx.date, dfx.new_cases_osaka, color='#444444', linestyle='dashed', linewidth=1)

plt.fill_between(dfx.date, dfx.new_cases_tokyo, dfx.new_cases_osaka,
    where=(dfx.new_cases_tokyo > dfx.new_cases_osaka),
    interpolate=True,
    alpha=0.25, label='東京')

plt.fill_between(dfx.date, dfx.new_cases_tokyo, dfx.new_cases_osaka,
    where=(dfx.new_cases_tokyo <= dfx.new_cases_osaka),
    interpolate=True,
    alpha=0.25, label='大坂')

#plt.yscale('log')

plt.gcf().autofmt_xdate()
#date_format = mpl_dates.DateFormatter('%Y/%m/%d')
date_format = mpl_dates.DateFormatter('%m/%d')
plt.gca().xaxis.set_major_formatter(date_format)

plt.xticks(rotation=45)
plt.ylabel('人数)')
plt.title('COVID-19 感染者: 東京 vs 大阪\n(2021)')
plt.legend(loc='upper right')
plt.tight_layout()
plt.show()
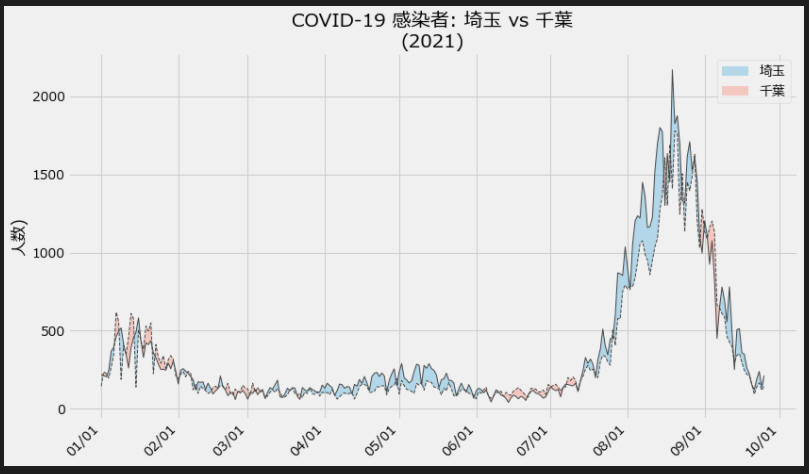 図13-1 埼玉 vs 千葉
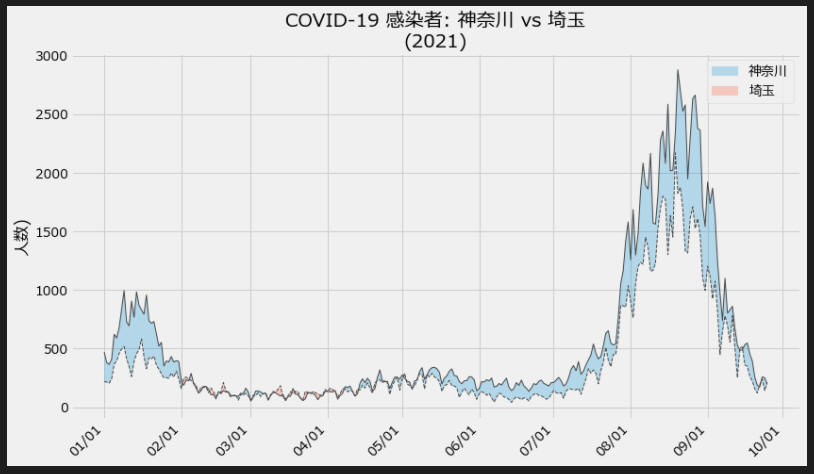 図13-2 神奈川 vs 埼玉
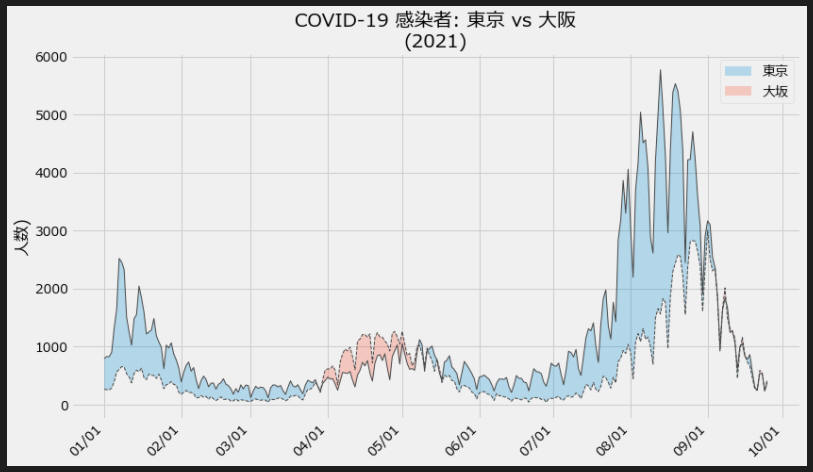 図13-3 東京 vs 大阪
-
ここで解説したコードをまとめて掲載
最後にここで解説したすべてのコードをまとめて掲載しましたので参考にしてください。
# Article018_Matplotlib Filling Area on Line Plots Part3 COVID-19.py
# %%

# Import the necessary libraries
from os import terminal_size
import pandas as pd
from pandas.core.frame import DataFrame
import pandas_datareader.data as web    # pip install pandas_datareader
import matplotlib.pyplot as plt
import matplotlib.dates as mpl_dates
import matplotlib.style as style
from datetime import datetime, timedelta
import numpy as np
import warnings
warnings.simplefilter('ignore')

# %%

# 0) Load the csv files
csv_file = 'data/csv/covid-19/japan/combined_v2.csv'
#csv_file = 'https://money-or-ikigai.com/menu/python/article/data/covid-19/combined_v2.csv'
raw = pd.read_csv(csv_file, parse_dates=['date'])
#raw.info()
#raw.head()

# %%

# 1) Create a CSV file  'data/csv/covid-19/japan/combined2.csv'

df = raw
prefs = ['Tokyo','Osaka','Saitama','Kanagawa','Chiba']

for pref in prefs:
    # Filter prefecture
    filter_by =  filter_by = (df['prefecture'] == pref)
    dfx = df[filter_by]
    pref = pref.lower()
    dfx.rename(columns={
        'new_cases': f'new_cases_{pref}',
        'new_deaths': f'new_deaths_{pref}',
        'severe_cases': f'severe_cases_{pref}'
        }, inplace=True)
    dfx = dfx[['date', f'new_cases_{pref}', f'new_deaths_{pref}', f'severe_cases_{pref}']]
    dfx.set_index('date')
    if pref == 'tokyo':
        dfall = dfx
    else:
        dfall = pd.merge(dfall, dfx)

csv_file = 'data/csv/covid-19/japan/combined2.csv'
dfall.to_csv(csv_file, index=False)

# %%

# 2) Plot line chart for new_cases : 感染者 線グラフ

# Set the font to support Japanese
plt.rcParams['font.family'] = 'Meiryo'  # Meiryo, Yu Gothic
plt.style.use('fivethirtyeight')    # 'fivethirtyeight' 'ggplot'
plt.figure(figsize=(12,5))

df = raw
filter_by = (df['prefecture'] == 'Tokyo') & (df['date'] >= '2020-01-01')
dfx = df[filter_by]    # Tokyo

median = dfx.new_cases.median()
median_cases = np.repeat(median, len(dfx.new_cases))

plt.plot(dfx.date, dfx.new_cases, linewidth=1, label='感染者')
plt.plot(dfx.date, median_cases, color='#444444', linestyle='dashed', linewidth=1, label='中央値')

plt.fill_between(dfx.date, dfx.new_cases, median_cases,
    where=(dfx.new_cases > median_cases),
    interpolate=True,
    alpha=0.25, label='中央値以上')

plt.fill_between(dfx.date, dfx.new_cases, median_cases,
    where=(dfx.new_cases <= median_cases),
    interpolate=True,
    alpha=0.25, label='中央値以下')

plt.gcf().autofmt_xdate()
date_format = mpl_dates.DateFormatter('%Y/%m/%d')
#date_format = mpl_dates.DateFormatter('%m/%d')
plt.gca().xaxis.set_major_formatter(date_format)

plt.xticks(rotation=45)
plt.ylabel('人数')
plt.title('COVID-19 東京: 感染者\n(2020-2021)')
plt.legend(loc='best')
plt.tight_layout()
plt.show()

# %%

# 3) Plot line chart for new_cases : 感染者 線グラフ

# Set the font to support Japanese
plt.rcParams['font.family'] = 'Meiryo'  # Meiryo, Yu Gothic
plt.style.use('fivethirtyeight')    # 'fivethirtyeight' 'ggplot'
plt.figure(figsize=(12,5))

df = raw
filter_by = (df['prefecture'] == 'Tokyo') & (df['date'] >= '2021-01-01')
dfx =  df[filter_by]    # Tokyo

median = dfx.new_cases.median()
median_cases = np.repeat(median, len(dfx.new_cases))

plt.plot(dfx.date, dfx.new_cases, linewidth=1, label='感染者')
plt.plot(dfx.date, median_cases, color='#444444', linestyle='dashed', linewidth=1, label='中央値')

plt.fill_between(dfx.date, dfx.new_cases, median_cases,
    where=(dfx.new_cases > median_cases),
    interpolate=True,
    alpha=0.25, label='中央値以上')

plt.fill_between(dfx.date, dfx.new_cases, median_cases,
    where=(dfx.new_cases <= median_cases),
    interpolate=True,
    alpha=0.25, label='中央値以下')

plt.gcf().autofmt_xdate()
date_format = mpl_dates.DateFormatter('%m/%d')
plt.gca().xaxis.set_major_formatter(date_format)

plt.xticks(rotation=45)
plt.ylabel('人数')
plt.title('COVID-19 東京: 感染者\n(2021)')
plt.legend(loc='best')
plt.tight_layout()
plt.show()
# %%


# 4) Plot line chart for severe_cases, new_deaths and fill area : 重症者 vs 死亡者 線グラフ

# Set the font to support Japanese
plt.rcParams['font.family'] = 'Meiryo'  # Meiryo, Yu Gothic
plt.style.use('fivethirtyeight')    # 'fivethirtyeight' 'ggplot'
plt.figure(figsize=(12,8))

df = raw
filter_by = (df['prefecture'] == 'Tokyo') & (df['date'] >= '2021-01-01')
dfx =  df[filter_by]    # Tokyo

plt.plot(dfx.date, dfx.severe_cases,linewidth=1)
plt.plot(dfx.date, dfx.new_deaths, color='#444444', linestyle='dashed', linewidth=1)

plt.fill_between(dfx.date, dfx.severe_cases, dfx.new_deaths,
    where=(dfx.severe_cases > dfx.new_deaths),
    interpolate=True,
    alpha=0.25, label='重症者')

plt.fill_between(dfx.date, dfx.new_deaths, 0,
    where=(dfx.new_deaths <= dfx.severe_cases),
    interpolate=True,
    alpha=0.25, label='死亡者')

plt.gcf().autofmt_xdate()
#date_format = mpl_dates.DateFormatter('%Y/%m/%d')
date_format = mpl_dates.DateFormatter('%m/%d')
plt.gca().xaxis.set_major_formatter(date_format)

plt.xticks(rotation=45)
plt.ylabel('人数')
plt.title('COVID-19 東京: 重症者 vs 死亡者\n(2021)')
plt.legend(loc='best')
plt.tight_layout()
plt.show()

# %%

# 5) Plot line chart for new_cases, severe_cases and fill area : 感染者 vs 重症者 線グラフ

# Set the font to support Japanese
plt.rcParams['font.family'] = 'Meiryo'  # Meiryo, Yu Gothic
plt.style.use('fivethirtyeight')    # 'fivethirtyeight' 'ggplot'
plt.figure(figsize=(12,5))

df = raw
filter_by = (df['prefecture'] == 'Tokyo') & (df['date'] >= '2021-01-01')
dfx =  df[filter_by]    # Tokyo

plt.plot(dfx.date, dfx.new_cases, linewidth=1)
plt.plot(dfx.date, dfx.severe_cases, color='#444444', linestyle='dashed', linewidth=1)

plt.fill_between(dfx.date, dfx.new_cases, dfx.severe_cases,
    where=(dfx.new_cases > dfx.severe_cases),
    interpolate=True,
    alpha=0.25, label='感染者')

plt.fill_between(dfx.date, dfx.severe_cases, 0,
    where=(dfx.severe_cases <= dfx.new_cases),
    interpolate=True,
    alpha=0.25, label='重症者')

plt.yscale('log')

plt.gcf().autofmt_xdate()
#date_format = mpl_dates.DateFormatter('%Y/%m/%d')
date_format = mpl_dates.DateFormatter('%m/%d')
plt.gca().xaxis.set_major_formatter(date_format)

plt.xticks(rotation=45)
plt.ylabel('人数: yscale(log)')
plt.title('COVID-19 東京: 感染者 vs 重症者\n(2021)')
plt.legend(loc='upper right')
plt.tight_layout()
plt.show()

# %%

# 6) Plot line chart for new_cases, severe_cases, new_deaths and fill area : 感染者 / 重症者 / 死亡者 線グラフ

# Set the font to support Japanese
plt.rcParams['font.family'] = 'Meiryo'  # Meiryo, Yu Gothic
plt.style.use('fivethirtyeight')    # 'fivethirtyeight' 'ggplot'
plt.figure(figsize=(12,7))

df = raw
filter_by = (df['prefecture'] == 'Tokyo') & (df['date'] >= '2021-01-01')
dfx =  df[filter_by]    # Tokyo

plt.plot(dfx.date, dfx.new_cases, color='#444444', linewidth=1)
plt.plot(dfx.date, dfx.severe_cases, color='#444444', linestyle='dashed', linewidth=1)
plt.plot(dfx.date, dfx.new_deaths, color='#444444', linestyle='dashed', linewidth=1)

plt.fill_between(dfx.date, dfx.new_cases, dfx.severe_cases,
    where=(dfx.new_cases > dfx.severe_cases),
    interpolate=True,
    alpha=0.25, label='感染者')

plt.fill_between(dfx.date, dfx.severe_cases, dfx.new_deaths,
    where=(dfx.severe_cases > dfx.new_deaths),
    interpolate=True,
    alpha=0.25, label='重症者')

plt.fill_between(dfx.date, dfx.new_deaths, 0,
    where=(dfx.new_deaths <= dfx.severe_cases),
    interpolate=True,
    alpha=0.25, label='死亡者')

plt.yscale('log')

plt.gcf().autofmt_xdate()
#date_format = mpl_dates.DateFormatter('%Y/%m/%d')
date_format = mpl_dates.DateFormatter('%m/%d')
plt.gca().xaxis.set_major_formatter(date_format)

plt.xticks(rotation=45)
plt.ylabel('人数: yscale(log)')
plt.title('COVID-19 東京: 感染者 / 重症者 / 死亡者\n(2021)')
plt.legend(loc='best')
plt.tight_layout()
plt.show()

# %%

# 7) Plot line chart for new_cases and fill area : 埼玉 vs 千葉  感染者 線グラフ

csv_file = 'data/csv/covid-19/japan/combined2.csv'
#csv_file = 'https://money-or-ikigai.com/menu/python/article/data/covid-19/combined2.csv'
raw = pd.read_csv(csv_file, parse_dates=['date'])
#raw.info()
#raw.head()

# Set the font to support Japanese
plt.rcParams['font.family'] = 'Meiryo'  # Meiryo, Yu Gothic
plt.style.use('fivethirtyeight')    # 'fivethirtyeight' 'ggplot'
plt.figure(figsize=(12,7))

# Filter Date
df = raw
filter_by = (df['date'] >= '2021-01-01')
dfx =  df[filter_by]

plt.plot(dfx.date, dfx.new_cases_saitama, color='#444444', linewidth=1)
plt.plot(dfx.date, dfx.new_cases_chiba, color='#444444', linestyle='dashed', linewidth=1)

plt.fill_between(dfx.date, dfx.new_cases_saitama, dfx.new_cases_chiba,
    where=(dfx.new_cases_saitama > dfx.new_cases_chiba),
    interpolate=True,
    alpha=0.25, label='埼玉')

plt.fill_between(dfx.date, dfx.new_cases_saitama, dfx.new_cases_chiba,
    where=(dfx.new_cases_saitama <= dfx.new_cases_chiba),
    interpolate=True,
    alpha=0.25, label='千葉')

#plt.yscale('log')

plt.gcf().autofmt_xdate()
#date_format = mpl_dates.DateFormatter('%Y/%m/%d')
date_format = mpl_dates.DateFormatter('%m/%d')
plt.gca().xaxis.set_major_formatter(date_format)

plt.xticks(rotation=45)
plt.ylabel('人数)')
plt.title('COVID-19 感染者: 埼玉 vs 千葉\n(2021)')
plt.legend(loc='upper right')
plt.tight_layout()
plt.show()

# %%

# 8) Plot line chart for new_cases and fill area : 神奈川 vs 埼玉  感染者 線グラフ

# Set the font to support Japanese
plt.rcParams['font.family'] = 'Meiryo'  # Meiryo, Yu Gothic
plt.style.use('fivethirtyeight')    # 'fivethirtyeight' 'ggplot'
plt.figure(figsize=(12,7))

# Filter Date
df = raw
filter_by = (df['date'] >= '2021-01-01')
dfx =  df[filter_by]

plt.plot(dfx.date, dfx.new_cases_kanagawa, color='#444444', linewidth=1)
plt.plot(dfx.date, dfx.new_cases_saitama, color='#444444', linestyle='dashed', linewidth=1)

plt.fill_between(dfx.date, dfx.new_cases_kanagawa, dfx.new_cases_saitama,
    where=(dfx.new_cases_kanagawa > dfx.new_cases_saitama),
    interpolate=True,
    alpha=0.25, label='神奈川')

plt.fill_between(dfx.date, dfx.new_cases_kanagawa, dfx.new_cases_saitama,
    where=(dfx.new_cases_kanagawa <= dfx.new_cases_saitama),
    interpolate=True,
    alpha=0.25, label='埼玉')

#plt.yscale('log')

plt.gcf().autofmt_xdate()
#date_format = mpl_dates.DateFormatter('%Y/%m/%d')
date_format = mpl_dates.DateFormatter('%m/%d')
plt.gca().xaxis.set_major_formatter(date_format)

plt.xticks(rotation=45)
plt.ylabel('人数)')
plt.title('COVID-19 感染者: 神奈川 vs 埼玉\n(2021)')
plt.legend(loc='upper right')
plt.tight_layout()
plt.show()

# %%

# 9) Plot line chart for new_cases and fill area : 東京 vs 大阪  感染者 線グラフ

# Set the font to support Japanese
plt.rcParams['font.family'] = 'Meiryo'  # Meiryo, Yu Gothic
plt.style.use('fivethirtyeight')    # 'fivethirtyeight' 'ggplot'
plt.figure(figsize=(12,7))

# Filter Date
df = raw
filter_by = (df['date'] >= '2021-01-01')
dfx =  df[filter_by]

plt.plot(dfx.date, dfx.new_cases_tokyo, color='#444444', linewidth=1)
plt.plot(dfx.date, dfx.new_cases_osaka, color='#444444', linestyle='dashed', linewidth=1)

plt.fill_between(dfx.date, dfx.new_cases_tokyo, dfx.new_cases_osaka,
    where=(dfx.new_cases_tokyo > dfx.new_cases_osaka),
    interpolate=True,
    alpha=0.25, label='東京')

plt.fill_between(dfx.date, dfx.new_cases_tokyo, dfx.new_cases_osaka,
    where=(dfx.new_cases_tokyo <= dfx.new_cases_osaka),
    interpolate=True,
    alpha=0.25, label='大坂')

#plt.yscale('log')

plt.gcf().autofmt_xdate()
#date_format = mpl_dates.DateFormatter('%Y/%m/%d')
date_format = mpl_dates.DateFormatter('%m/%d')
plt.gca().xaxis.set_major_formatter(date_format)

plt.xticks(rotation=45)
plt.ylabel('人数)')
plt.title('COVID-19 感染者: 東京 vs 大阪\n(2021)')
plt.legend(loc='upper right')
plt.tight_layout()
plt.show()

# %%