-
AmazonとGoogleの架空の株価をプログラムでランダムに生成してCSVファイルに保存するプログラムを作成する
行6-9ではPythonのライブラリを取り込んでいます。
行20ではCSVファイルのヘッダーを定義しています。
行21ではCSVファイルのパスとファイル名を定義しています。
行23-25ではCSVファイルのヘッダー情報を書き込んでいます。
行31-53のwhileループでは、AmazonとGoogleの架空の株価をランダムに生成してCSVファイルに保存しています。
このwhileループはWindowsのコマンドプロンプトを閉じるまで永久ループさせます。
行33ではCSVファイルを追加モードで開いています。
行38-44ではCSVファイルに追加するデータを定義しています。
行46ではデータ(Amazon/Goolgeの架空の株価)をCSVファイルに追加しています。
行48-49ではAmazon/Googleの架空の株価をランダムに生成しています。
行51ではtimeのsleep()メソッドで1秒間スリープしています。
# Article021_gen1_data.py
# run from Win11 command prompt
# cd C:\xps8700\PythonProject
# python Article021_gen1_data.py

import csv
import random
import time
import datetime as dt

symbol1 = 'AMZN'
symbol2 = 'GOOGL'

date_time = dt.datetime.now().strftime('%Y-%m-%d %H:%M:%S')
symbol_1 = symbol1
price_1 = 1000
symbol_2 = symbol2
price_2 = 1000

fieldnames = ['date_time', 'symbol_1','price_1','symbol_2','price_2']
data_csv_file = 'data/csv/article021/data(1).csv'

with open(data_csv_file, 'w') as csv_file:
    csv_writer = csv.DictWriter(csv_file, fieldnames=fieldnames)
    csv_writer.writeheader()

cnt = 0

print('Startd While loop...')

while True:
    print(cnt)
    with open(data_csv_file, 'a') as csv_file:
        csv_writer = csv.DictWriter(csv_file, fieldnames=fieldnames)

        time_stamp = dt.datetime.now().strftime('%Y-%m-%d %H:%M:%S')

        info = {
            'date_time': time_stamp,
            'symbol_1': symbol1,
            'price_1': price_1,
            'symbol_2': symbol2,
            'price_2': price_2
        }

        csv_writer.writerow(info)

        price_1 = price_1 + random.randint(-6, 8)
        price_2 = price_2 + random.randint(-5, 6)

    time.sleep(1)   # sleep 1 sec

    cnt += 1

print('Ended While loop!')
 図1
図1はCSVファイルのヘッダーとAmazonとGoogleの架空の株価です。
株価はランダムに生成しています。
図1
図1はCSVファイルのヘッダーとAmazonとGoogleの架空の株価です。
株価はランダムに生成しています。
-
Windowsのコマンドプロンプトからプログラムを実行する
Windows 11の「スタート」ボタンをクリックしたら検索窓に「コマンドプロンプト」を入力して、コマンドプロンプトを開きます。
コマンドプロンプトのウィンドウから「cd」コマンドを入力してPythonのプログラムが格納されているフォルダに移動します。
ここでは「C:\xps8700\PythonProject」に移動しています。
次に「python」の引数にプログラム名を指定してプログラムを起動させます。
ここでは「Article021_gen1_data.py」のプログラムを起動しています。
cd C:\xps8700\PythonProject
python Article021_gen1_data.py
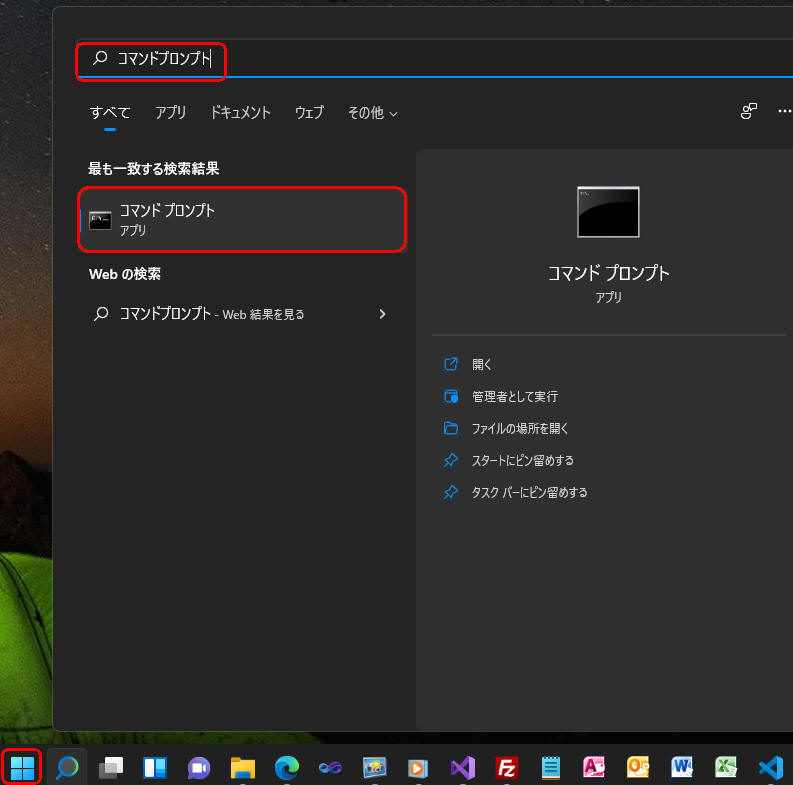 図2-1
図2-1はWindows 11の「スタート」ボタンをクリックして検索窓に「コマンドプロンプト」を入力している画面です。
図2-1
図2-1はWindows 11の「スタート」ボタンをクリックして検索窓に「コマンドプロンプト」を入力している画面です。
 図2-2
図2-2はコマンドプロンプトのウィンドウから「cd」を入力してカレンドディレクトリを移動させて、
Pythonのプログラムを起動させている画面です。
図2-2
図2-2はコマンドプロンプトのウィンドウから「cd」を入力してカレンドディレクトリを移動させて、
Pythonのプログラムを起動させている画面です。
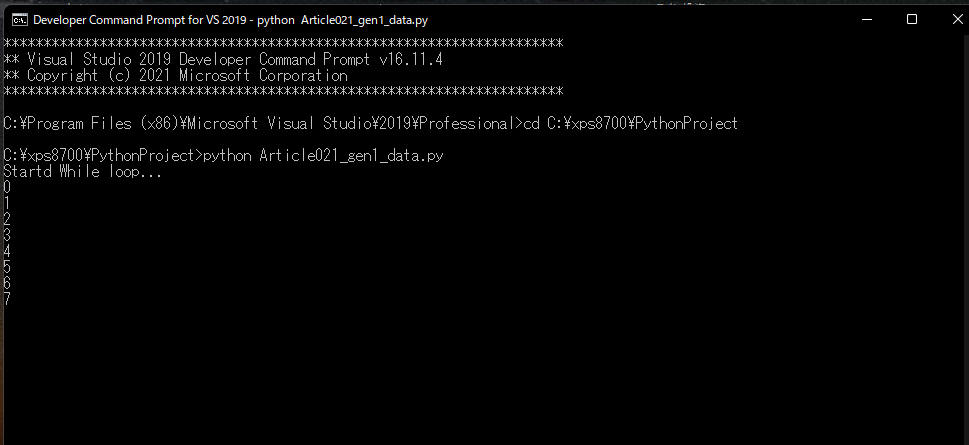 図2-3
図2-3はPythonのプログラム「Article021_gen1_data.py」が起動した画面です。
画面にループカウントが表示されています。
このプログラムはWindowsのコマンドプロンプトを閉じるまで永久ループします。
図2-3
図2-3はPythonのプログラム「Article021_gen1_data.py」が起動した画面です。
画面にループカウントが表示されています。
このプログラムはWindowsのコマンドプロンプトを閉じるまで永久ループします。
-
ここで解説したコードをまとめて掲載
最後にここで解説したすべてのコードをまとめて掲載しましたので参考にしてください。
# Article021_gen1_data.py
# run from Win11 command prompt
# cd C:\xps8700\PythonProject
# python Article021_gen1_data.py

import csv
import random
import time
import datetime as dt

symbol1 = 'AMZN'
symbol2 = 'GOOGL'

date_time = dt.datetime.now().strftime('%Y-%m-%d %H:%M:%S')
symbol_1 = symbol1
price_1 = 1000
symbol_2 = symbol2
price_2 = 1000

fieldnames = ['date_time', 'symbol_1','price_1','symbol_2','price_2']
data_csv_file = 'data/csv/article021/data(1).csv'

with open(data_csv_file, 'w') as csv_file:
    csv_writer = csv.DictWriter(csv_file, fieldnames=fieldnames)
    csv_writer.writeheader()

cnt = 0

print('Startd While loop...')

while True:
    print(cnt)
    with open(data_csv_file, 'a') as csv_file:
        csv_writer = csv.DictWriter(csv_file, fieldnames=fieldnames)

        time_stamp = dt.datetime.now().strftime('%Y-%m-%d %H:%M:%S')

        info = {
            'date_time': time_stamp,
            'symbol_1': symbol1,
            'price_1': price_1,
            'symbol_2': symbol2,
            'price_2': price_2
        }

        csv_writer.writerow(info)
        #print(cnt, time_stamp, symbol1, price_1, symbol2, price_2)

        price_1 = price_1 + random.randint(-6, 8)
        price_2 = price_2 + random.randint(-5, 6)

    time.sleep(1)   # sleep 1 sec

    cnt += 1
    # if cnt > 100:
    #     break

print('Ended While loop!')
-
Matplotlibのplot()メソッドで株価の線グラフを作成する関数(plot_line)を作成する
行2-8ではPythonのライブラリを取り込んでいます。
行12ではMatplotlibのstyle.use()メソッドでグラフのスタイルを設定しています。
行14ではCSVファイルのパスを定義しています。
行16-42はplot_line()関数です。
この関数ではMatplotlibのplot()メソッドで株価の線グラフを作成します。
行17ではPandasのread_csv()メソッドでCSVファイルのデータを取り込んでDataFrameに格納しています。
行18ではDataFrameのto_datetime()メソッドでstr型の日付をdatetime64型に変換しています。
行20では日付を変数「x」に格納しています。
行21-22ではAmazonのシンボルと株価を取得して変数に格納しています。
行23-24ではGoogleのシンボルと株価を取得して変数に格納しています。
行26ではMatplotlibのcla()メソッドでカレントのグラフを初期化しています。
行28-29ではMatplotlibのplot()メソッドでAmazonとGoogleの線グラフを作成しています。
行33-35ではX軸に表示する日時を「mm:ss」の形式にフォーマットしています。
行36ではMatplotlibのlegend()メソッドで凡例の表示位置を「upper left」に設定しています。
行37-38ではX軸とY軸のラベルを設定しています。
行39ではグラフのタイトルを設定しています。
# Article021_Matplotlib Plotting Live Data in Real-Time Part1(1).py
import random
from itertools import count
import pandas as pd
import matplotlib.pyplot as plt
import matplotlib.dates as mpl_dates
from matplotlib.animation import FuncAnimation
import datetime as dt

# 1) Read the csv file and  draw an animation line chart

plt.style.use('fivethirtyeight')

csv_file = 'data/csv/article021/data(1).csv'

def plot_line():
    df = pd.read_csv(csv_file)
    df['date_time'] = pd.to_datetime(df['date_time'], format='%Y-%m-%d %H:%M:%S')
    # date_time, symbol_1, price_1, symbol_2, price_2
    x = df['date_time']
    symbol1 = df['symbol_1'].values[0]
    y1 = df['price_1']
    symbol2 = df['symbol_2'].values[0]
    y2 = df['price_2']

    plt.cla()

    plt.plot(x, y1, label=symbol1)
    plt.plot(x, y2, label=symbol2)

    today = dt.datetime.today().strftime('%Y/%m/%d %H:%M:%S')

    plt.gcf().autofmt_xdate()
    date_format = mpl_dates.DateFormatter('%M:%S')
    plt.gca().xaxis.set_major_formatter(date_format)
    plt.legend(loc='upper left')
    plt.xlabel('(mm:ss)')
    plt.ylabel('Price (USD)')
    plt.title(f'Amazon / Google Real Time Stock Price\n({today})')

    plt.tight_layout()
 図3
図3はVisual Studio Codeの画面です。関数「plot_line()」が定義されています。
図3
図3はVisual Studio Codeの画面です。関数「plot_line()」が定義されています。
-
MatplotlibのFuncAnimation()メソッドから呼び出す関数(animate)を作成する
行1-2では関数「animate()」を定義しています。
行2では関数「plot_line()」を呼び出しています。
plot_line()では、Amazon/Googleの線グラフを作成します。
行4ではMatplotlibのFuncAnimation()メソッドを実行してグラフをアニメーション化します。
FuncAnimation()の引数1にはカレントのfigure(図)を指定します。
ここではMatplotlibのgcf()メソッド(Get the current figure)でカレントのfigureを取得しています。
引数2にはアニメーション化する関数を指定します。
引数3にはanimate()を呼び出す間隔をミリセカンドで指定します。
ここでは1000ms(1秒)を指定しています。
def animate(i):
    plot_line()

ani = FuncAnimation(plt.gcf(), animate, interval=1000)

plt.show()
 図4
図4はVisual Studio Codeの画面です。関数「animate()」が定義されています。
図4
図4はVisual Studio Codeの画面です。関数「animate()」が定義されています。
-
アニメーションを作成するプログラムを実行する
Visual Studio Code(VSC)から[Ctrl+Enter]でプログラムを実行します。
Amazon/Googleの架空の株価がアニメーション化されて表示されます。
1秒間隔で株価が刻々と変わっているのが分かります。
 図5
図5はAmazon/Googleの架空の株価がアニメーション化されている画面です。
グラフの見出しには日時が表示されています。日時はデジタル時計のように1秒間隔で変わります。
グラフのX軸には「分」と「秒」が表示されます。
後述するプログラムではCOVID-19、GAFAの株価、仮想通貨(暗号通貨)のリアルデータを使用してアニメーションを作成します。
図5
図5はAmazon/Googleの架空の株価がアニメーション化されている画面です。
グラフの見出しには日時が表示されています。日時はデジタル時計のように1秒間隔で変わります。
グラフのX軸には「分」と「秒」が表示されます。
後述するプログラムではCOVID-19、GAFAの株価、仮想通貨(暗号通貨)のリアルデータを使用してアニメーションを作成します。
-
ここで解説したコードをまとめて掲載
最後にここで解説したすべてのコードをまとめて掲載しましたので参考にしてください。
# Article021_Matplotlib Plotting Live Data in Real-Time Part1(1).py
import random
from itertools import count
import pandas as pd
import matplotlib.pyplot as plt
import matplotlib.dates as mpl_dates
from matplotlib.animation import FuncAnimation
import datetime as dt

# 1) Read the csv file and  draw an animation line chart

plt.style.use('fivethirtyeight')

csv_file = 'data/csv/article021/data(1).csv'

def plot_line():
    df = pd.read_csv(csv_file)
    df['date_time'] = pd.to_datetime(df['date_time'], format='%Y-%m-%d %H:%M:%S')
    # date_time, symbol_1, price_1, symbol_2, price_2
    x = df['date_time']
    symbol1 = df['symbol_1'].values[0]
    y1 = df['price_1']
    symbol2 = df['symbol_2'].values[0]
    y2 = df['price_2']

    plt.cla()

    plt.plot(x, y1, label=symbol1)
    plt.plot(x, y2, label=symbol2)

    today = dt.datetime.today().strftime('%Y/%m/%d %H:%M:%S')

    plt.gcf().autofmt_xdate()
    date_format = mpl_dates.DateFormatter('%M:%S')
    plt.gca().xaxis.set_major_formatter(date_format)
    plt.legend(loc='upper left')
    plt.xlabel('(mm:ss)')
    plt.ylabel('Price (USD)')
    plt.title(f'Amazon / Google Real Time Stock Price\n({today})')

    plt.tight_layout()

def animate(i):
    plot_line()

ani = FuncAnimation(plt.gcf(), animate, interval=1000)

plt.show()
-
finnhubサイトのアカウントを作成してAPIキーを取得する
「finnhub」のWebサイトに移動したら「Get free API Key」ボタンをクリックします。
あとは指示に従って必要な情報を入力すると「API Key」の画面に移動します。
この画面に表示されている「API Key」をコピペしてメモ帳などに保存しておきます。
ここで取得したAPI Keyは、次のステップでWindowsの環境変数に保存します。
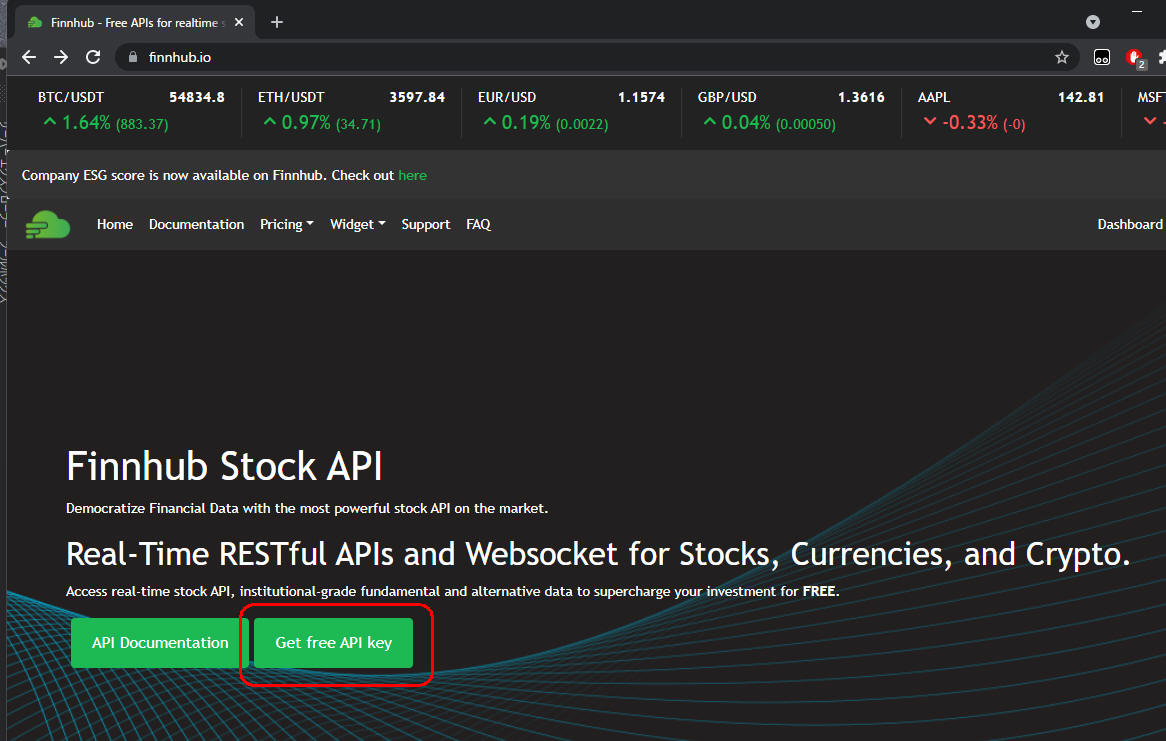 図6-1
図6-1は「API Key」の申請画面です。
図6-1
図6-1は「API Key」の申請画面です。
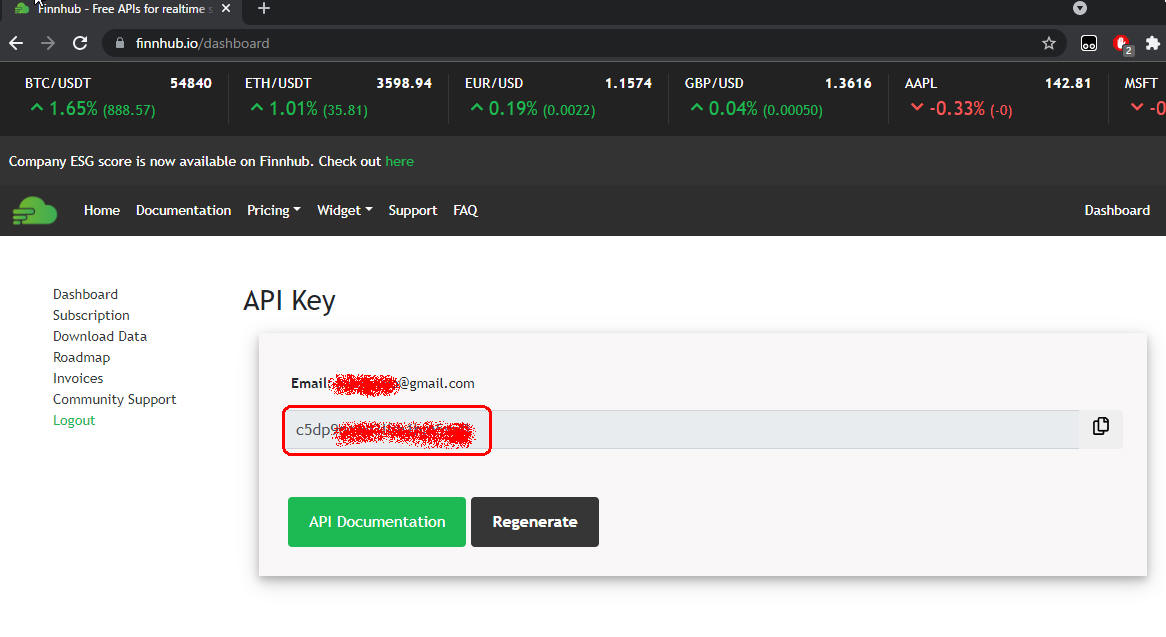 図6-2
図6-2は「API Key」が表示されている画面です。このAPI Keyをコピペしてメモ帳などに保存しておきます。
図6-2
図6-2は「API Key」が表示されている画面です。このAPI Keyをコピペしてメモ帳などに保存しておきます。
-
APIキーをWindowsの環境変数に保存する
Windows 11の「スタート」ボタンをクリックしたら検索窓に「環境変数を編集」を入力して「環境変数を編集」のコントロールパネルを開きます。
「環境変数」の画面が表示されたら[新規]のボタンをクリックして「API-KEY」を登録します。
ここでは変数に「FINNHUB_API_KEY」を入力しています。値には「API KEY」を入力します。
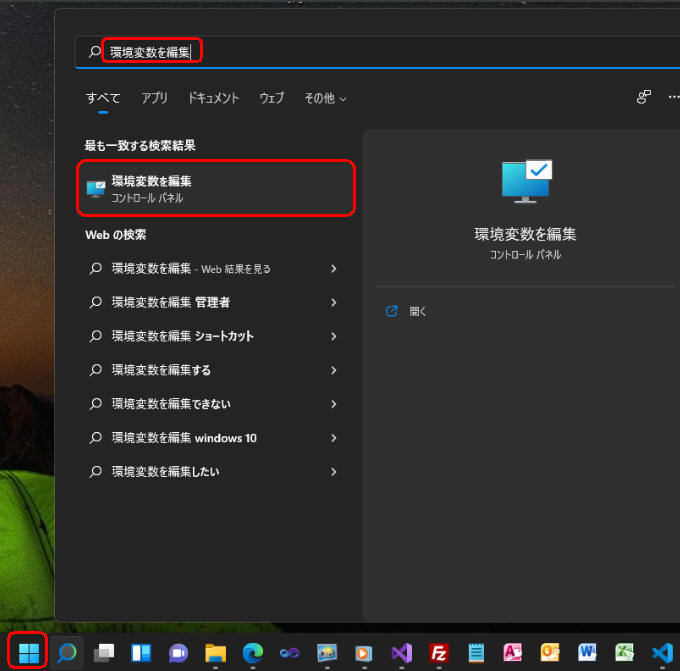 図7-1
図7-1はWindows 11の「スタート」から「環境変数を編集」を入力して検索している画面です。
図7-1
図7-1はWindows 11の「スタート」から「環境変数を編集」を入力して検索している画面です。
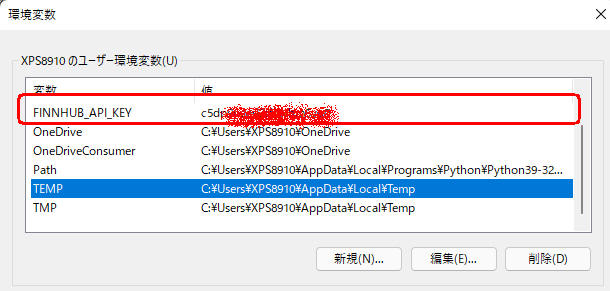 図7-2
図7-2はWindows 11の「環境変数」画面です。ここから新規の環境変数を登録します。
図7-2
図7-2はWindows 11の「環境変数」画面です。ここから新規の環境変数を登録します。
-
COVID-19のリアルタイムデータを取得してCSVファイルに保存するプログラムを作成する
行10-14ではPythonのライブラリを取り込んでいます。「finnhub」のライブラリは「pip install finnhub-python==2.4.5」でインストールできます。
行17ではosのevviron.get()メソッドでWindows 11の環境変数からfinnhubのAPI-KEYを取得して変数に保存しています。
行20ではfinnhbuのClient()メソッドを実行してAPIをセットアップしています。
行23ではCSVファイルのパスを定義しています。
行29-44のwhileループでは2秒間隔でCOVID-19の米国のデータを取得しています。
行33のcovid19()メソッドでは米国の最新のCOVID-19データを取得しています。
レスポンスとして以下のようなデータが返ります。
[{'state': 'California',
  'case': 4680659,
  'death': 70144,
  'updated': '2021-10-09 19:02:03'},
 {'state': 'Texas',
  'case': 4131336,
  'death': 67750,
  'updated': '2021-10-09 19:02:03'},
 {'state': 'Florida',
  'case': 3647747,
  'death': 56410,
  'updated': '2021-10-09 19:02:03'},
 {'state': 'New York',
  'case': 2543528,
  'death': 56204,
  'updated': '2021-10-09 19:02:03'},
 {'state': 'Illinois',
  'case': 1650108,
  'death': 27965,
  'updated': '2021-10-09 19:02:03'},
 {'state': 'Georgia',
  'case': 1602667,
  'death': 27142,
  'updated': '2021-10-09 19:02:03'},
 {'state': 'Pennsylvania',
 :::::: 省略 ::::::
  'death': 0,
  'updated': '2021-04-20 17:00:47'},
 {'state': 'District Of Columbia',
  'case': 62266,
  'death': 1182,
  'updated': '2021-10-09 19:02:03'}]
行37ではcovid19()メソッドで取得したCOVID-19のデータをPandasのDataFrameに取り込んでいます。
行38ではPandasのto_datetime()メソッドで日付をstr型からdatetime64型に変換しています。
行40ではDataFrameのto_csv()メソッドでCOVID-19のデータをCSVファイルに書き出しています。
to_csv()の引数1にはCSVファイルのパスを指定します。
引数2には「mode='a'」を指定して追加モードにしています。
引数3には「header=False」を指定してヘッダーを出力しないようにしています。
引数4には「index=False」を指定してDataFrameのindexを出力しないようにしています。
行42ではtimeのsleep()メソッドで2秒スリープしています。
行33のAPIコールでは「Time Out」エラーになる可能性があるので、
これら一連の処理は「try...except...else」内で処理しています。
行33のAPIコールでTime Outが発生したときは行34-35が実行されます。
そして行36-40の処理はスキップされます。
行37-40の処理はAPIコールが正常に終了したときのみ実行されます。
# Article021_gen2_covid-19.py
# Finnhub Stock API: https://finnhub.io/
# Tip: https://finnhub.io/pricing   Free: 60 API calls / minute (1sec)
# Tip: https://finnhub.io/docs/api/covid-19
# Run from Win11 command prompt
# cd C:\xps8700\PythonProject
# python Article021_gen2_covid-19.py

# 0) Import the necessary libraries
import os
import time
import datetime as dt
import pandas as pd
import finnhub  # pip install finnhub-python==2.4.5

# 1) GET an API-key
api_key = os.environ.get('FINNHUB_API_KEY')

# 2) Set up client
finnhub_client = finnhub.Client(api_key=api_key)

# 3) Get US COVID-19 Data via API
csv_file = 'data/csv/article021/covid-19(us).csv'

cnt = 0

print('Startd While loop...')

while True:
    print(cnt)

    try:
        res = finnhub_client.covid19()
    except Exception as e:
        print('finnhub_client.covid19() exception error: ', e)
    else:
        df = pd.DataFrame(res)
        df['updated'] = pd.to_datetime(df['updated'], format='%Y-%m-%d %H:%M:%S')
        # state(str), case(total), death(total), updated(datetime64)
        df.to_csv(csv_file, mode='a', header=False, index=False)     # append mode, no header

    time.sleep(2)   # sleep 2 secs

    cnt += 1

print('Ended While loop!')
 図8
図8はVisual Studio Code(VSC)の画面です。
図8
図8はVisual Studio Code(VSC)の画面です。
-
Windowsのコマンドプロンプトからプログラムを実行する
Windowsのコマンドプロンプトを表示したら「cd」コマンドを入力してカレンドのフォルダをPythonのプログラムが格納されているフォルダに移動します。
ここでは「C:\xps8700\PythonProject」に移動しています。
次にPythonの引数に「Article021_gen2_covid-19.py」を指定してプログラムを起動します。
cd C:\xps8700\PythonProject
python Article021_gen2_covid-19.py
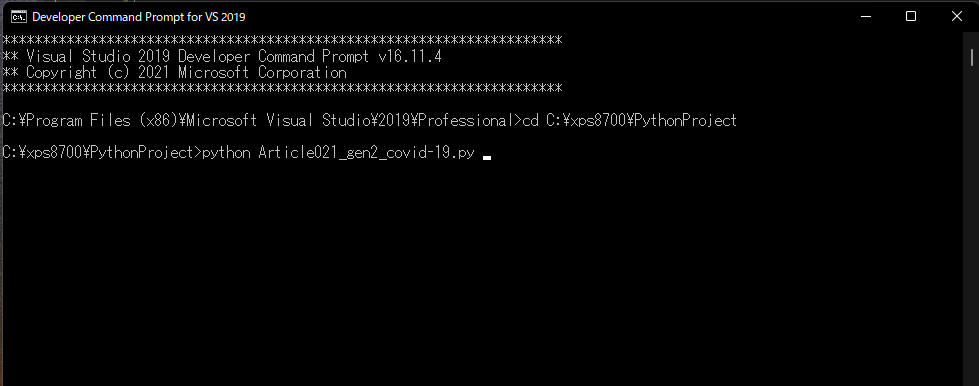 図9-1
図9-1はコマンドプロンプトから「cd」を入力してカレントのフォルダを変更してプログラムを実行している画面です。
図9-1
図9-1はコマンドプロンプトから「cd」を入力してカレントのフォルダを変更してプログラムを実行している画面です。
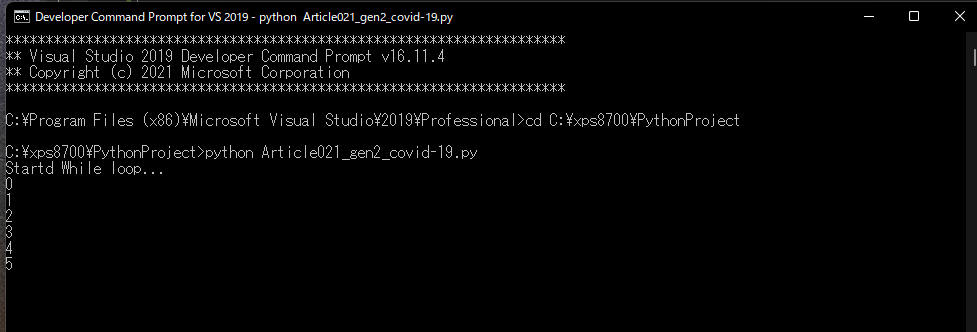 図9-2
図9-2はプログラムが実行されている画面です。ループカウントが画面に表示されています。
このプログラムはコマンドプロンプトの窓を閉じるまで永久ループします。
図9-2
図9-2はプログラムが実行されている画面です。ループカウントが画面に表示されています。
このプログラムはコマンドプロンプトの窓を閉じるまで永久ループします。
-
ここで解説したコードをまとめて掲載
最後にここで解説したすべてのコードをまとめて掲載しましたので参考にしてください。
# Article021_gen2_covid-19.py
# Finnhub Stock API: https://finnhub.io/
# Tip: https://finnhub.io/pricing   Free: 60 API calls / minute (1sec)
# Tip: https://finnhub.io/docs/api/covid-19
# Run from Win11 command prompt
# cd C:\xps8700\PythonProject
# python Article021_gen2_covid-19.py

# 0) Import the necessary libraries
import os
import time
import datetime as dt
import pandas as pd
import finnhub  # pip install finnhub-python==2.4.5

# 1) GET an API-key
api_key = os.environ.get('FINNHUB_API_KEY')

# 2) Set up client
finnhub_client = finnhub.Client(api_key=api_key)

# 3) Get US COVID-19 Data via API
csv_file = 'data/csv/article021/covid-19(us).csv'

cnt = 0

print('Startd While loop...')

while True:
    print(cnt)

    try:
        res = finnhub_client.covid19()
    except Exception as e:
        print('finnhub_client.covid19() exception error: ', e)
    else:
        df = pd.DataFrame(res)
        df['updated'] = pd.to_datetime(df['updated'], format='%Y-%m-%d %H:%M:%S')
        # state(str), case(total), death(total), updated(datetime64)
        df.to_csv(csv_file, mode='a', header=False, index=False)     # append mode, no header

    time.sleep(2)   # sleep 2 secs

    cnt += 1
    # if cnt > 10:
    #     break

print('Ended While loop!')
-
CSVファイルからCOVID-19のリアルタイムデータを取り込んでアニメーション化するプログラムを作成する
# Article021_Matplotlib Plotting Live Data in Real-Time Part2 COVID(1).py
# Tip: https://finnhub.io/pricing   Free: 60 API calls / minute (1sec)
# Tip: https://finnhub.io/docs/api/covid-19
# %%
# Import the necessary libraries
import pandas as pd
import matplotlib.pyplot as plt
import matplotlib.dates as mpl_dates
import matplotlib.style as style
from matplotlib.animation import FuncAnimation
import datetime as dt
from datetime import timedelta
import numpy as np
import warnings
warnings.simplefilter('ignore')

# Set the font to support Japanese
plt.rcParams['font.family'] = 'Meiryo'
plt.style.use('fivethirtyeight')
plt.figure(figsize=(10, 9)) # width, height
 図10
図10はVisual Studio Code(VSC)の画面です。ここではPythonのライブラリを取り込んでいます。
図10
図10はVisual Studio Code(VSC)の画面です。ここではPythonのライブラリを取り込んでいます。
-
Matplotlibのbarh()メソッドで水平棒グラフを作成する関数(plot_barh)を作成する
def plot_barh():
    plt.cla()

    csv_file = 'data/csv/article021/covid-19(us).csv'
    df = pd.read_csv(csv_file)
    df['date'] = pd.to_datetime(df['date'], format='%Y-%m-%d %H:%M:%S')
    # state, cases, deaths, date

    # Get the latest covid-19 cases for each state
    dfx = df.groupby(['state']).last().reset_index()

    # Select top 20 states
    dfx.sort_values(by='cases', ascending=False, inplace=True)
    dfx.reset_index(inplace=True)
    dfx.drop(dfx[dfx.index >= 20].index, inplace=True)

    # Sort cases in descending order
    dfx = dfx.sort_values('cases', ascending=True)
    rows = dfx.shape[0] - 1
    for index, row in dfx.iterrows():
        plt.barh(row.state, row.cases)
        plt.text(row.cases + 3, rows - index, f'{row.cases:,}' , fontsize=10)

    today = dt.datetime.today().strftime('%Y/%m/%d %H:%M:%S')

    plt.grid(False)
    plt.title(f'COVID-19 New Cases in US (Top 20 States)\n({today})')
    plt.xlabel('Total Cases')
    plt.ylabel('States')
    plt.tight_layout()
 図11
図11はVisual Studio Code(VSC)の画面です。関数(plot_barh)が定義されています。
図11
図11はVisual Studio Code(VSC)の画面です。関数(plot_barh)が定義されています。
-
MatplotlibのFuncAnimation()メソッドから呼び出す関数(animate)を作成する
def animate(i):
    plot_barh()

ani = FuncAnimation(plt.gcf(), animate, interval=1000)

plt.show()
 図12
図12はVisual Studio Code(VSC)の画面です。関数(animate)が定義されています。
図12
図12はVisual Studio Code(VSC)の画面です。関数(animate)が定義されています。
-
COVID-19のデータをアニメーション化するプログラムを実行する
Visual Studio Codeから[Ctrl + Enter]でプログラムを実行します。
米国のCOVID-19のリアルタイムデータが1秒単位で更新されて表示されます。
 図13
図13はプログラムの実行結果です。米国のCOVID-19の感染者がリアルタイムでアニメーション化されています。
グラフのタイトルには日時が表示されています。日時はデジタル時計のように1秒単位で変わります。
水平棒グラフには米国の感染者上位20の州が表示されます。横棒の右端には感染者数(累計)が表示されます。
図13
図13はプログラムの実行結果です。米国のCOVID-19の感染者がリアルタイムでアニメーション化されています。
グラフのタイトルには日時が表示されています。日時はデジタル時計のように1秒単位で変わります。
水平棒グラフには米国の感染者上位20の州が表示されます。横棒の右端には感染者数(累計)が表示されます。
-
ここで解説したコードをまとめて掲載
最後にここで解説したすべてのコードをまとめて掲載しましたので参考にしてください。
# Article021_Matplotlib Plotting Live Data in Real-Time Part2 COVID(1).py
# Tip: https://finnhub.io/pricing   Free: 60 API calls / minute (1sec)
# Tip: https://finnhub.io/docs/api/covid-19

# Import the necessary libraries
import pandas as pd
import matplotlib.pyplot as plt
import matplotlib.dates as mpl_dates
import matplotlib.style as style
from matplotlib.animation import FuncAnimation
import datetime as dt
from datetime import timedelta
import numpy as np
import warnings
warnings.simplefilter('ignore')

# Set the font to support Japanese
plt.rcParams['font.family'] = 'Meiryo'
plt.style.use('fivethirtyeight')
plt.figure(figsize=(10, 9)) # width, height 10, 20

# 1) Read the csv file and  draw an animation line chart

def plot_barh():
    plt.cla()

    csv_file = 'data/csv/article021/covid-19(us).csv'
    df = pd.read_csv(csv_file)
    df['date'] = pd.to_datetime(df['date'], format='%Y-%m-%d %H:%M:%S')
    #df['date_only'] = df['date'].dt.date
    # state, cases, deaths, date

    # Get the latest covid-19 cases for each state
    dfx = df.groupby(['state']).last().reset_index()

    # Select top 20 states
    dfx.sort_values(by='cases', ascending=False, inplace=True)
    dfx.reset_index(inplace=True)
    dfx.drop(dfx[dfx.index >= 20].index, inplace=True)

    # Sort cases in descending order
    dfx = dfx.sort_values('cases', ascending=True)
    rows = dfx.shape[0] - 1
    for index, row in dfx.iterrows():
        plt.barh(row.state, row.cases)
        plt.text(row.cases + 3, rows - index, f'{row.cases:,}' , fontsize=10)

    today = dt.datetime.today().strftime('%Y/%m/%d %H:%M:%S')

    plt.grid(False)
    plt.title(f'COVID-19 New Cases in US (Top 20 States)\n({today})')
    plt.xlabel('Total Cases')
    plt.ylabel('States')
    plt.tight_layout()

def animate(i):
    plot_barh()

ani = FuncAnimation(plt.gcf(), animate, interval=1000)

plt.show()
-
仮想通貨(暗号通貨)の価格をリアルタイムで取得してCSVファイルに保存するプログラムを作成する
# Article021_gen4_crypto.py
# Finnhub Stock API: https://finnhub.io/
# Tip: https://finnhub.io/pricing   Free: 60 API calls / munute (1sec)
# Run from Win11 command prompt
# cd C:\xps8700\PythonProject
# python Article021_gen4_crypto.py

# 0) Import the necessary libraries
import os
import time
import datetime
import calendar
import pandas as pd
import finnhub  # pip install finnhub-python==2.4.5
import warnings
warnings.simplefilter('ignore')

# 1) GET an API-key
api_key = os.environ.get('FINNHUB_API_KEY')

# 2) Setup client
finnhub_client = finnhub.Client(api_key=api_key)
 図14
図14はVisual Stuio Code(VSC)の画面です。ここではPythonのライブラリを取り込んでAPIのセットアップを行っています.
図14
図14はVisual Stuio Code(VSC)の画面です。ここではPythonのライブラリを取り込んでAPIのセットアップを行っています.
-
仮想通貨(暗号通貨)の価格データを取得する関数(get_crypto_candles)を作成する
行18のcrypto_candles()メソッドの使い方についてはドキュメントを参照してください。
crypto_candles()の引数1には仮想通貨(暗号通貨)のシンボルを指定します。
ここでは「BINANCE:BTCUSDT」を指定しています。仮想通貨(暗号通貨)の場合、取引所も指定する必要があります。
引数2のresolutionには「1」秒を指定しています。
引数3には開始時間をUNIXのtimestamp型で指定します。
ここでは現在の「時刻 - 60秒」を指定しています。
引数4には終了時間をUNIXのtimestamp型で指定します。
ここでは現在の時刻を指定しています。
crypto_candles()からは以下のようなレスポンスが返ります。
つまり、ローソク足チャートを作成するための情報がすべて含まれています。
なお、timestampはUNIX型で格納されているので変換する必要があります。
行26ではtimestampをUNIX型から通常の日付型に変換しています。
{
    'c': [54705.91],
    'h': [54747.28],
    'l': [54703.48],
    'o': [54746.63],
    's': 'ok',
    't': [1633809120],
    'v': [28.01257]
}
def get_crypto_candles(symbol):     # 'BINANCE:BTCUSDT'
    resolution = '1'    # 1, 5, 15, 30, 60, D, W, M
    secs = 60
    cur_datetime = datetime.datetime.utcnow() - datetime.timedelta(seconds=secs)
    cur_timetuple = cur_datetime.utctimetuple()
    cur_timestamp = calendar.timegm(cur_timetuple)
    ts_from = cur_timestamp     # UNIX timestamp. Interval initial value

    cur_datetime = datetime.datetime.utcnow()
    cur_timetuple = cur_datetime.utctimetuple()
    cur_timestamp = calendar.timegm(cur_timetuple)
    ts_to = cur_timestamp       # UNIX timestamp. Interval initial value

    symbol1, symbol2 = symbol.split(':')   # BINANCE:BTCUSDT, BINANCE:ETHUSDT, BINANCE:LTCUSDT

    try:
        # Crypto candles
        res = finnhub_client.crypto_candles(symbol, resolution, ts_from, ts_to)
    except Exception as e:
        print(f'crypto_candles({symbol},{resolution}) exception error: ', e)
    else:
        if res.get('s', 'no_data') == 'ok':
            # Conver to Pandas DataFrame
            df = pd.DataFrame(res)
            # c(Close), h(High), l(Low), o(Open), s(Status), t(Time_Stamp), v(Volume)
            df['symbol'] = symbol2   # add column name and set 'BTCUSDT', 'ETHUSDT', 'LTCUSDT'
            df['date'] = df['t'].apply(lambda x: datetime.datetime.fromtimestamp(x))  # add column name and set date
            csv_file = f'data/csv/article021/crypto({symbol2}).csv'     # 'BTCUSDT', 'ETHUSDT', 'LTCUSDT'
            df.to_csv(csv_file, mode='a', header=False, index=False)    # append mode, no header
        time.sleep(2)   # sleep 1.5 sec => 2.0 secs
 図15
図15はVisual Studio Code(VSC)の画面です。関数(get_crypto_candles)が定義されています。
図15
図15はVisual Studio Code(VSC)の画面です。関数(get_crypto_candles)が定義されています。
-
Pythonのwhileループで永久ループさせる
cnt = 0
print('Startd While loop...')
while True:
    print(cnt)
    symbols = ['BINANCE:BTCUSDT']
    #symbols = ['BINANCE:BTCUSDT','BINANCE:ETHUSDT','BINANCE:LTCUSDT']
    for symbol in symbols:
        get_crypto_candles(symbol)

    cnt += 1

print('Ended While loop!')
 図16
図16はVisual Studio Code(VSC)の画面です。Pythonのwhileループから関数「 get_crypto_candles(symbol) 」を呼び出しています。
図16
図16はVisual Studio Code(VSC)の画面です。Pythonのwhileループから関数「 get_crypto_candles(symbol) 」を呼び出しています。
-
プログラムをコマンドプロンプトから実行させる
Windowsのコマンドプロンプトからプログラムを実行します。
コマンドプロンプトのウィンドウが表示されたら「cd」コマンドでプログラムが格納されているディレクトリに移動します。
ここでは「C:\xps8700\PythonProject」に移動しています。
次にPythonの引数に「Article021_gen4_crypto.py」を指定してプログラムを起動させます。
cd C:\xps8700\PythonProject
python Article021_gen4_crypto.py
 図17-1
図17-1はWindowsのコマンドプロンプトからプログラムを起動させた画面です。
画面にループカウントが表示されています。
図17-1
図17-1はWindowsのコマンドプロンプトからプログラムを起動させた画面です。
画面にループカウントが表示されています。
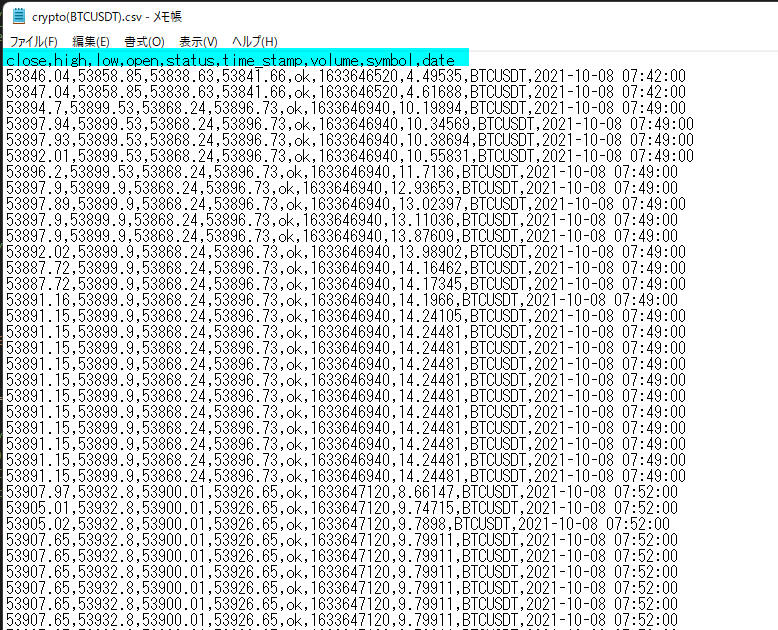 図17-2
図17-2はAPI経由で取得したBINANCEのBitcoinの価格をCSVファイルに保存した内容です。
このファイルにはローソク足チャートに必要が情報がすべて格納されています。
図17-2
図17-2はAPI経由で取得したBINANCEのBitcoinの価格をCSVファイルに保存した内容です。
このファイルにはローソク足チャートに必要が情報がすべて格納されています。
-
ここで解説したコードをまとめて掲載
最後にここで解説したすべてのコードをまとめて掲載しましたので参考にしてください。
# Article021_gen4_crypto.py
# Finnhub Stock API: https://finnhub.io/
# Tip: https://finnhub.io/pricing   Free: 60 API calls / munute (1sec)
# Run from Win11 command prompt
# cd C:\xps8700\PythonProject
# python Article021_gen4_crypto.py

# 0) Import the necessary libraries
import os
import time
import datetime
import calendar
import pandas as pd
import finnhub  # pip install finnhub-python==2.4.5
import warnings
warnings.simplefilter('ignore')

# 1) GET an API-key
api_key = os.environ.get('FINNHUB_API_KEY')

# 2) Setup client
finnhub_client = finnhub.Client(api_key=api_key)

#finnhub_client = finnhub.Client(api_key=api_key)
#print(finnhub_client.crypto_exchanges())
#print(finnhub_client.crypto_symbols('BINANCE'))
# df = pd.DataFrame(finnhub_client.crypto_symbols('BINANCE'))
# filter_by = (df['symbol'] == 'BINANCE:BTCUSDT')
# filter_by = (df['symbol'] == 'BINANCE:ETHUSDT')
# filter_by = (df['symbol'] == 'BINANCE:LTCUSDT')
# dfx = df[filter_by]
# print(dfx.head())

# 3) Get Crypto Candles

def get_crypto_candles(symbol):     # 'BINANCE:BTCUSDT'
    resolution = '1'    # 1, 5, 15, 30, 60, D, W, M
    secs = 60
    cur_datetime = datetime.datetime.utcnow() - datetime.timedelta(seconds=secs)
    cur_timetuple = cur_datetime.utctimetuple()
    cur_timestamp = calendar.timegm(cur_timetuple)
    ts_from = cur_timestamp     # UNIX timestamp. Interval initial value

    cur_datetime = datetime.datetime.utcnow()
    cur_timetuple = cur_datetime.utctimetuple()
    cur_timestamp = calendar.timegm(cur_timetuple)
    ts_to = cur_timestamp       # UNIX timestamp. Interval initial value

    symbol1, symbol2 = symbol.split(':')   # BINANCE:BTCUSDT, BINANCE:ETHUSDT, BINANCE:LTCUSDT

    try:
        # Crypto candles
        res = finnhub_client.crypto_candles(symbol, resolution, ts_from, ts_to)
    except Exception as e:
        print(f'crypto_candles({symbol},{resolution}) exception error: ', e)
    else:
        if res.get('s', 'no_data') == 'ok':
            # Conver to Pandas DataFrame
            df = pd.DataFrame(res)
            # c(Close), h(High), l(Low), o(Open), s(Status), t(Time_Stamp), v(Volume)
            df['symbol'] = symbol2   # add column name and set 'BTCUSDT', 'ETHUSDT', 'LTCUSDT'
            df['date'] = df['t'].apply(lambda x: datetime.datetime.fromtimestamp(x))  # add column name and set date
            csv_file = f'data/csv/article021/crypto({symbol2}).csv'     # 'BTCUSDT', 'ETHUSDT', 'LTCUSDT'
            df.to_csv(csv_file, mode='a', header=False, index=False)    # append mode, no header
        time.sleep(2)   # sleep 1.5 sec => 2.0 secs

cnt = 0
print('Startd While loop...')
while True:
    print(cnt)
    symbols = ['BINANCE:BTCUSDT']
    #symbols = ['BINANCE:BTCUSDT','BINANCE:ETHUSDT','BINANCE:LTCUSDT']
    for symbol in symbols:
        get_crypto_candles(symbol)

    cnt += 1
    # if cnt > 10:
    #     break

print('Ended While loop!')
-
Pythonのライブラリを取り込む
# Article021_Matplotlib Plotting Live Data in Real-Time Part4 Crypto.py
# Tip: https://finnhub.io/pricing   Free: 60 API calls / minute (1sec)

# Import the necessary libraries
import pandas as pd
import matplotlib.pyplot as plt
import matplotlib.dates as mpl_dates
import matplotlib.style as style
from matplotlib.animation import FuncAnimation
import datetime as dt
from datetime import datetime, timedelta
import numpy as np
import warnings
warnings.simplefilter('ignore')

# Set the font to support Japanese
plt.rcParams['font.family'] = 'Meiryo'
plt.style.use('fivethirtyeight')
plt.figure(figsize=(15, 5)) # default width=6.4, hight=4.8
 図18
図18はVisual Studio Code(VSC)の画面です。ここではPythonのライブラリを取り込んでいます。
図18
図18はVisual Studio Code(VSC)の画面です。ここではPythonのライブラリを取り込んでいます。
-
Matplotlibのplot()メソッドで線グラフを作成する関数(plot_crypto)を作成する
def plot_crypto(symbol):   # 'BINANCE:BTCUSDT'
    symbol1, symbol2 = symbol.split(':')    # 'BINANCE', 'BTCUSDT'
    csv_file = f'data/csv/article021/crypto({symbol2}).csv'

    df = pd.read_csv(csv_file)
    # close, high, low, open, status, time_stamp, volume, symbol, date
    df['date'] = pd.to_datetime(df['date'], format='%Y-%m-%d %H:%M:%S')

    df = df.sort_values(['date','close'], ascending=[True, False])
    dfx = df.groupby('date').first().reset_index()
    plt.plot(dfx.date, dfx.close, label=symbol2)
 図19
図19はVisual Studio Code(VSC)の画面です。関数「plot_crypto(symbol)」が定義されています。
図19
図19はVisual Studio Code(VSC)の画面です。関数「plot_crypto(symbol)」が定義されています。
-
MatplotlibのFuncAnimation()メソッドから呼び出す関数(animate)を作成する
def animate(i):
    plt.cla()

    symbols = ['BINANCE:BTCUSDT']
    #symbols = ['BINANCE:BTCUSDT','BINANCE:ETHUSDT','BINANCE:LTCUSDT']

    for symbol in symbols:
        plot_crypto(symbol)

    plt.gcf().autofmt_xdate()
    date_format = mpl_dates.DateFormatter('%H:%M')
    plt.gca().xaxis.set_major_formatter(date_format)
    plt.legend(loc='upper left')
    today = datetime.today().strftime('%Y/%m/%d %H:%M:%S')
    plt.title(f'BINANCE CRYPTO (BTC:USDT)\n({today})')
    plt.xlabel('(time stamp)')
    plt.ylabel('Closing Price (USD)')
    plt.legend(loc='upper left')
    plt.tight_layout()

ani = FuncAnimation(plt.gcf(), animate, interval=1000)

plt.show()
 図20
図20はVisual Studio Code(VSC)の画面です。関数「animate()」が定義されています。
図20
図20はVisual Studio Code(VSC)の画面です。関数「animate()」が定義されています。
-
プログラムを実行する
Visual Studio Code(VSC)から[Ctrl + Enter]で実行します。
 図21
図21はBinanceのBitcoinの価格がアニメーション化させて表示されている画面です。
グラフのタイトルに日時が表示されています。この日時はデジタル時計のように1秒間隔で変わります。
グラフのX軸には「分」と「秒」が「mm:ss」の形式で表示されます。
図21
図21はBinanceのBitcoinの価格がアニメーション化させて表示されている画面です。
グラフのタイトルに日時が表示されています。この日時はデジタル時計のように1秒間隔で変わります。
グラフのX軸には「分」と「秒」が「mm:ss」の形式で表示されます。
-
ここで解説したコードをまとめて掲載
最後にここで解説したすべてのコードをまとめて掲載しましたので参考にしてください。
# Article021_Matplotlib Plotting Live Data in Real-Time Part4 Crypto.py
# Tip: https://finnhub.io/pricing   Free: 60 API calls / minute (1sec)

# Import the necessary libraries
import pandas as pd
import matplotlib.pyplot as plt
import matplotlib.dates as mpl_dates
import matplotlib.style as style
from matplotlib.animation import FuncAnimation
import datetime as dt
from datetime import datetime, timedelta
import numpy as np
import warnings
warnings.simplefilter('ignore')

# Set the font to support Japanese
plt.rcParams['font.family'] = 'Meiryo'
plt.style.use('fivethirtyeight')
plt.figure(figsize=(15, 5)) # default width=6.4, hight=4.8

# 1) Read the csv file and  draw an animation line chart

def plot_crypto(symbol):                    # 'BINANCE:BTCUSDT'
    symbol1, symbol2 = symbol.split(':')    # 'BINANCE', 'BTCUSDT'
    csv_file = f'data/csv/article021/crypto({symbol2}).csv'

    df = pd.read_csv(csv_file)
    # close, high, low, open, status, time_stamp, volume, symbol, date
    df['date'] = pd.to_datetime(df['date'], format='%Y-%m-%d %H:%M:%S')

    df = df.sort_values(['date','close'], ascending=[True, False])
    dfx = df.groupby('date').first().reset_index()
    #dfx = dfx.tail(50)
    #dfx = dfx.tail(100)
    plt.plot(dfx.date, dfx.close, label=symbol2)

def animate(i):
    plt.cla()

    symbols = ['BINANCE:BTCUSDT']
    #symbols = ['BINANCE:BTCUSDT','BINANCE:ETHUSDT','BINANCE:LTCUSDT']

    for symbol in symbols:
        plot_crypto(symbol)

    plt.gcf().autofmt_xdate()
    #date_format = mpl_dates.DateFormatter('%Y/%m/%d %H:%M:%S')
    #date_format = mpl_dates.DateFormatter('%Y/%m/%d %H:%M')
    #date_format = mpl_dates.DateFormatter('%H:%M:%S')
    date_format = mpl_dates.DateFormatter('%H:%M')
    plt.gca().xaxis.set_major_formatter(date_format)

    #plt.yscale('log')
    plt.legend(loc='upper left')
    today = datetime.today().strftime('%Y/%m/%d %H:%M:%S')
    plt.title(f'BINANCE CRYPTO (BTC:USDT)\n({today})')
    plt.xlabel('(time stamp)')
    plt.ylabel('Closing Price (USD)')
    plt.legend(loc='upper left')
    plt.tight_layout()

ani = FuncAnimation(plt.gcf(), animate, interval=1000)

plt.show()
-
GAFAの株価をリアルタイムで取得してCSVファイルに保存するプログラムを作成する
# Article021_gen3_stock.py
# Finnhub Stock API: https://finnhub.io/
# Tip: https://finnhub.io/pricing   Free: 60 API calls / munute (1sec)
# Run from Win10 commnad prompt
# cd C:\xps8700\PythonProject
# python Article021_gen3_stock.py

# 0) Import the necessary libraries
import os
import time
import datetime
import calendar
import pandas as pd
import finnhub  # pip install finnhub-python==2.4.5
import warnings
warnings.simplefilter('ignore')

# 1) GET an API-key
api_key = os.environ.get('FINNHUB_API_KEY')

# 2) Setup client
finnhub_client = finnhub.Client(api_key=api_key)
 図22
図22はVisual Studio Code(VSC)の画面です。
図22
図22はVisual Studio Code(VSC)の画面です。
-
GAFAの株価を取得する関数(get_stock_candles)を作成する
行17のstock_candles()メソッドの詳しい使い方についてはドキュメントを参照してください。
ここではstock_candles()の引数1にAmazonのシンボル「AMZN」を指定しています。
引数2のresolutionには「D」を指定しています。
引数3,4には取得する株価の開始・終了時刻をUNIXのタイムスタンプ形式で指定します。
ここでは開始時刻に「現在の時刻-60秒」、終了時刻に「現在の時刻」を指定しています。
stock_candles()からは以下のような株価情報が返ります。
株価のローソク足チャートを作成するためのすべての情報が含まれています。
{
    'c': [3252.29],
    'h': [3292.5898],
    'l': [3238.1001],
    'o': [3275],
    's': 'ok',
    't': [1633976571],
    'v': [1341571]
}
stock_candles()メソッドを実行したら、戻り値の「s:status]の値が「ok」であることを確認する必要があります。
# 3) Get Stock Candles
def get_stock_candles(symbol):  # 'GOOGL','AMZN','FB','AAPL','MSFT'
    resolution = 'D'            # 1, 5, 15, 30, 60, D, W, M
    secs = 60
    cur_datetime = datetime.datetime.utcnow() - datetime.timedelta(seconds=secs)
    cur_timetuple = cur_datetime.utctimetuple()
    cur_timestamp = calendar.timegm(cur_timetuple)
    ts_from = cur_timestamp     # UNIX timestamp. Interval initial value

    cur_datetime = datetime.datetime.utcnow()
    cur_timetuple = cur_datetime.utctimetuple()
    cur_timestamp = calendar.timegm(cur_timetuple)
    ts_to = cur_timestamp       # UNIX timestamp. Interval initial value

    try:
        # Stock candles
        res = finnhub_client.stock_candles(symbol, resolution, ts_from, ts_to)
    except Exception as e:
         print(f'stock_candles({symbol},{resolution}) exception error: ', e)
    else:
        if res.get('s', 'no_data') == 'ok':
            # Conver to Pandas DataFrame
            df = pd.DataFrame(res)
            # c(Close), h(High), l(Low), o(Open), s(Status), t(Time_Stamp), v(Volume)

            df['symbol'] = symbol   # add column name and set 'GOOGL','AMZN','FB','AAPL','MSFT'
            df['date'] = df['t'].apply(lambda x: datetime.datetime.fromtimestamp(x))  # add column name and set date

            csv_file = f'data/csv/article021/stock({symbol}).csv'     # 'GOOGL','AMZN','FB','AAPL','MSFT'
            df.to_csv(csv_file, mode='a', header=False, index=False)  # append mode, no header
        time.sleep(2)   # sleep 1.5 sec => 2.0 secs
 図23
図23はVisual Studio Code(VSC)の画面です。
図23
図23はVisual Studio Code(VSC)の画面です。
-
Pythonのwhileループで永久ループさせる
cnt = 0
print('Startd While loop...')
while True:
    print(cnt)
    symbols = ['AMZN']
    #symbols = ['GOOGL','AMZN','FB','AAPL','MSFT']
    for symbol in symbols:
        #print(symbol)
        get_stock_candles(symbol)
    cnt += 1
print('Ended While loop!')
 図24
図24はVisual Studio Code(VSC)の画面です。
図24
図24はVisual Studio Code(VSC)の画面です。
-
プログラムをコマンドプロンプトから実行させる
cd C:\xps8700\PythonProject
python Article021_gen3_stock.py
 図25-1
図25-1ではWindowsのコマンドプロンプトから「cd」コマンドを入力してカレントのフォルダをPythonのプログラムが存在する場所に移動しています。
そして、Pythonの引数にプログラム「Article021_gen3_stock.py」を指定して起動させています。
図25-1
図25-1ではWindowsのコマンドプロンプトから「cd」コマンドを入力してカレントのフォルダをPythonのプログラムが存在する場所に移動しています。
そして、Pythonの引数にプログラム「Article021_gen3_stock.py」を指定して起動させています。
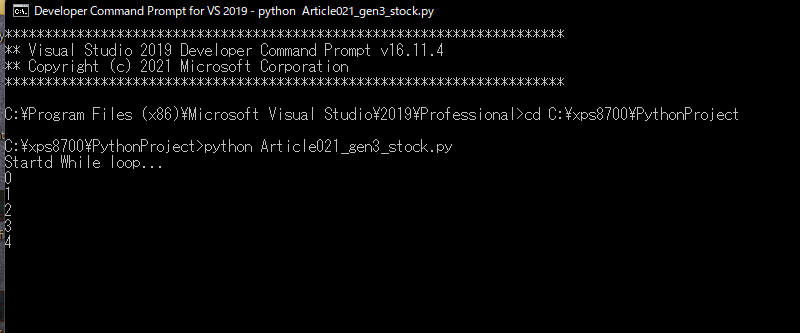 図25-2
図25-2はプログラムが実行している画面です。画面にループカウントが表示されています。
図25-2
図25-2はプログラムが実行している画面です。画面にループカウントが表示されています。
-
ここで解説したコードをまとめて掲載
最後にここで解説したすべてのコードをまとめて掲載しましたので参考にしてください。
# Article021_gen3_stock.py
# Finnhub Stock API: https://finnhub.io/
# Tip: https://finnhub.io/pricing   Free: 60 API calls / munute (1sec)
# Run from Win10 commnad prompt
# cd C:\xps8700\PythonProject
# python Article021_gen3_stock.py

# 0) Import the necessary libraries
import os
import time
import datetime
import calendar
import pandas as pd
import finnhub  # pip install finnhub-python==2.4.5
import warnings
warnings.simplefilter('ignore')

# 1) GET an API-key
api_key = os.environ.get('FINNHUB_API_KEY')

# 2) Setup client
finnhub_client = finnhub.Client(api_key=api_key)

# 3) Get Stock Candles
def get_stock_candles(symbol):  # 'GOOGL','AMZN','FB','AAPL','MSFT'
    resolution = 'D'            # 1, 5, 15, 30, 60, D, W, M
    secs = 60
    cur_datetime = datetime.datetime.utcnow() - datetime.timedelta(seconds=secs)
    cur_timetuple = cur_datetime.utctimetuple()
    cur_timestamp = calendar.timegm(cur_timetuple)
    ts_from = cur_timestamp     # UNIX timestamp. Interval initial value

    cur_datetime = datetime.datetime.utcnow()
    cur_timetuple = cur_datetime.utctimetuple()
    cur_timestamp = calendar.timegm(cur_timetuple)
    ts_to = cur_timestamp       # UNIX timestamp. Interval initial value

    # ------------------------------------ 'GOOGL','AMZN','FB','AAPL','MSFT'
    try:
        # Stock candles
        res = finnhub_client.stock_candles(symbol, resolution, ts_from, ts_to)
    except Exception as e:
         print(f'stock_candles({symbol},{resolution}) exception error: ', e)
    else:
        #print(res)
        if res.get('s', 'no_data') == 'ok':
            # Conver to Pandas DataFrame
            df = pd.DataFrame(res)
            # c(Close), h(High), l(Low), o(Open), s(Status), t(Time_Stamp), v(Volume)

            df['symbol'] = symbol   # add column name and set 'GOOGL','AMZN','FB','AAPL','MSFT'
            df['date'] = df['t'].apply(lambda x: datetime.datetime.fromtimestamp(x))  # add column name and set date

            csv_file = f'data/csv/article021/stock({symbol}).csv'     # 'GOOGL','AMZN','FB','AAPL','MSFT'
            df.to_csv(csv_file, mode='a', header=False, index=False)  # append mode, no header
        time.sleep(2)   # sleep 1.5 sec => 2.0 secs

cnt = 0
print('Startd While loop...')
while True:
    print(cnt)
    symbols = ['AMZN']
    #symbols = ['GOOGL','AMZN','FB','AAPL','MSFT']
    for symbol in symbols:
        #print(symbol)
        get_stock_candles(symbol)
    cnt += 1
    # if cnt > 5:
    #     break
print('Ended While loop!')
-
Pythonのライブラリを取り込む
# Article021_Matplotlib Plotting Live Data in Real-Time Part3 Stock.py
# Tip: https://finnhub.io/pricing   Free: 60 API calls / minute (1sec)
# Import the necessary libraries
import pandas as pd
import matplotlib.pyplot as plt
import matplotlib.dates as mpl_dates
import matplotlib.style as style
from matplotlib.animation import FuncAnimation
import datetime as dt
from datetime import datetime, timedelta
import numpy as np
import warnings
warnings.simplefilter('ignore')
 図26
図26はVisual Studio Code(VSC)の画面です。
図26
図26はVisual Studio Code(VSC)の画面です。
-
Matplotlibのplot()メソッドで線グラフを作成する関数(plot_stock)を作成する
# 1) Read the csv file and draw an animation line chart

# Set the font to support Japanese
plt.rcParams['font.family'] = 'Meiryo'
plt.style.use('fivethirtyeight')
plt.figure(figsize=(15, 5))

def plot_stock(symbol):
    csv_file = f'data/csv/article021/stock({symbol}).csv'
    df = pd.read_csv(csv_file)
    # close, high, low, open, status, time_stamp, volume, symbol, date
    df['date'] = pd.to_datetime(df['date'], format='%Y-%m-%d %H:%M:%S')

    df = df.sort_values(['date','close'], ascending=[True, False])
    dfx = df.groupby('date').first().reset_index()

    label = symbols_mapping[symbol]
    plt.plot(dfx.date, dfx.close, label=label)
 図27
図27はVisual Studio Code(VSC)の画面です。
図27
図27はVisual Studio Code(VSC)の画面です。
-
MatplotlibのFuncAnimation()メソッドから呼び出す関数(animate)を作成する
symbols = ['AMZN']
#symbols = ['GOOGL','AMZN','FB','AAPL','MSFT']

symbols_mapping = {
    'GOOGL': 'Google',
    'AMZN': 'Amazon',
    'FB': 'Facebook',
    'AAPL': 'Apple'
}

def animate(i):
    plt.cla()

    for symbol in symbols:
        plot_stock(symbol)

    plt.gcf().autofmt_xdate()
    date_format = mpl_dates.DateFormatter('%H:%M')
    plt.gca().xaxis.set_major_formatter(date_format)

    plt.legend(loc='upper left')
    today = datetime.today().strftime('%Y/%m/%d %H:%M:%S')
    plt.title(f'GAFA Stock Prices\n({today})')
    plt.xlabel('(time stamp)')
    plt.ylabel('Closing Price (USD)')
    plt.legend(loc='upper left')
    plt.tight_layout()

ani = FuncAnimation(plt.gcf(), animate, interval=1000)

plt.show()
 図28
図28はVisual Studio Code(VSC)の画面です。
図28
図28はVisual Studio Code(VSC)の画面です。
-
プログラムを実行する
Visual Studio Code(VSC)から[Ctrl + Enter]で実行します。
 図29
図29はプログラムが実行されてAmazonの株価がリアルタイムで表示されている画面です。
グラフのタイトルに日時が1秒間隔でデジタル時計のように表示されます。
X軸には分+秒が「mm:ss」の形式で表示されます。
図29
図29はプログラムが実行されてAmazonの株価がリアルタイムで表示されている画面です。
グラフのタイトルに日時が1秒間隔でデジタル時計のように表示されます。
X軸には分+秒が「mm:ss」の形式で表示されます。
-
ここで解説したコードをまとめて掲載
最後にここで解説したすべてのコードをまとめて掲載しましたので参考にしてください。
# Article021_Matplotlib Plotting Live Data in Real-Time Part3 Stock.py
# Tip: https://finnhub.io/pricing   Free: 60 API calls / minute (1sec)
# Import the necessary libraries
import pandas as pd
import matplotlib.pyplot as plt
import matplotlib.dates as mpl_dates
import matplotlib.style as style
from matplotlib.animation import FuncAnimation
import datetime as dt
from datetime import datetime, timedelta
import numpy as np
import warnings
warnings.simplefilter('ignore')

# 1) Read the csv file and  draw an animation line chart

# Set the font to support Japanese
plt.rcParams['font.family'] = 'Meiryo'
plt.style.use('fivethirtyeight')
plt.figure(figsize=(15, 5)) # 6, 5 => default width=6.4, hight=4.8

def plot_stock(symbol):                     # AMZN
    csv_file = f'data/csv/article021/stock({symbol}).csv'
    df = pd.read_csv(csv_file)
    # close, high, low, open, status, time_stamp, volume, symbol, date
    df['date'] = pd.to_datetime(df['date'], format='%Y-%m-%d %H:%M:%S')

    df = df.sort_values(['date','close'], ascending=[True, False])
    dfx = df.groupby('date').first().reset_index()
    #dfx = dfx.tail(50)
    #dfx = dfx.tail(100)
    label = symbols_mapping[symbol]
    plt.plot(dfx.date, dfx.close, label=label)

symbols = ['AMZN']
#symbols = ['GOOGL','AMZN','FB','AAPL','MSFT']

symbols_mapping = {
    'GOOGL': 'Google',
    'AMZN': 'Amazon',
    'FB': 'Facebook',
    'AAPL': 'Apple'
}

def animate(i):
    plt.cla()

    for symbol in symbols:
        plot_stock(symbol)

    plt.gcf().autofmt_xdate()
    date_format = mpl_dates.DateFormatter('%H:%M')
    plt.gca().xaxis.set_major_formatter(date_format)

    plt.legend(loc='upper left')
    today = datetime.today().strftime('%Y/%m/%d %H:%M:%S')
    plt.title(f'GAFA Stock Prices\n({today})')
    plt.xlabel('(time stamp)')
    plt.ylabel('Closing Price (USD)')
    plt.legend(loc='upper left')
    plt.tight_layout()

ani = FuncAnimation(plt.gcf(), animate, interval=1000)

plt.show()