-
tweeplyのClass「twitter_libraries.py」を作成する
行1-12ではPythonのライブラリを取り込んでいます。
行12の「twitter_credentials」にはTwitter APIの認証情報が格納されています。
import time
import json
import re
import pandas as pd
#import matplotlib.pyplot as plt
import numpy as np
#import winsound
from textblob import TextBlob       # pip install textblob
from googletrans import Translator  # pip install googletrans==4.0.0-rc1
#from asari.api import Sonar        # pip install asari => Not Working!
import tweepy
import twitter_credentials
import warnings

# # # # TWITTER CLIENT # # # #
class TwitterClient():
    def __init__(self, twitter_user=None):
        self.auth = TwitterAuthenticator().authenticate_twitter_app()
        self.twitter_client = tweepy.API(self.auth)
        self.twitter_user = twitter_user

    def get_twitter_client_api(self):
        return self.twitter_client

    def get_user_timeline_tweets(self, num_tweets):
        tweets = []
        for tweet in tweepy.Cursor(self.twitter_client.user_timeline, user_id=self.twitter_user).items(num_tweets):
            tweets.append(tweet)
        return tweets

    def get_friend_list(self, num_friends):
        friend_list = []
        for friend in tweepy.Cursor(self.twitter_client.friends, user_id=self.twitter_user).items(num_friends):
            friend_list.append(friend)
        return friend_list

    def get_home_timeline_tweets(self, num_tweets):
        home_timeline_tweets = []
        for tweet in tweepy.Cursor(self.twitter_client.home_timeline, user_id=self.twitter_user).items(num_tweets):
            home_timeline_tweets.append(tweet)
        return home_timeline_tweets


# # # # TWITTER AUTHENTICATER # # # #
class TwitterAuthenticator():

    def authenticate_twitter_app(self):
        auth = tweepy.OAuthHandler(twitter_credentials.CONSUMER_KEY, twitter_credentials.CONSUMER_SECRET)
        auth.set_access_token(twitter_credentials.ACCESS_TOKEN, twitter_credentials.ACCESS_TOKEN_SECRET)
        return auth

# # # # TWITTER STREAMER # # # #
class TwitterStreamer():
    """
    Class for streaming and processing live tweets.
    """
    def __init__(self):
        pass

    def stream_tweets(self, keyword_list, limit_count, file_name):
        stream = TweetListener(
            twitter_credentials.CONSUMER_KEY, twitter_credentials.CONSUMER_SECRET,
            twitter_credentials.ACCESS_TOKEN, twitter_credentials.ACCESS_TOKEN_SECRET,
            limit_count=limit_count, file_name=file_name
        )

        stream.set_stream(stream)

        # This line filter Twitter Streams to capture data by the keywords:
        stream.filter(track=keyword_list)
        #stream.filter(languages=['en'], track=keyword_list)

# # # # TWITTER STREAM LISTENER # # # #
class TweetListener(tweepy.Stream):
    def __init__(self, cons_key, cons_secret, token, token_sec, limit_count=99, file_name='filename.txt'):
        self.stream = 0
        self.count = 0
        self.limit_count = limit_count
        self.file_name = file_name
        self.txtFile = open(file_name, 'w')
        super().__init__(cons_key, cons_secret, token, token_sec)

    def set_stream(self, stream):
        self.stream = stream

    def on_data(self, data):
        try:
            self.count += 1

            if self.count <= self.limit_count:
                print('count < limit_count: self.count =', str(self.count), 'self.limit_count =', str(self.limit_count))
                tweet = json.loads(data)
                tweet_id = 0
                tweet_len = 0
                tweet_date = ''
                tweet_text = ''
                tweet_source = ''
                tweet_likes = 0
                tweet_retweets = 0

                if 'id' in tweet:
                    tweet_id = tweet.get('id')  # 'id': 1463213898769784840

                if 'text' in tweet:
                    tweet_text = tweet.get('text')  # 'text': 'tweet message...'
                    tweet_len = len(tweet_text)

                    #print('tweet_text =', tweet_text)
                    # remove unicoe characters
                    tweet_text = tweet_text.encode('ascii', 'ignore')
                    tweet_text = tweet_text.decode()
                    # remove white space
                    tweet_text = tweet_text.strip()
                    tweet_text = tweet_text.replace('\n',':N:')

                if 'created_at' in tweet:
                    tweet_date = tweet.get('created_at')    # 'created_at': 'Tue Nov 23 18:32:33 +0000 2021'

                if 'source' in tweet:
                    tweet_source = tweet.get('source').strip()  # 'source': '<a href="https://??????"....
                    #print('tweet_source =', tweet_source)

                if 'favorite_count' in tweet:
                    tweet_likes = tweet.get('favorite_count')   # 'favorite_count': 1

                if 'retweet_count' in tweet:
                    tweet_retweets = tweet.get('retweet_count') # 'retweet_count': 1

                # file layput
                clean_tweet = f'{self.count}:::{time.time()}:::{tweet_id}:::{tweet_len}:::{tweet_date}:::{tweet_text}:::{tweet_source}:::{tweet_likes}:::{tweet_retweets}'
                #print(clean_tweet)

                self.txtFile.write(clean_tweet)
                self.txtFile.write('\n')
                return True
            else:
                print('count >= limit_count: self.count =', str(self.count), 'self.limit_count =', str(self.limit_count))
                self.txtFile.close()
                self.stream.disconnect()
                return False

        except BaseException as e:
            print('BaseException Error on_data: %s' % str(e))
            return False

    def on_error(self, status):
        if status == 420:
            # Returning False on_data method in case rate limit occurs.
            return False
        print('on_error status:', status)
        return False

class TweetAnalyzer():
    """
    Functionality for analyzing and categorizing content from tweets.
    """

    def clean_tweet(self, tweet):
        return ' '.join(re.sub("(@[A-Za-z0-9]+)|([^0-9A-Za-z \t])|(\w+:\/\/\S+)", " ", tweet).split())

    def analyze_sentiment(self, tweet):
        tr = Translator()
        lang = tr.detect(tweet)
        if lang.lang == 'ja':
            trans = tr.translate(tweet, src='ja', dest='en')
            tweet = trans.text  # Japanese => English
        analysis = TextBlob(self.clean_tweet(tweet))

        if analysis.sentiment.polarity > 0:
            return 1
        elif analysis.sentiment.polarity == 0:
            return 0
        else:
            return -1


    def tweets_to_data_frame(self, tweets):
        df = pd.DataFrame(data=[tweet.text for tweet in tweets], columns=['tweets'])

        df['id'] = np.array([tweet.id for tweet in tweets])
        df['len'] = np.array([len(tweet.text) for tweet in tweets])
        df['date'] = np.array([tweet.created_at for tweet in tweets])
        df['source'] = np.array([tweet.source for tweet in tweets])
        df['likes'] = np.array([tweet.favorite_count for tweet in tweets])
        df['retweets'] = np.array([tweet.retweet_count for tweet in tweets])

        return df

    def txtfile_to_data_frame(self, txtfile):
        df = pd.read_csv(txtfile, sep=':::', header=None, error_bad_lines=False,
            encoding='ISO-8859–1', engine='python',
            names=['count','time','id','len','date','tweet','source','likes','retweets'])

        return df
-
TwitterStreamer()クラスのstream_tweets()メソッドを使用してツイートのトレンド分析を行う
行1-15ではPythonのライブラリを取り込んでいます。
行13-14では本記事で作成した「twitter_credentialspy」「twitter_libraries.py」を取り込んでいます。
行17ではPythonの警告を抑止しています。
行20では処理が終了したときにアラート音を鳴らすかどうかを設定しています。
ここでは「True」を設定しています。
行22-24ではツイートを絞り込むキーワードを定義しています。
行26-28ではツイートを保存するテキストファイルのパスを定義しています。
行30-31では直近のツイートからキーワードで絞り込んでツイートを取り込んでいます。
ここではstream_tweets()の引数1に「filter_list」を指定して
「'bitcoin', 'ethereum', 'litecoin', 'Cardano', 'SHIBA INU'」
のキーワードで絞り込んでいます。
引数limit_countには50を指定して50件のツイートを取り込みます。
ここで取り込んだツイートは引数file_nameに指定したテキストファイルに保存されます。
行41ではテキストファイルに保存されているツイートをPandasのDataFrameに取り込みます。
行42-43ではDataFrameから不要な列と値がNaNの行を削除しています。
行45-46ではキーワード毎のツイート件数をカウントして新規列に保存しています。
行49ではキーワード毎のツイート件数を表示しています。
import sys
import time
import json
import re
import pandas as pd
import matplotlib.pyplot as plt
import numpy as np
import winsound
from textblob import TextBlob       # pip install textblob
from googletrans import Translator  # pip install googletrans==4.0.0-rc1
#from asari.api import Sonar        # pip install asari => Not Working!
import tweepy
import twitter_credentials
from twitter_libraries import TwitterClient, TwitterAuthenticator, TwitterStreamer, TweetAnalyzer
import warnings

warnings.simplefilter('ignore')

### Trend Analysis
alert = True    # True of False

filter_list = ['bitcoin', 'ethereum', 'litecoin', 'Cardano','SHIBA INU']
#filter_list = ['python','numpy','pandas','matplotlib','streamlit','tweepy']
#filter_list = ['python','JavaScript','Java','C++','HTML','CSS']

txt_file = 'data/txt/tweets/crypto(50).txt'
#txt_file = 'data/txt/tweets/python(50).txt'
#txt_file = 'data/txt/tweets/programming_lang(50).txt'

twitter_streamer = TwitterStreamer()    # Create an instalce of TwitterStreamer()
twitter_streamer.stream_tweets(filter_list, limit_count=50, file_name=txt_file)

if alert:
    duration = 1000
    freq = 400  # Hz
    freqs = [196, 220]
    for _ in range(3):
        winsound.Beep(freq, duration)
        time.sleep(0.3)

df = TweetAnalyzer().txtfile_to_data_frame(txt_file)
df.drop(columns=['count','time','id','len','date','source','likes','retweets'], inplace=True)
df.dropna(axis=0, inplace=True)

for col_name  in filter_list:
    df[f'{col_name}'] = df['tweet'].apply(lambda x: x.count(f'{col_name}'))

print('-'*80)
print(df.iloc[:, 1:6].sum())
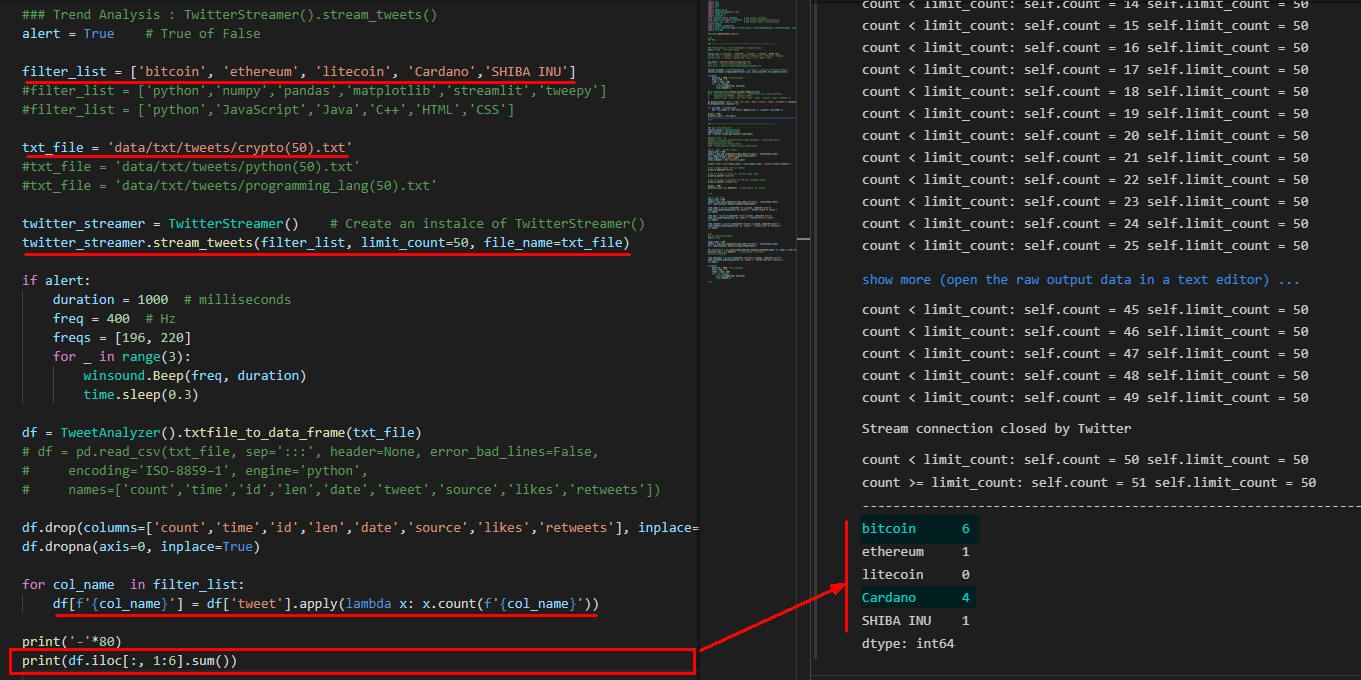 図3-1
図3-1は仮想通貨(暗号通貨)のトレンドを分析した結果です。
50件のツイートをキーワード「'bitcoin', 'ethereum', 'litecoin', 'Cardano', 'SHIBA INU'」で分析した結果Bitcoinが6件、Cardanoが4件となっています。
図3-1
図3-1は仮想通貨(暗号通貨)のトレンドを分析した結果です。
50件のツイートをキーワード「'bitcoin', 'ethereum', 'litecoin', 'Cardano', 'SHIBA INU'」で分析した結果Bitcoinが6件、Cardanoが4件となっています。
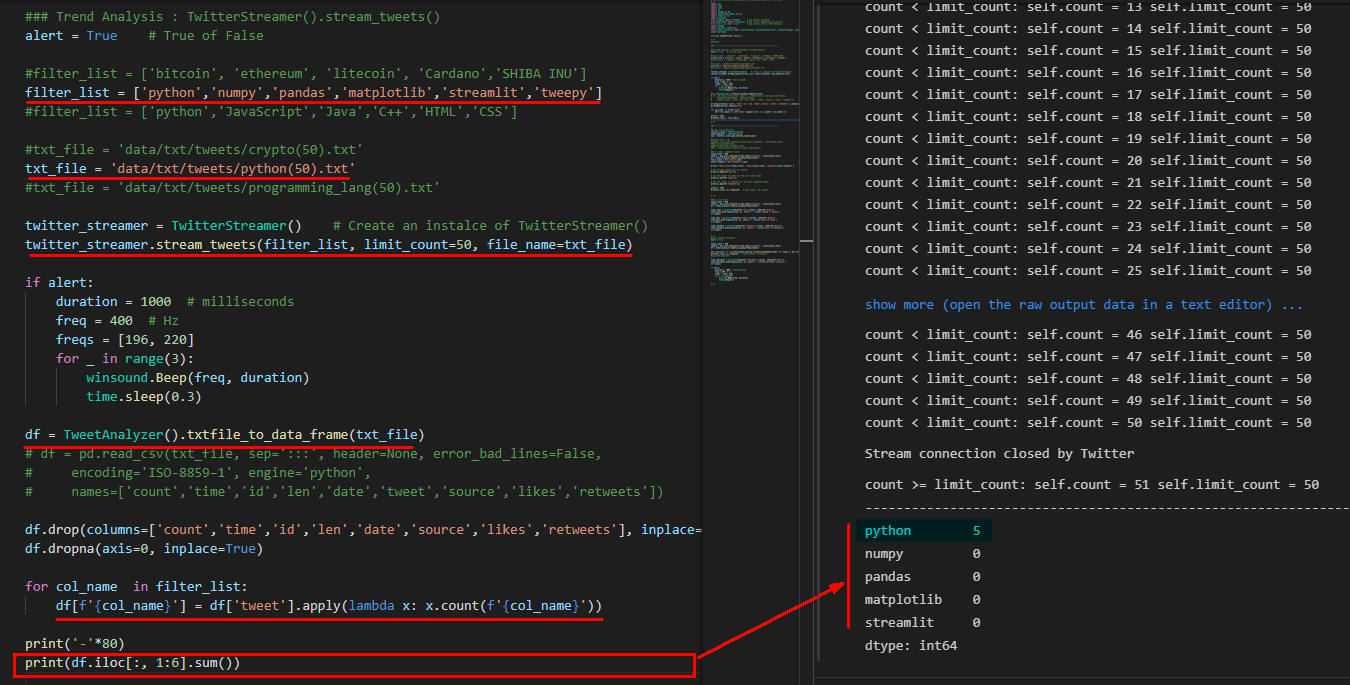 図3-2
図3-2はPythonのライブラリのトレンドを分析した結果です。
50件のツイートをキーワード「['python', 'numpy', 'pandas', 'matplotlib', 'streamlit', 'tweepy'」で分析した結果Pythonが5件、Pythonのライブラリは0件となっています。
図3-2
図3-2はPythonのライブラリのトレンドを分析した結果です。
50件のツイートをキーワード「['python', 'numpy', 'pandas', 'matplotlib', 'streamlit', 'tweepy'」で分析した結果Pythonが5件、Pythonのライブラリは0件となっています。
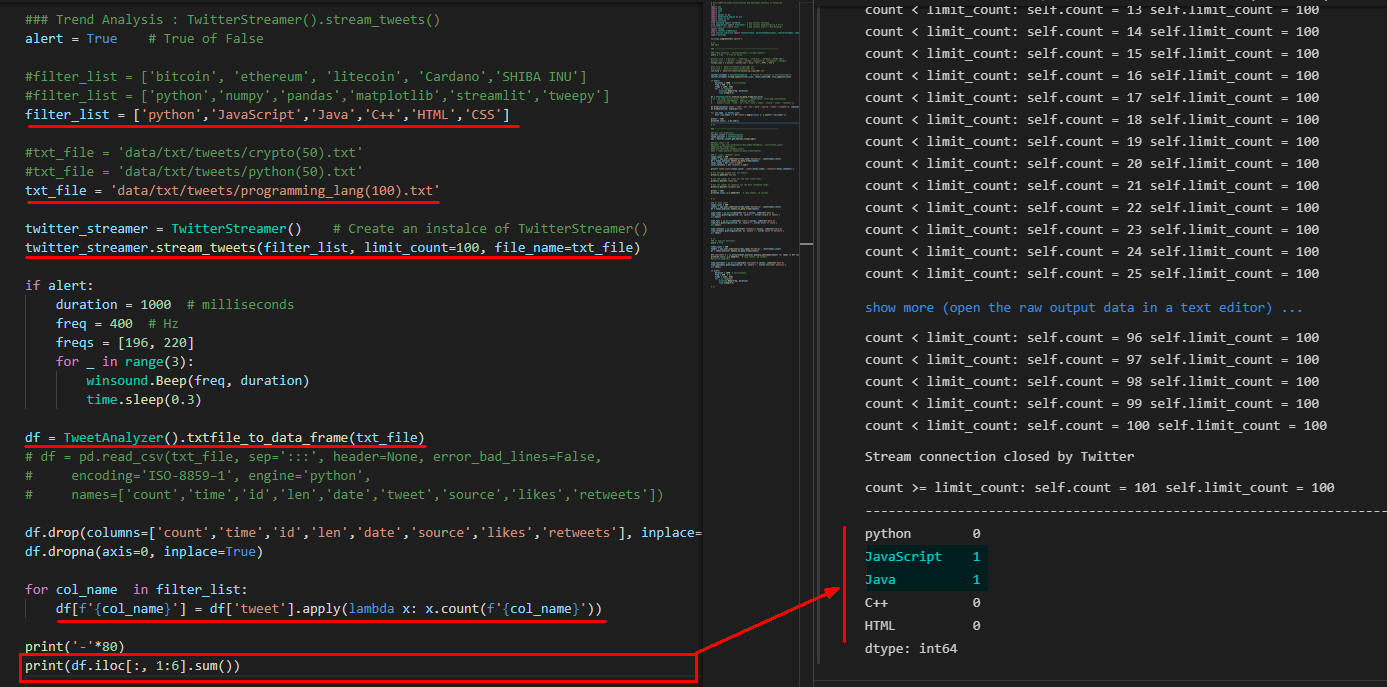 図3-3
図3-3はプログラミング言語のトレンドを分析した結果です。
50件のツイートをキーワード「'python', 'JavaScript', 'Java', 'C++', 'HTML', 'CSS'」で分析した結果JavaScriptが1件、Javaが1件となっています。
図3-3
図3-3はプログラミング言語のトレンドを分析した結果です。
50件のツイートをキーワード「'python', 'JavaScript', 'Java', 'C++', 'HTML', 'CSS'」で分析した結果JavaScriptが1件、Javaが1件となっています。
-
api.user_timeline()メソッドで特定のユーザーのツイートを取得して「likes(いいね)」「retweets(リツイート)」の件数を分析する
行2-4ではTweepyのAPIを使用するために初期化を行っています。
行7-8ではユーザーを指定して直近のツイートを200件(Max)取得しています。
user_timeline()の引数screen_nameには「ユーザー名」を指定します。
引数countには取得するツイートの「件数」を指定します。
行13では取得したツイートをPandasのDataFrameに取り込んでいます。
行14-17ではツイートの「いいね」と「リツイート」の合計件数を計算して表示しています。
行23, 27では「いいね」と「リツイート」のMaxの件数を取得して表示しています。
行32-40では「いいね」の件数が多い順に並べ替えてトップ5件のツイート(「いいね」の件数、ツイート)を表示しています。
### api.user_timeline()
twitter_client = TwitterClient()
tweet_analyzer = TweetAnalyzer()
api = twitter_client.get_twitter_client_api()

### 1) likes, retweets counts
tweet_count = 200
tweets = api.user_timeline(screen_name='AkioKasai', count=tweet_count)
#tweets = api.user_timeline(screen_name='elonmusk', count=tweet_count)
#tweets = api.user_timeline(screen_name='takapon_jp', count=tweet_count)
#tweets = api.user_timeline(screen_name='yousuck2020', count=tweet_count)
#tweets = api.user_timeline(screen_name='kenichiromogi', count=tweet_count)
df = tweet_analyzer.tweets_to_data_frame(tweets)
total_likes = df['likes'].sum()
total_retweets = df['retweets'].sum()

print(f'tweet count={tweet_count}, total likes={total_likes}, total retweets={total_retweets}')
print('-'*100)

# Get average length over all tweets:
#print('len(tweet) =',np.mean(df['len']))

# Get the number of likes for the most liked tweet:
print('max(likes) =',np.max(df['likes']))

# Get the number of retweets for the most retweeted tweet:
print('max(retweets) =',np.max(df['retweets']))

# print('-'*100)
# print(df.iloc[:,2:].head(10))   # skip tweets, id columns

dfx = df.sort_values(by='likes', ascending=False)
print('-'*100)
#dfx['tweets'] = dfx['tweets'].apply(lambda x: x.replace('\x20',''))

likes = dfx.loc[:,'likes'].values
tweets = dfx.loc[:,'tweets'].values
for i in range(5):
    print(f'{i+1}: likes={likes[0:6][i]}, tweet="{tweets[0:6][i]}"')
    print('~'*20)
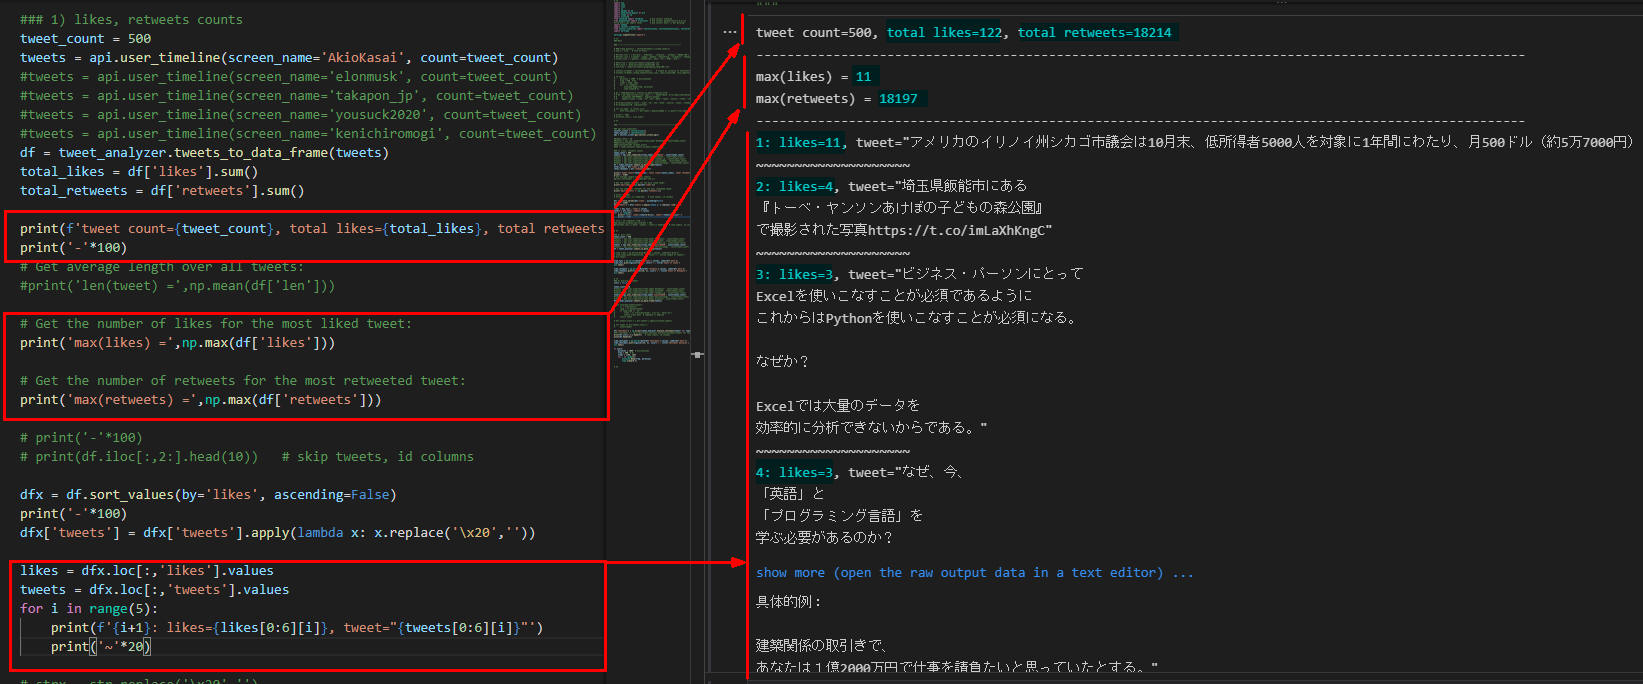 図4-1
図4-1は私(AkioKasai)の直近の200件(Max)のツイートを分析したものです。
500件中、likesが122件、retweetsが18214件となっています。
図4-1
図4-1は私(AkioKasai)の直近の200件(Max)のツイートを分析したものです。
500件中、likesが122件、retweetsが18214件となっています。
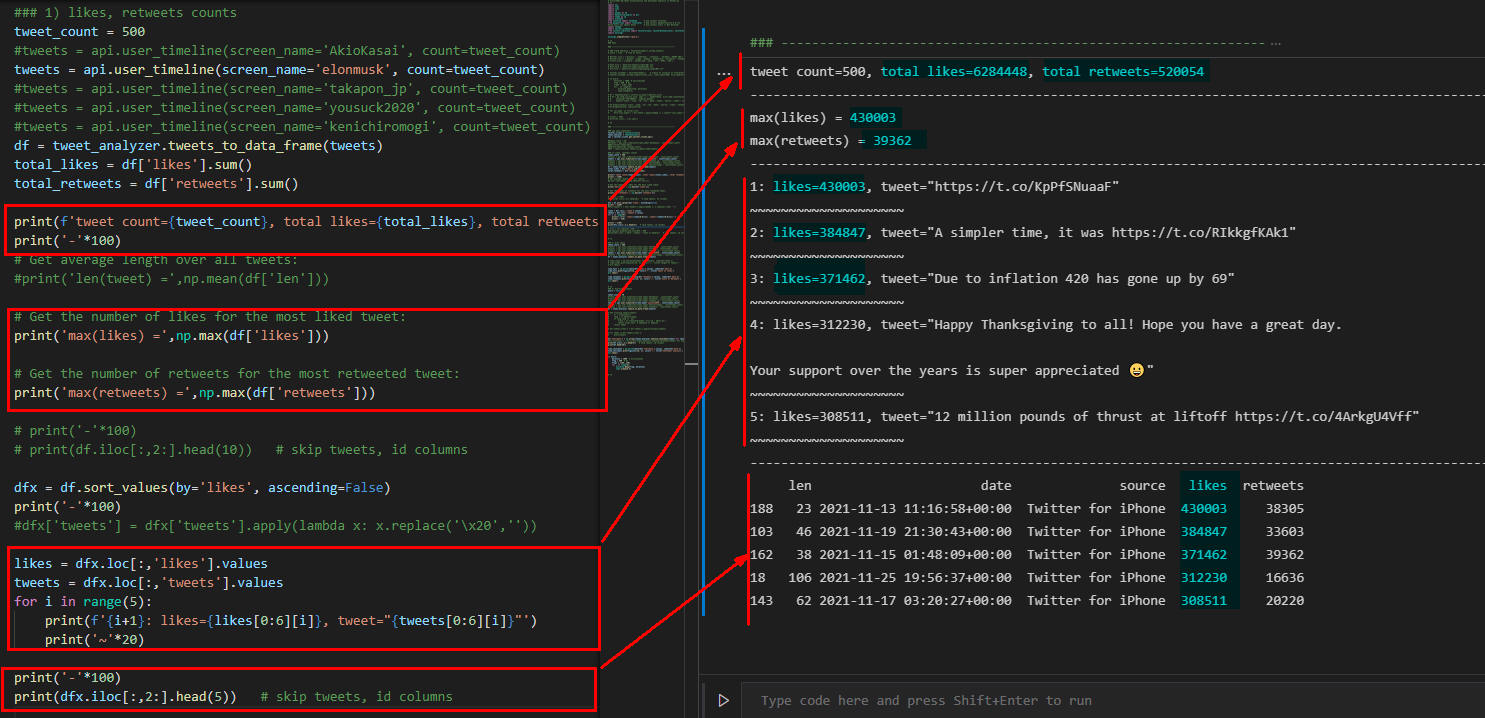 図4-2
図4-2はイーロン・マスク(elonmusk)の直近の500件のツイートを分析したものです。
500件中、likesの合計が6,284,448件、retweets合計が520,054件となっています。
likesのmaxは430,003件、retweetのmaxは39,362件です。
図4-2
図4-2はイーロン・マスク(elonmusk)の直近の500件のツイートを分析したものです。
500件中、likesの合計が6,284,448件、retweets合計が520,054件となっています。
likesのmaxは430,003件、retweetのmaxは39,362件です。
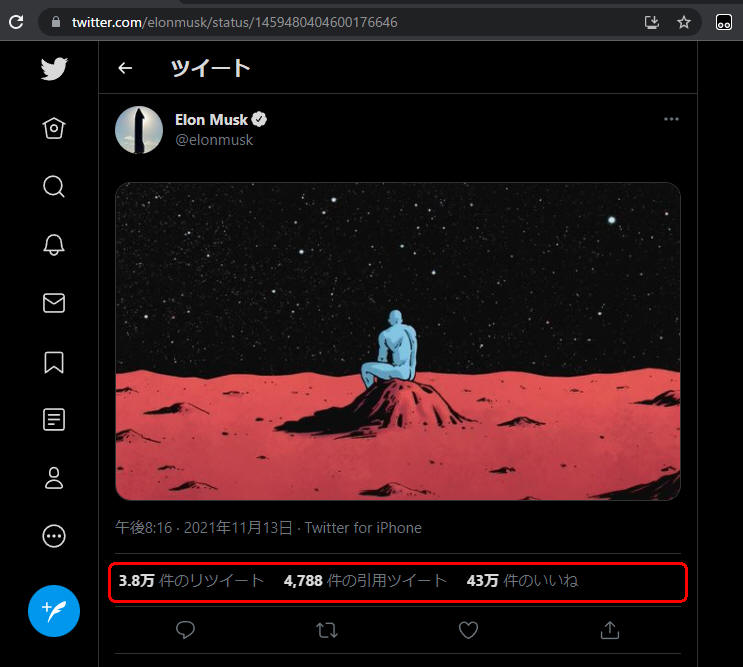 図4-3
図4-3はイーロン・マスクのLikesの件数が1位のツイートです。
火星の画像ですかね?
図4-3
図4-3はイーロン・マスクのLikesの件数が1位のツイートです。
火星の画像ですかね?
-
api.user_timeline()メソッドで特定のユーザーのツイートを取得して「len(tweet)」「likes」「retweets」のグラフを作成する
行10-12では直近のツイート500件の「ツイートの長さ」を計算して線グラフで表示しています。
行14-16では直近のツイート500件中の「いいね」の件数を線グラフで表示しています。
行18-20では直近のツイート500件中の「リツイート」の件数を線グラフで表示しています。
### 2) plot chart
tweet_count = 500
tweets = api.user_timeline(screen_name='AkioKasai', count=tweet_count)
#tweets = api.user_timeline(screen_name='elonmusk', count=tweet_count)
#tweets = api.user_timeline(screen_name='takapon_jp', count=tweet_count)
#tweets = api.user_timeline(screen_name='yousuck2020', count=tweet_count)
#tweets = api.user_timeline(screen_name='kenichiromogi', count=tweet_count)
df = tweet_analyzer.tweets_to_data_frame(tweets)

time_likes = pd.Series(data=df['len'].values, index=df['date'])
time_likes.plot(figsize=(16, 4), color='r', title='Length of Tweets')
plt.show()

time_favs = pd.Series(data=df['likes'].values, index=df['date'])
time_favs.plot(figsize=(16, 4), color='r', title='Count of Likes')
plt.show()

time_retweets = pd.Series(data=df['retweets'].values, index=df['date'])
time_retweets.plot(figsize=(16, 4), color='r', title='Count of Retweets')
plt.show()
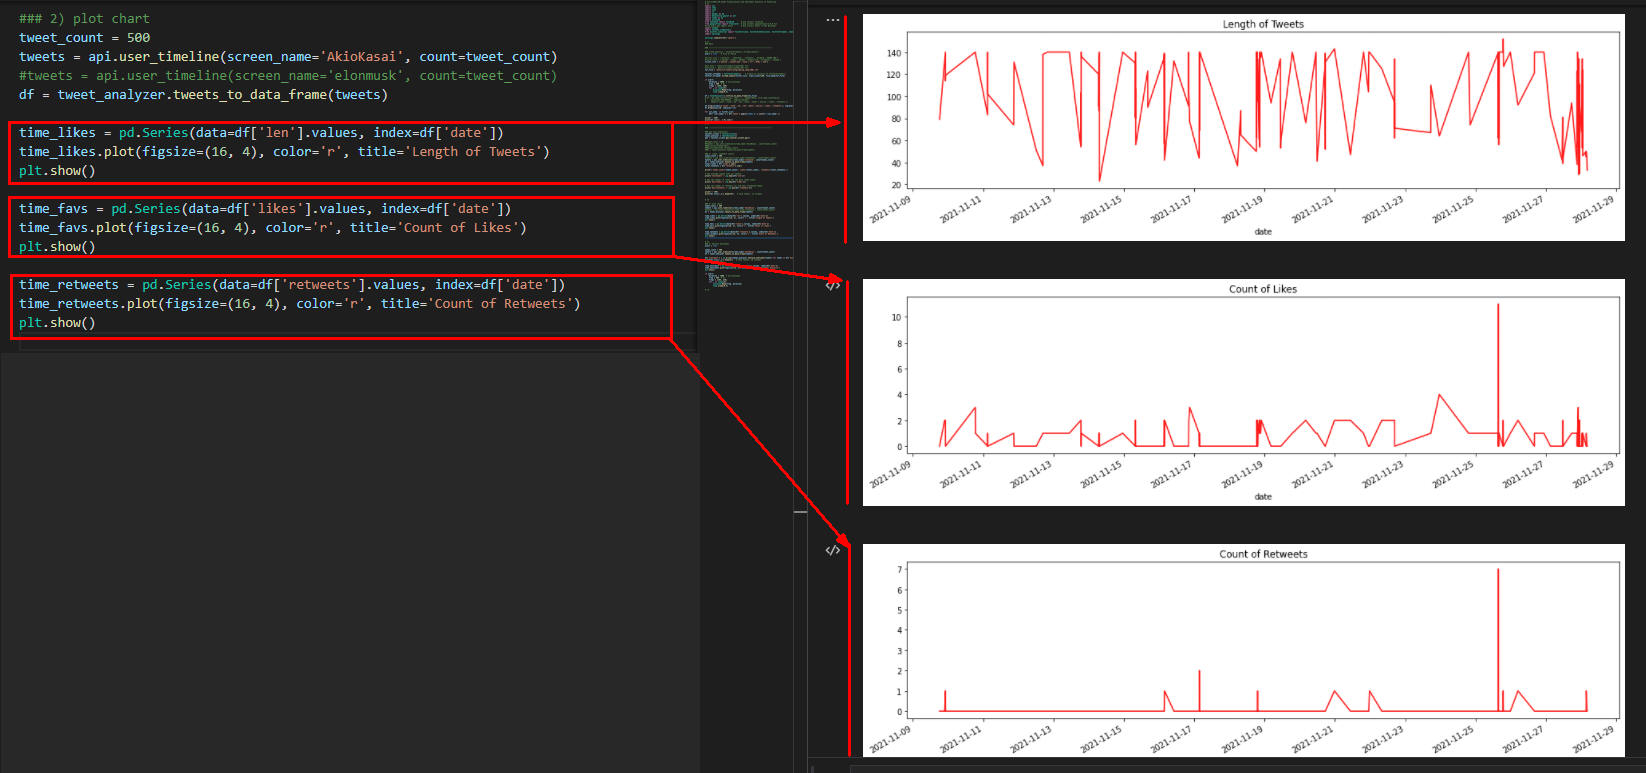 図5-1
図5-1は私の直近の500件のツイートを分析したものです。
ここではツイートの長さ、LikesとReTweetsの件数をグラフで表示しています。
図5-1
図5-1は私の直近の500件のツイートを分析したものです。
ここではツイートの長さ、LikesとReTweetsの件数をグラフで表示しています。
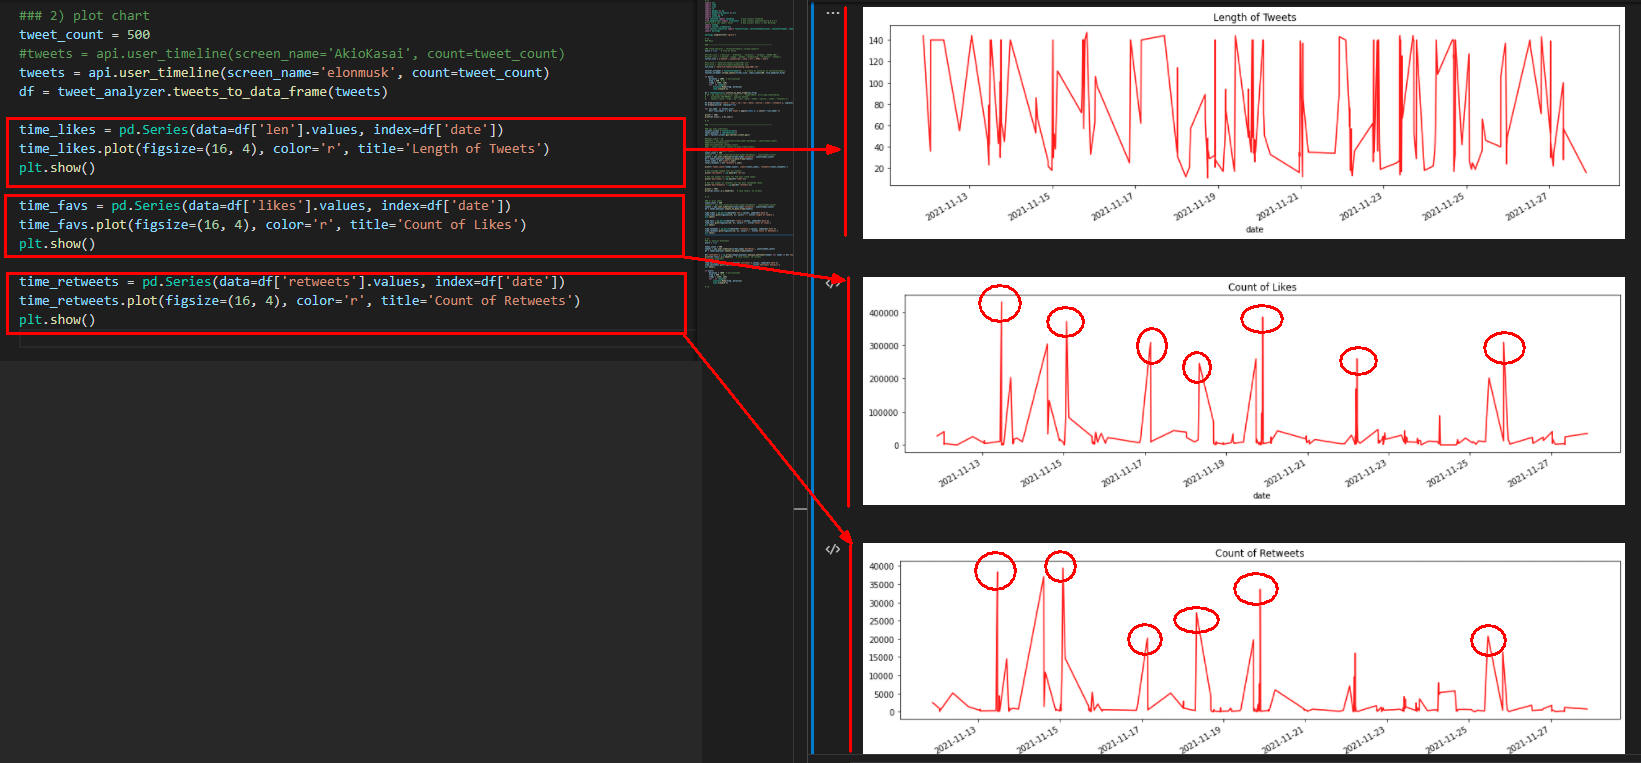 図5-2
図5-2はイーロン・マスクの直近の500件のツイートを分析したものです。
ここではツイートの長さ、LikesとReTweetsの件数をグラフで表示しています。
図5-2
図5-2はイーロン・マスクの直近の500件のツイートを分析したものです。
ここではツイートの長さ、LikesとReTweetsの件数をグラフで表示しています。
-
api.user_timeline()メソッドで特定のユーザーのツイートを取得してセンチメント分析を行う
行9-10では直近の500件のツイートに対してセンチメント分析(感情分析)を行って先頭から5件表示しています。
行13-15では直近500件のツイートのセンチメント分析を線グラフで表示しています。
「+」がポジティブ、「-」がネガティブを意味します。
### 3) Analize Sentiment
alert = True

tweet_count = 500
tweets = api.user_timeline(screen_name='AkioKasai', count=tweet_count)
#tweets = api.user_timeline(screen_name='elonmusk', count=tweet_count)
df = tweet_analyzer.tweets_to_data_frame(tweets)

df['sentiment'] = np.array([tweet_analyzer.analyze_sentiment(tweet) for tweet in df['tweets']])
print(df.iloc[:,2:].head(5))   # skip tweets, id columns
#print(df.head(10))

time_sentiment = pd.Series(data=df['sentiment'].values, index=df['date'])
time_sentiment.plot(figsize=(16, 4), color='r', title='Sentiment Analysis')
plt.show()

if alert:
    duration = 1000
    freq = 400
    freqs = [196, 220]
    for _ in range(3):
        winsound.Beep(freq, duration)
        time.sleep(0.3)
 図6-1
図6-1は私の直近の500件のツイートのセンチメント分析(感情分析)をしたものです。
このグラフを見るとほぼポジティブな投稿をしていることがわかります。
図6-1
図6-1は私の直近の500件のツイートのセンチメント分析(感情分析)をしたものです。
このグラフを見るとほぼポジティブな投稿をしていることがわかります。
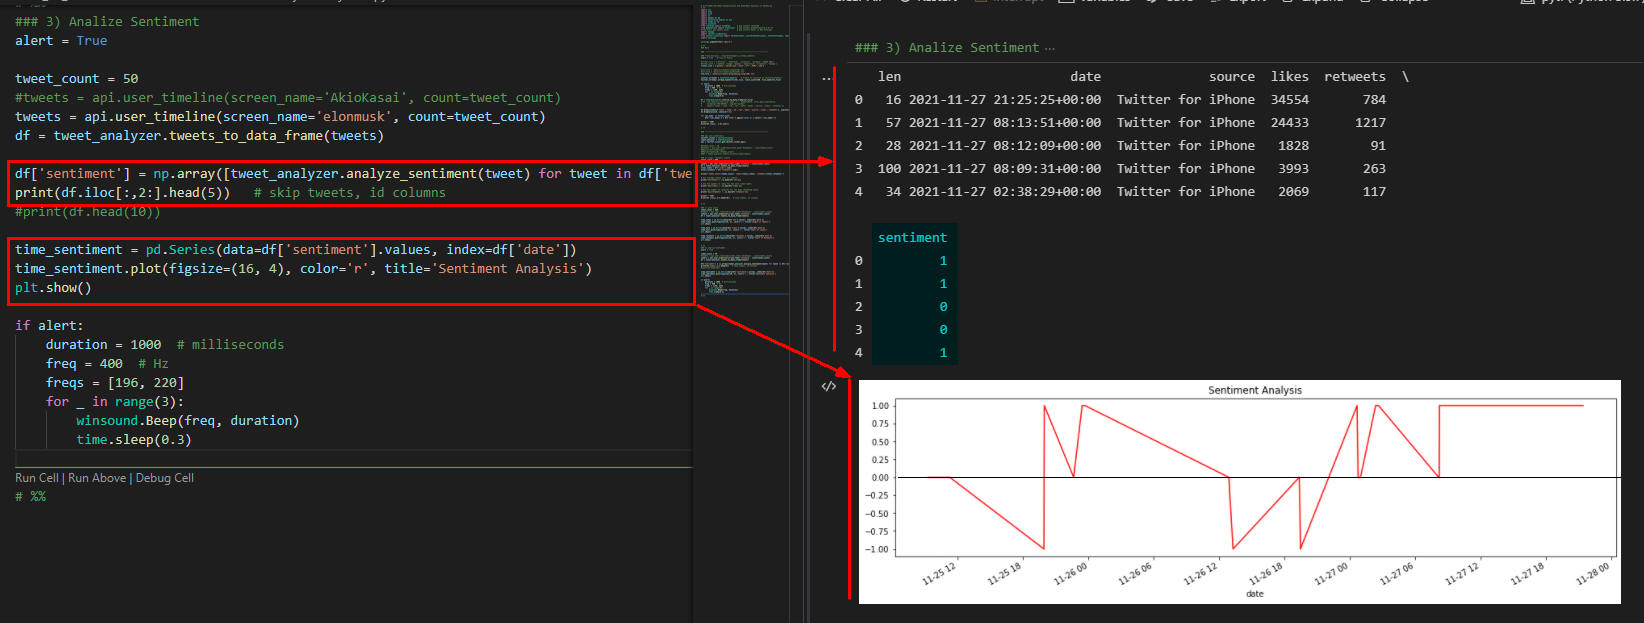 図6-2
図6-2はイーロン・マスクの直近の500件のツイートのセンチメント分析(感情分析)をしたものです。
このグラフを見るとポジティブな投稿が多いことがわかります。
図6-2
図6-2はイーロン・マスクの直近の500件のツイートのセンチメント分析(感情分析)をしたものです。
このグラフを見るとポジティブな投稿が多いことがわかります。
-
ここで解説したコードをまとめて掲載
最後にここで解説したすべてのコードをまとめて掲載しましたので参考にしてください。
import sys
import time
import json
import re
import pandas as pd
import matplotlib.pyplot as plt
import numpy as np
import winsound
from textblob import TextBlob       # pip install textblob
from googletrans import Translator  # pip install googletrans==4.0.0-rc1
#from asari.api import Sonar        # pip install asari => Not Working!
import tweepy
import twitter_credentials
from twitter_libraries import TwitterClient, TwitterAuthenticator, TwitterStreamer, TweetAnalyzer
import warnings

warnings.simplefilter('ignore')

# %%
### Main

### ---------------------------------------------------------------

# ### Trend Analysis : TwitterStreamer().stream_tweets()
# alert = True    # True of False

# #filter_list = ['bitcoin', 'ethereum', 'litecoin', 'Cardano','SHIBA INU']
# #filter_list = ['python','numpy','pandas','matplotlib','streamlit','tweepy']
# filter_list = ['python','JavaScript','Java','C++','HTML','CSS']

# #txt_file = 'data/txt/tweets/crypto(50).txt'
# #txt_file = 'data/txt/tweets/python(50).txt'
# txt_file = 'data/txt/tweets/programming_lang(100).txt'

# twitter_streamer = TwitterStreamer()    # Create an instalce of TwitterStreamer()
# twitter_streamer.stream_tweets(filter_list, limit_count=100, file_name=txt_file)

# if alert:
#     duration = 1000  # milliseconds
#     freq = 400  # Hz
#     freqs = [196, 220]
#     for _ in range(3):
#         winsound.Beep(freq, duration)
#         time.sleep(0.3)

# df = TweetAnalyzer().txtfile_to_data_frame(txt_file)
# # df = pd.read_csv(txt_file, sep=':::', header=None, error_bad_lines=False,
# #     encoding='ISO-8859–1', engine='python',
# #     names=['count','time','id','len','date','tweet','source','likes','retweets'])

# df.drop(columns=['count','time','id','len','date','source','likes','retweets'], inplace=True)
# df.dropna(axis=0, inplace=True)

# for col_name  in filter_list:
#     df[f'{col_name}'] = df['tweet'].apply(lambda x: x.count(f'{col_name}'))

# print('-'*80)
# print(df.iloc[:, 1:6].sum())

# %%

### ---------------------------------------------------------------

### api.user_timeline()
twitter_client = TwitterClient()
tweet_analyzer = TweetAnalyzer()
api = twitter_client.get_twitter_client_api()

##tweet_count = 10
##tweets = api.user_timeline(screen_name='AkioKasai', count=tweet_count)
###print(dir(tweets[0]))
###print(tweets[0].retweet_count)
##df = tweet_analyzer.tweets_to_data_frame(tweets)

### 1) likes, retweets counts
tweet_count = 500
#tweets = api.user_timeline(screen_name='AkioKasai', count=tweet_count)
#tweets = api.user_timeline(screen_name='elonmusk', count=tweet_count)
tweets = api.user_timeline(screen_name='takapon_jp', count=tweet_count)
#tweets = api.user_timeline(screen_name='yousuck2020', count=tweet_count)
#tweets = api.user_timeline(screen_name='kenichiromogi', count=tweet_count)
df = tweet_analyzer.tweets_to_data_frame(tweets)
total_likes = df['likes'].sum()
total_retweets = df['retweets'].sum()

print(f'tweet count={tweet_count}, total likes={total_likes}, total retweets={total_retweets}')
print('-'*100)
# Get average length over all tweets:
#print('len(tweet) =',np.mean(df['len']))

# Get the number of likes for the most liked tweet:
print('max(likes) =',np.max(df['likes']))

# Get the number of retweets for the most retweeted tweet:
print('max(retweets) =',np.max(df['retweets']))

# print('-'*100)
# print(df.iloc[:,2:].head(10))   # skip tweets, id columns

dfx = df.sort_values(by='likes', ascending=False)
print('-'*100)
dfx['tweets'] = dfx['tweets'].apply(lambda x: x.replace('\x20',''))

likes = dfx.loc[:,'likes'].values
tweets = dfx.loc[:,'tweets'].values
for i in range(5):
    print(f'{i+1}: likes={likes[0:6][i]}, tweet=({tweets[0:6][i]})')

# strx = str.replace('\x20','')
#pd.options.display.max_colwidth = 200
#print(dfx.loc[:,['date','tweets','likes']].head(5))   # skip tweets, id columns


# %%

### 2) plot chart
tweet_count = 500
#tweets = api.user_timeline(screen_name='AkioKasai', count=tweet_count)
#tweets = api.user_timeline(screen_name='elonmusk', count=tweet_count)
#tweets = api.user_timeline(screen_name='takapon_jp', count=tweet_count)
tweets = api.user_timeline(screen_name='yousuck2020', count=tweet_count)
#tweets = api.user_timeline(screen_name='kenichiromogi', count=tweet_count)
df = tweet_analyzer.tweets_to_data_frame(tweets)

# time_likes = pd.Series(data=df['len'].values, index=df['date'])
# time_likes.plot(figsize=(16, 4), color='r', title='Length of Tweets')
# plt.show()

time_favs = pd.Series(data=df['likes'].values, index=df['date'])
time_favs.plot(figsize=(16, 4), color='r', title='Count of Likes')
plt.show()

time_retweets = pd.Series(data=df['retweets'].values, index=df['date'])
time_retweets.plot(figsize=(16, 4), color='r', title='Count of Retweets')
plt.show()


# %%
### 3) Analize Sentiment
alert = False

tweet_count = 50
#tweets = api.user_timeline(screen_name='AkioKasai', count=tweet_count)
#tweets = api.user_timeline(screen_name='elonmusk', count=tweet_count)
#tweets = api.user_timeline(screen_name='takapon_jp', count=tweet_count)
tweets = api.user_timeline(screen_name='yousuck2020', count=tweet_count)
#tweets = api.user_timeline(screen_name='kenichiromogi', count=tweet_count)
#tweets = api.user_timeline(screen_name='elonmusk', count=tweet_count)
df = tweet_analyzer.tweets_to_data_frame(tweets)

# def traslate_tweets(tweet):
#     tr = Translator()
#     lang = tr.detect(tweet)
#     if lang.lang == 'ja':
#         trans = tr.translate(tweet, src='ja', dest='en')
#         return trans.text  # Japanese => English
#     return tweet

# df['tweets_trans'] = df['tweets'].apply(traslate_tweets)

# for tweet in df['tweets_trans']:
#     print(tweet)

df['sentiment'] = np.array([tweet_analyzer.analyze_sentiment(tweet) for tweet in df['tweets']])
#df['sentiment'] = np.array([tweet_analyzer.analyze_sentiment(tweet) for tweet in df['tweets_trans']])
print(df.iloc[:,2:].head(5))   # skip tweets, id columns
print(df.head(10))

time_sentiment = pd.Series(data=df['sentiment'].values, index=df['date'])
time_sentiment.plot(figsize=(16, 4), color='r', title='Sentiment Analysis')
plt.show()

if alert:
    duration = 1000  # milliseconds
    freq = 400  # Hz
    freqs = [196, 220]
    for _ in range(3):
        winsound.Beep(freq, duration)
        time.sleep(0.3)

# %%