-
仮想通貨(Bitcoin)の取り引きデータを準備する
ここではYahoo! FinanceからBitcoinの過去の取り引きデータをダウンロードして使用します。
取り引きデータは「2021/01/01」から当日までのものを使用します。
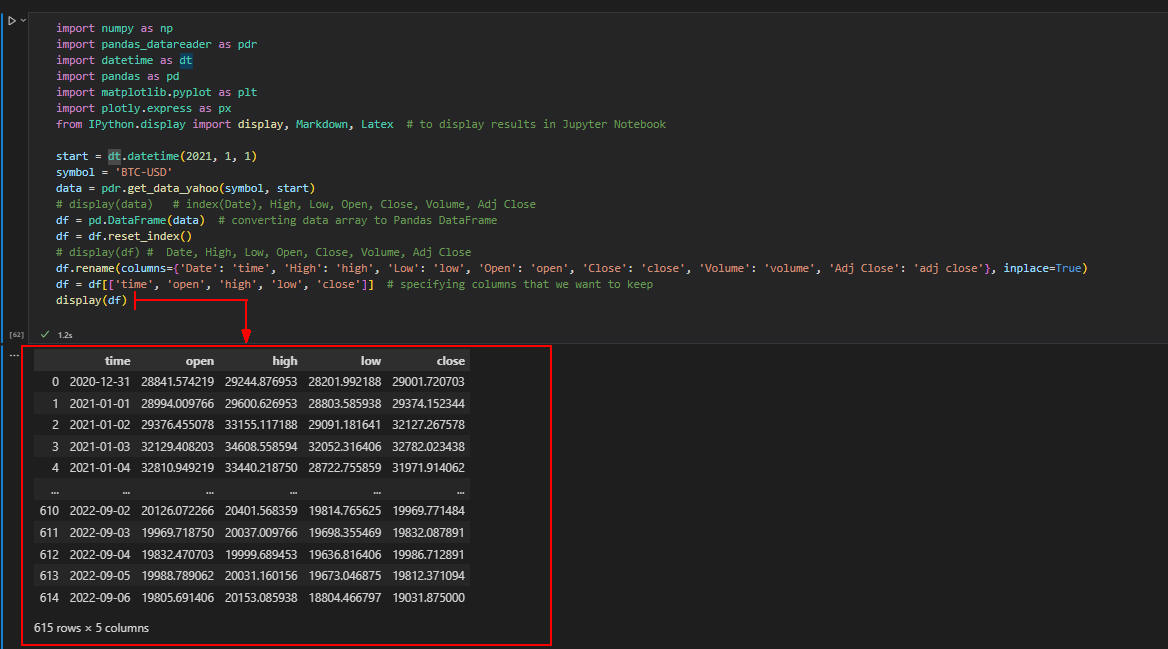
Visual Studio Code (VS Code)を起動したら新規ファイルを作成して行1-22を入力(コピペ)します。
行2-8ではPytonのライブラリを取り込んでいます。
行12ではPandasのdatareaderでYahoo! FinanceからBitcoinの取り引きデータをダウンロードしています。
行14ではBitcoinのデータをPandasのDataFrameに保存しています。
行15ではPandasのDataFrameからindex(Date)をリセットして通常のカラム(列)に戻しています。
行17ではPandasのDataFrameの列名を変更しています。
行18ではPandasのDataFrameから必要な列のみ選択して並べ替えています。
行19ではPandasのDataFrameをJupter Notebookの表形式で表示しています。
行21-22ではPlotlyでグラフを作成して表示しています。
# Libraries
import numpy as np
import pandas_datareader as pdr
import datetime as dt
import pandas as pd
import matplotlib.pyplot as plt
import plotly.express as px
from IPython.display import display   # to display results in Jupyter Notebook

start = dt.datetime(2021, 1, 1)
symbol = 'BTC-USD'
data = pdr.get_data_yahoo(symbol, start)
# display(data)   # index(Date), High, Low, Open, Close, Volume, Adj Close
df = pd.DataFrame(data)
df = df.reset_index()   # reset index
# display(df) #  Date, High, Low, Open, Close, Volume, Adj Close
df.rename(columns={'Date': 'time', 'High': 'high', 'Low': 'low', 'Open': 'open', 'Close': 'close', 'Volume': 'volume', 'Adj Close': 'adj close'}, inplace=True)
df = df[['time', 'open', 'high', 'low', 'close']]   # reorder columns
display(df)

fig = px.line(df, x='time', y='close', title=f'{symbol} - Close Prices')
display(fig)
 図1-1
図1-1は実行結果です。
Yahoo! FinanceからダウンロードしたBitcoinの取り引きデータが表示されています。
図1-1
図1-1は実行結果です。
Yahoo! FinanceからダウンロードしたBitcoinの取り引きデータが表示されています。
VS CodeからJupter Notebookのようにセル単位でプログラムを実行させるには、
Pythonのコードを「#%%~#%%」で囲みます。
セルを実行させるには[Ctrl + Enter]を押します。
ここではVS CodeからJupter Notebookのファイル「10-indicators.jpynb」を直接開いてセル単位に実行させています。
 図1-2
図1-2ではPlotlyでPandasのDataFrameの「close」のグラフ(終値:Close Prices)を表示させています。
図1-2
図1-2ではPlotlyでPandasのDataFrameの「close」のグラフ(終値:Close Prices)を表示させています。
-
単純移動平均 (SMA: Simple Moving Average)
ここではBitcoinの単純移動平均(SMA)を計算してPlotlyでグラフに表示します。
sma_period = 10  # defining the sma period to 10
df['sma_10'] = df['close'].rolling(sma_period).mean()
display(df[['time', 'close', 'sma_10']])

# plotting the SMA
fig_sma = px.line(df, x='time', y=['close', 'sma_10'], title=f'{symbol} - SMA Indicator')
display(fig_sma)
 図2
図2にはPandasのDataFrameの「time, close, sma_10」の値と、
DataFrameの「close, sma_10」のグラフ(単純移動平均:SMA Indicator)が表示されています。
図2
図2にはPandasのDataFrameの「time, close, sma_10」の値と、
DataFrameの「close, sma_10」のグラフ(単純移動平均:SMA Indicator)が表示されています。
-
指数平滑移動平均線 (EMA: Exponential Moving Average)
ここではBitcoinの指数平滑移動平均線(EMA)を計算してPlotlyでグラフに表示します。
ema_period = 10  # defining the ema period to 10
df['ema_10'] = df['close'].ewm(span=ema_period, min_periods=ema_period).mean()
display(df[['time', 'close', 'ema_10']])

# plotting the SMA
fig_ema = px.line(df, x='time', y=['close', 'ema_10'], title=f'{symbol} - EMA Indicator')
display(fig_ema)

# plotting the SMA and EMA side by side
fig_sma_ema_compare = px.line(df, x='time', y=['close', 'sma_10', 'ema_10'], title=f'{symbol} - Comparison SMA vs EMA')
display(fig_sma_ema_compare)
 図3-1
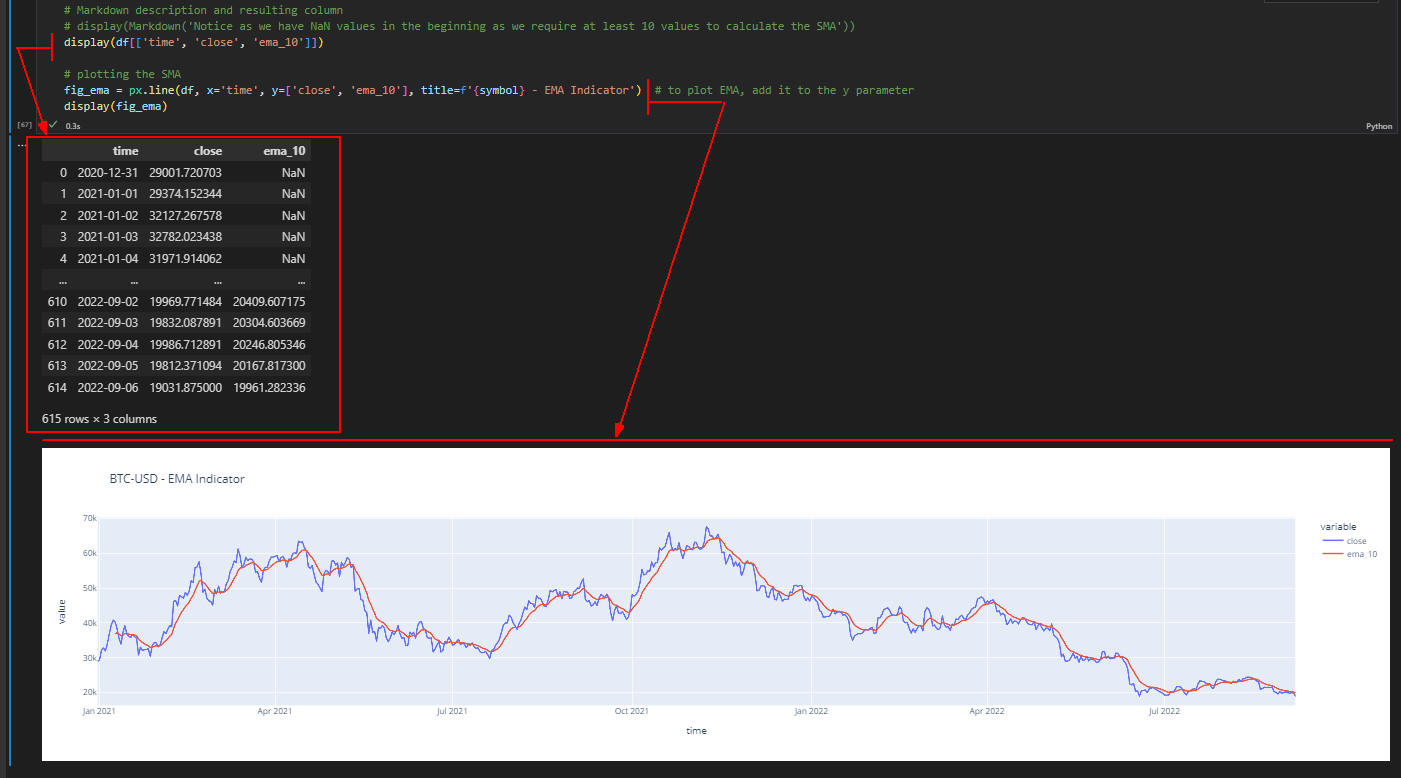
図3-1にはPandasのDataFrameの「time, close, ema-10」の値と、
DataFrameの「close, ema_10」のグラフ(指数平滑移動平均線: EMA Indicator)が表示されています。
図3-1
図3-1にはPandasのDataFrameの「time, close, ema-10」の値と、
DataFrameの「close, ema_10」のグラフ(指数平滑移動平均線: EMA Indicator)が表示されています。
 図3-2
図3-2にはPandasのDataFrameの「close, sma_10, ema_10」のグラフ(SMAとEMAの比較:Comparison SMA vs EMA)が表示されています。
図3-2
図3-2にはPandasのDataFrameの「close, sma_10, ema_10」のグラフ(SMAとEMAの比較:Comparison SMA vs EMA)が表示されています。
-
ATR (Average True Range)
ここではBitcoinのATR(真の値幅の平均)を計算してPlotlyでグラフに表示します。
atr_period = 14  # defining the atr period to 14
# high - low
df['high_low'] = df['high'] - df['low']
df['atr_high_low'] = df['high_low'].rolling(atr_period).mean()

# high - previous close
df['high_prev_close'] = df['high'] - df['close'].shift()
df['atr_high_prev_close'] = df['high_prev_close'].rolling(atr_period).mean()

# low - previous close
df['low_prev_close'] = df['low'] - df['close'].shift()
df['atr_low_prev_close'] = df['low_prev_close'].rolling(atr_period).mean()

# # max
# df['tr'] = df[['high_low', 'high_prev_close', 'low_prev_close']].max(axis=1)
# df['atr'] = df['tr'].rolling(atr_period).mean()
display(df[['time', 'atr_high_low', 'atr_high_prev_close', 'atr_low_prev_close']])

# plotting the ATR Indicator
fig_atr = px.line(df, x='time', y=['atr_high_low', 'atr_high_prev_close', 'atr_low_prev_close'], title=f'{symbol} - ATR Indicator')
display(fig_atr)
 図4
図4にはPandasのDataFrameの「time, atr_high_low, atr_high_prev_close, atr_low_prev_price」の値と、
DataFrameの「atr_high_low, atr_high_prev_close, atr_low_prev_close」のグラフ(ATR Indicator)が表示されています。
図4
図4にはPandasのDataFrameの「time, atr_high_low, atr_high_prev_close, atr_low_prev_price」の値と、
DataFrameの「atr_high_low, atr_high_prev_close, atr_low_prev_close」のグラフ(ATR Indicator)が表示されています。
-
RSI (Relative Strength Index)
ここではBitcoinのRSI(相対力指数)を計算してPlotlyでグラフに表示します。
# setting the RSI Period
rsi_period = 14

# to calculate RSI, we first need to calculate the exponential weighted aveage gain and loss during the period
df['gain'] = (df['close'] - df['open']).apply(lambda x: x if x > 0 else 0)
df['loss'] = (df['close'] - df['open']).apply(lambda x: -x if x < 0 else 0)

# here we use the same formula to calculate Exponential Moving Average
df['ema_gain'] = df['gain'].ewm(span=rsi_period, min_periods=rsi_period).mean()
df['ema_loss'] = df['loss'].ewm(span=rsi_period, min_periods=rsi_period).mean()

# the Relative Strength is the ratio between the exponential avg gain divided by the exponential avg loss
df['rs'] = df['ema_gain'] / df['ema_loss']

# the RSI is calculated based on the Relative Strength using the following formula
df['rsi_14'] = 100 - (100 / (df['rs'] + 1))
display(df[['time', 'rsi_14', 'rs', 'ema_gain', 'ema_loss']])

# plotting the RSI
fig_rsi = px.line(df, x='time', y='rsi_14', title=f'{symbol} - RSI Indicator')

# RSI commonly uses oversold and overbought levels, usually at 70 and 30
overbought_level = 70
orversold_level = 30

# adding oversold and overbought levels to the plot
fig_rsi.add_hline(y=overbought_level, opacity=0.5)
fig_rsi.add_hline(y=orversold_level, opacity=0.5)

# showing the RSI Figure
display(fig_rsi)
 図5
図5にはPandasのDataFrameの「time, rsi_14, rs, ems_gain」の値と、
DataFrameの「time, rsi_14」のグラフ(RSI Indicator)が表示されています。
図5
図5にはPandasのDataFrameの「time, rsi_14, rs, ems_gain」の値と、
DataFrameの「time, rsi_14」のグラフ(RSI Indicator)が表示されています。
-
前日の高値・安値(High/Low of previous Session)
ここではBitcoinの前日の最値(High)と安値(Low)を計算してPlotlyでグラフに表示します
df['prev_high'] = df['high'].shift(1)
df['prev_low'] = df['low'].shift(1)
display(df[['close', 'high', 'prev_high', 'low', 'prev_low']])

# showing high/low of previous Figure
fig_prev_hl = px.line(df, x='time', y=['close', 'prev_high', 'prev_low'], title=f'{symbol} - High/Low of Previous')
display(fig_prev_hl)
 図6
図6にはPandasのDataFrameの「close, high, prev_high, low, prev_low」の値と、
DataFrameの「close, prev_high, prev_low」のグラフ(前日の高値・安値: High/Low of Previous)が表示されています。
図6
図6にはPandasのDataFrameの「close, high, prev_high, low, prev_low」の値と、
DataFrameの「close, prev_high, prev_low」のグラフ(前日の高値・安値: High/Low of Previous)が表示されています。
-
標準偏差(STD: Standard Deviation)
ここではBitcoinの標準偏差(STD)を計算してPlotlyでグラフに表示します
# setting the deviation period
deviation_period = 20

# simple way to calculate Standard Deviation is to use std()
df['std_20'] = df['close'].rolling(deviation_period).std()

# showing the data
display(df[['time', 'close', 'std_20']])

# plotting the data
fig_std = px.line(df, x='time', y='std_20', title=f"{symbol} - Standard Deviation")
display(fig)
display(fig_std)
 図7-1
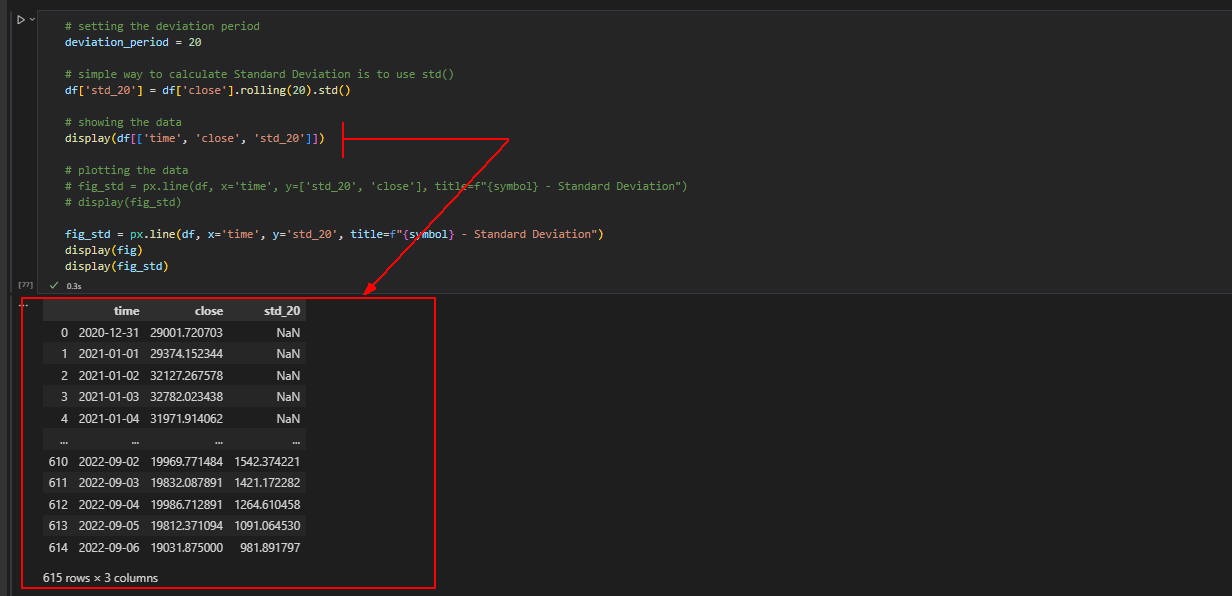
図7-1にはPandasのDataFrameの「time, close, std_20」の値が表示されています。
図7-1
図7-1にはPandasのDataFrameの「time, close, std_20」の値が表示されています。
 図7-2
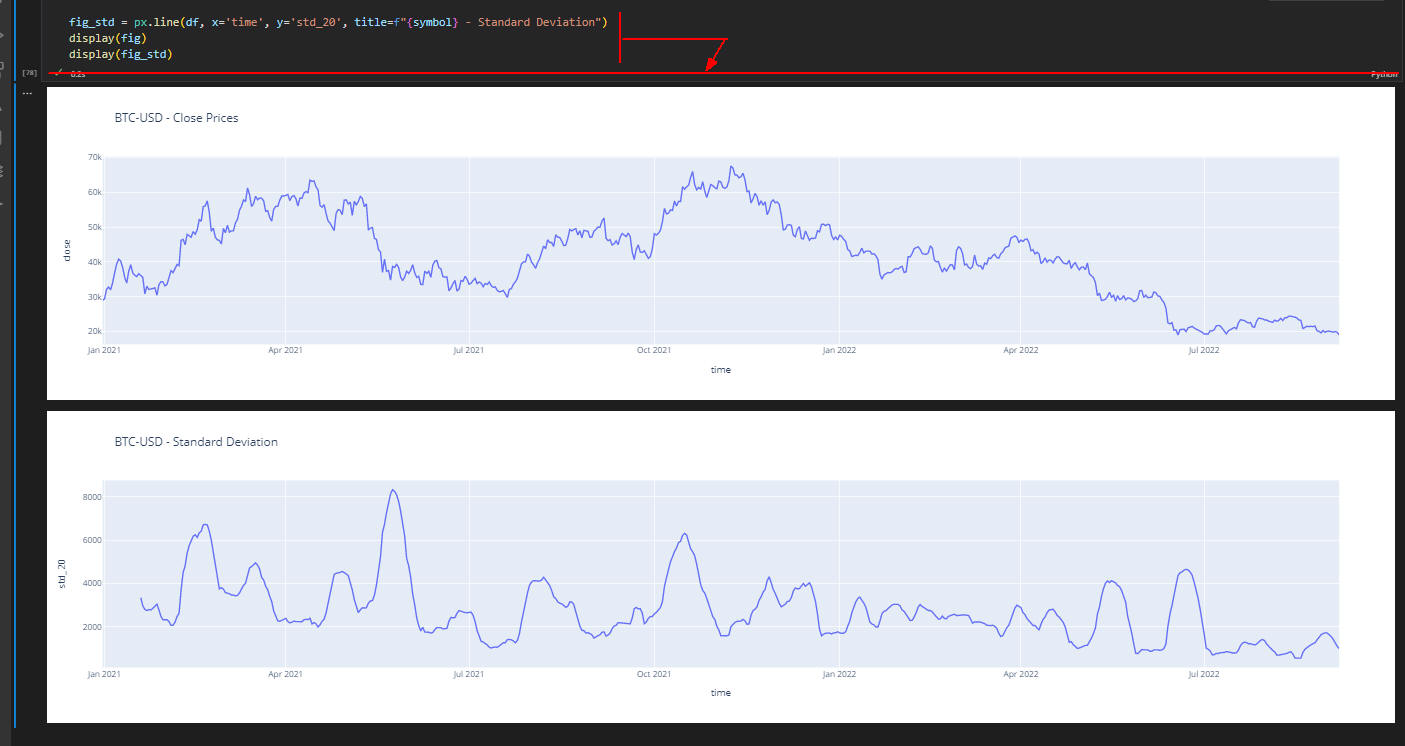
図7-2にはDataFrameの「close」と「std_20」の2種類のグラフ(終値・標準偏差: Close Price / Standard Diviation)が表示されています。
図7-2
図7-2にはDataFrameの「close」と「std_20」の2種類のグラフ(終値・標準偏差: Close Price / Standard Diviation)が表示されています。
-
ボリンジャーバンド (Bollinger Bands)
ここではBitcoinのボリンジャーバンド (Bollinger Bands) を計算してPlotlyでグラフに表示します
# setting SMA Period to 20
sma_period = 20

# calculating individual components of Bollinger Bands
df['sma_20'] = df['close'].rolling(sma_period).mean()
df['upper_band_20'] = df['sma_20'] + 2 * df['std_20']
df['lower_band_20'] = df['sma_20'] - 2 * df['std_20']

display(df[['time', 'close', 'sma_20', 'upper_band_20', 'lower_band_20']])

# plotting Bollinger Bands
fig_bollinger = px.line(df, x='time', y=['close', 'sma_20', 'upper_band_20', 'lower_band_20'], title=f'{symbol} - Bollinger Bands')
display(fig_bollinger)
 図8
図8にはPandasのDataFrameの「time, close, sma_20, upper_band_20, lower_band_20」の値と、
DataFrameの「close, sma_20, upper_band_20, lower_band_20」のグラフ(ボリンジャーバンド:Bollinger Bands)が表示されています。
図8
図8にはPandasのDataFrameの「time, close, sma_20, upper_band_20, lower_band_20」の値と、
DataFrameの「close, sma_20, upper_band_20, lower_band_20」のグラフ(ボリンジャーバンド:Bollinger Bands)が表示されています。
-
MACD (Moving Average Convergence/Divergence)
ここではBitcoinのMACDを計算してPlotlyでグラフに表示します
# setting the EMA periods
fast_ema_period = 12
slow_ema_period = 26

# calculating EMAs
df['ema_12'] = df['close'].ewm(span=fast_ema_period, min_periods=fast_ema_period).mean()
df['ema_26'] = df['close'].ewm(span=slow_ema_period, min_periods=slow_ema_period).mean()

# calculating MACD by subtracting the EMAs
df['macd'] = df['ema_26'] - df['ema_12']

# calculating to Signal Line by taking the EMA of the MACD
signal_period = 9
df['macd_signal'] = df['macd'].ewm(span=signal_period, min_periods=signal_period).mean()
display(df[['time', 'close', 'macd', 'macd_signal']])

# plotting
fig_macd = px.line(df, x='time', y=[df['macd'], df['macd_signal']], title=f'{symbol} - MACD')
display(fig_macd)
 図9
図9にはPandasのDataFrameの「time, close, macd, macd_signal」の値と、
DataFrameの「macd, macd_signa」のグラフ(MACD)が表示されています。
図9
図9にはPandasのDataFrameの「time, close, macd, macd_signal」の値と、
DataFrameの「macd, macd_signa」のグラフ(MACD)が表示されています。
-
単純移動平均クロスオーバー (SMA Crossover)
ここではBitcoinの単純移動平均クロスオーバー (SMA Crossover) を計算してPlotlyでグラフに表示します。
# setting the SMA Periods
fast_sma_period = 10
slow_sma_period = 20

# calculating fast SMA
df['sma_10'] = df['close'].rolling(fast_sma_period).mean()

# To find crossovers, previous SMA value is necessary using shift()
df['prev_sma_10'] = df['sma_10'].shift(1)

# calculating slow SMA
df['sma_20'] = df['close'].rolling(slow_sma_period).mean()

# function to find crossovers
def sma_cross(row):
    bullish_crossover = row['sma_10'] >= row['sma_20'] and row['prev_sma_10'] < row['sma_20']
    bearish_crossover = row['sma_10'] <= row['sma_20'] and row['prev_sma_10'] > row['sma_20']
    if bullish_crossover or bearish_crossover:
        return True

# applying function to dataframe
df['crossover'] = df.apply(sma_cross, axis=1)

# plotting moving averages
fig_crossover = px.line(df, x='time', y=['close', 'sma_10', 'sma_20'], title=f'{symbol} - SMA Crossover')

# plotting crossovers
for i, row in df[df['crossover'] == True].iterrows():
    fig_crossover.add_vline(x=row['time'], opacity=0.2)

display(fig_crossover)
 図10
図10にはPandasのDataFrameの「close, sma_10, sma_20」のグラフ(単純移動平均クロスオーバー:SMA Crossover)が表示されています。
図10
図10にはPandasのDataFrameの「close, sma_10, sma_20」のグラフ(単純移動平均クロスオーバー:SMA Crossover)が表示されています。
-
ストキャスティクス (Stochastic Oscillator)
ここではBitcoinの ストキャスティクス (Stochastic Oscillator) を計算してPlotlyでグラフに表示します。
# setting the period
stochastic_period = 14

# calculating maximum high and minimum low for the period
df['14_period_low'] = df['low'].rolling(stochastic_period).min()
df['14_period_high'] = df['high'].rolling(stochastic_period).max()

# formula to calculate the Stochastic Oscillator
df['stoch_osc'] = (df['close'] - df['14_period_low']) / (df['14_period_high'] - df['14_period_low'])
display(df[['time', 'stoch_osc']])

# plotting
fig_stoch_osc = px.line(df, x='time', y='stoch_osc', title=f'{symbol} - Stochastic Oscillator')
display(fig_stoch_osc)
 図11
図10にはPandasのDataFrameの「time, stoch_osc」の値と、
DataFrameの「stoch_osc」のグラフ(ストキャスティクス:Stochastic Oscillator)が表示されています。
-
Pythonのすべてのコードを掲載
# 10-indicators.py
# %%
"""
1. Simple Moving Average (SMA)
2. Exponential Moving Average (EMA)
3. Average True Range (ATR)
4. RSI (Relative Strength Index)
5. High/Low of previous Session
6. Standard Deviation
7. Bollinger Bands
8. Moving Average Convergence/Divergence (MACD)
9. SMA Crossover
10. Stochastic Oscillator
"""
from IPython.display import display, Markdown, Latex  # to display results in Jupyter Notebook

import numpy as np
import pandas_datareader as pdr
import datetime as dt
import pandas as pd
import matplotlib.pyplot as plt
import plotly.express as px
from IPython.display import display, Markdown, Latex  # to display results in Jupyter Notebook

# %%
start = dt.datetime(2021, 1, 1)
symbol = 'BTC-USD'
data = pdr.get_data_yahoo(symbol, start)
# display(data)   # index(Date), High, Low, Open, Close, Volume, Adj Close
df = pd.DataFrame(data)  # converting data array to Pandas DataFrame
df = df.reset_index()
# display(df) #  Date, High, Low, Open, Close, Volume, Adj Close
df.rename(columns={'Date': 'time', 'High': 'high', 'Low': 'low', 'Open': 'open', 'Close': 'close', 'Volume': 'volume', 'Adj Close': 'adj close'}, inplace=True)
df = df[['time', 'open', 'high', 'low', 'close']]  # specifying columns that we want to keep
display(df)

fig = px.line(df, x='time', y='close', title=f'{symbol} - Close Prices')  # creating a figure using px.line
display(fig)  # showing figure in output

# %%

# 1: Simple Moving Average (SMA)

sma_period = 10  # defining the sma period to 10

# calculating sma in pandas using df.rolling().mean() applied on the close price
# rolling() defines the window for the period where sma_period is passed
# mean() calculates the average value
df['sma_10'] = df['close'].rolling(sma_period).mean()

# Markdown description and resulting column
# display(Markdown('Notice as we have NaN values in the beginning as we require at least 10 values to calculate the SMA'))
display(df[['time', 'close', 'sma_10']])

# plotting the SMA
fig_sma = px.line(df, x='time', y=['close', 'sma_10'], title=f'{symbol} - SMA Indicator')  # to plot SMA, add it to the y parameter
display(fig_sma)

# %%

# 2: Exponential Moving Average (EMA)
ema_period = 10  # defining the ema period to 10

# calculating sma in pandas using df.rolling().mean() applied on the close price
# rolling() defines the window for the period where ema_period is passed
# .ewm() creates an exponential weighted window with 'span is equal to our ema_period'
df['ema_10'] = df['close'].ewm(span=ema_period, min_periods=ema_period).mean()

# Markdown description and resulting column
# display(Markdown('Notice as we have NaN values in the beginning as we require at least 10 values to calculate the SMA'))
display(df[['time', 'close', 'ema_10']])

# plotting the SMA
fig_ema = px.line(df, x='time', y=['close', 'ema_10'], title=f'{symbol} - EMA Indicator')  # to plot EMA, add it to the y parameter
display(fig_ema)

# plotting the SMA and EMA side by side
fig_sma_ema_compare = px.line(df, x='time', y=['close', 'sma_10', 'ema_10'], title=f'{symbol} - Comparison SMA vs EMA')
display(fig_sma_ema_compare)

# %%

# 3: Average True Range (ATR)
atr_period = 14  # defining the atr period to 14
# High - Low
# calculating the range of each candle
df['high_low'] = df['high'] - df['low']
# calculating the average value of ranges
df['atr_high_low'] = df['high_low'].rolling(atr_period).mean()
# display(df[['time', 'atr_high_low']])

# High - Previous Close
# calculating the range of each candle
df['high_prev_close'] = df['high'] - df['close'].shift()
# calculating the average value of ranges
df['atr_high_prev_close'] = df['high_prev_close'].rolling(atr_period).mean()
# display(df[['time', 'atr_high_cp']])

# Low - Previous Close
# calculating the range of each candle
df['low_prev_close'] = df['low'] - df['close'].shift()
# calculating the average value of ranges
df['atr_low_prev_close'] = df['low_prev_close'].rolling(atr_period).mean()
# display(df[['time', 'atr_low_cp']])

# # Max
# df['tr'] = df[['high_low', 'high_prev_close', 'low_prev_close']].max(axis=1)
# df['atr'] = df['tr'].rolling(atr_period).mean()

display(df[['time', 'atr_high_low', 'atr_high_prev_close', 'atr_low_prev_close']])

# plotting the ATR Indicator
fig_atr = px.line(df, x='time', y=['atr_high_low', 'atr_high_prev_close', 'atr_low_prev_close'], title=f'{symbol} - ATR Indicator')
display(fig_atr)

# %%

# 4: RSI (Relative Strength Index)
# setting the RSI Period
rsi_period = 14

# to calculate RSI, we first need to calculate the exponential weighted aveage gain and loss during the period
df['gain'] = (df['close'] - df['open']).apply(lambda x: x if x > 0 else 0)
df['loss'] = (df['close'] - df['open']).apply(lambda x: -x if x < 0 else 0)

# here we use the same formula to calculate Exponential Moving Average
df['ema_gain'] = df['gain'].ewm(span=rsi_period, min_periods=rsi_period).mean()
df['ema_loss'] = df['loss'].ewm(span=rsi_period, min_periods=rsi_period).mean()

# the Relative Strength is the ratio between the exponential avg gain divided by the exponential avg loss
df['rs'] = df['ema_gain'] / df['ema_loss']

# the RSI is calculated based on the Relative Strength using the following formula
df['rsi_14'] = 100 - (100 / (df['rs'] + 1))

# displaying the results
display(df[['time', 'rsi_14', 'rs', 'ema_gain', 'ema_loss']])

# plotting the RSI
fig_rsi = px.line(df, x='time', y='rsi_14', title=f'{symbol} - RSI Indicator')

# RSI commonly uses oversold and overbought levels, usually at 70 and 30
overbought_level = 70
orversold_level = 30

# adding oversold and overbought levels to the plot
fig_rsi.add_hline(y=overbought_level, opacity=0.5)
fig_rsi.add_hline(y=orversold_level, opacity=0.5)

# showing the RSI Figure
display(fig_rsi)

# %%

# 5: High/Low of previous Session
# to calculate the previous High/Low, we can simply use shift() to check values of previous rows
df['prev_high'] = df['high'].shift(1)
df['prev_low'] = df['low'].shift(1)
display(df[['close', 'high', 'prev_high', 'low', 'prev_low']])

fig_prev_hl = px.line(df, x='time', y=['close', 'prev_high', 'prev_low'], title=f'{symbol} - High/Low of Previous')
display(fig_prev_hl)

# %%

# 6: Standard Deviation
# setting the deviation period
deviation_period = 20

# simple way to calculate Standard Deviation is to use std()
df['std_20'] = df['close'].rolling(deviation_period).std()

# showing the data
# display(df[['time', 'close', 'std_20']])

# plotting the data
# fig_std = px.line(df, x='time', y=['std_20', 'close'], title=f"{symbol} - Standard Deviation")
# display(fig_std)

fig_std = px.line(df, x='time', y='std_20', title=f"{symbol} - Standard Deviation")
display(fig)
display(fig_std)

# %%

# 7: Bollinger Bands
# setting SMA Period to 20
sma_period = 20

# calculating individual components of Bollinger Bands
df['sma_20'] = df['close'].rolling(sma_period).mean()
df['upper_band_20'] = df['sma_20'] + 2 * df['std_20']
df['lower_band_20'] = df['sma_20'] - 2 * df['std_20']

display(df[['time', 'close', 'sma_20', 'upper_band_20', 'lower_band_20']])

# plotting Bollinger Bands
fig_bollinger = px.line(df, x='time', y=['close', 'sma_20', 'upper_band_20', 'lower_band_20'], title=f'{symbol} - Bollinger Bands')
display(fig_bollinger)

# %%

# 8: Moving Average Convergence/Divergence (MACD)
# setting the EMA periods
fast_ema_period = 12
slow_ema_period = 26

# calculating EMAs
df['ema_12'] = df['close'].ewm(span=fast_ema_period, min_periods=fast_ema_period).mean()
df['ema_26'] = df['close'].ewm(span=slow_ema_period, min_periods=slow_ema_period).mean()

# calculating MACD by subtracting the EMAs
df['macd'] = df['ema_26'] - df['ema_12']

# calculating to Signal Line by taking the EMA of the MACD
signal_period = 9
df['macd_signal'] = df['macd'].ewm(span=signal_period, min_periods=signal_period).mean()
display(df[['time', 'close', 'macd', 'macd_signal']])

# Plotting
fig_macd = px.line(df, x='time', y=[df['macd'], df['macd_signal']], title=f'{symbol} - MACD')
display(fig_macd)

# 9: SMA Crossover
# %%

# setting the SMA Periods
fast_sma_period = 10
slow_sma_period = 20

# calculating fast SMA
df['sma_10'] = df['close'].rolling(fast_sma_period).mean()

# To find crossovers, previous SMA value is necessary using shift()
df['prev_sma_10'] = df['sma_10'].shift(1)

# calculating slow SMA
df['sma_20'] = df['close'].rolling(slow_sma_period).mean()

# function to find crossovers
def sma_cross(row):
    bullish_crossover = row['sma_10'] >= row['sma_20'] and row['prev_sma_10'] < row['sma_20']
    bearish_crossover = row['sma_10'] <= row['sma_20'] and row['prev_sma_10'] > row['sma_20']
    if bullish_crossover or bearish_crossover:
        return True

# applying function to dataframe
df['crossover'] = df.apply(sma_cross, axis=1)

# plotting moving averages
fig_crossover = px.line(df, x='time', y=['close', 'sma_10', 'sma_20'], title=f'{symbol} - SMA Crossover')

# plotting crossovers
for i, row in df[df['crossover'] == True].iterrows():
    fig_crossover.add_vline(x=row['time'], opacity=0.2)

display(fig_crossover)

# %%

# 10: Stochastic Oscillator
# setting the period
stochastic_period = 14

# calculating maximum high and minimum low for the period
df['14_period_low'] = df['low'].rolling(stochastic_period).min()
df['14_period_high'] = df['high'].rolling(stochastic_period).max()

# formula to calculate the Stochastic Oscillator
df['stoch_osc'] = (df['close'] - df['14_period_low']) / (df['14_period_high'] - df['14_period_low'])
display(df[['time', 'stoch_osc']])

# plotting
fig_stoch_osc = px.line(df, x='time', y='stoch_osc', title=f'{symbol} - Stochastic Oscillator')
display(fig_stoch_osc)

# %%