Python {Article052}

ようこそ「Python」へ...

Pythonでインタラクティブなデータドリブン型のWebアプリを作るには?

PythonとStreamlitを使用してインタラクティブなデータドリブン型のWebアプリを作る方法を解説します。 ここで作るアプリは、Twitterから投稿したツイートの「いいね」を分析して結果をWebページに表示します。 アプリがWebページに表示されたら「ユーザー名(Screen Name)」、「取得するツイートの件数」、「上位何件のツイートを表示するか?」 をマウスでスライダーから選択して[スタート!]ボタンをクリックします。

分析結果としてツイートの「いいね」件数の上位n件をWebページに表示します。 また、PandasのDataFrameに格納されているデータを2種類の表形式(スタティックな表とインタラクティブな表)で表示します。 インタラクティブな表に出力されたデータはそれぞれの列を昇順・降順に並べ替えることができます。 表の他にツイートの「いいね」件数を横棒グラフでも表示します。

Tweepyライブラリの使い方については「記事(Article047)」で解説しています。 Pythonからメールを送信する方法については「記事(Article050)」で解説しています。 事前に記事(Article047/Article050)を参照して基本を理解しておいてください。

ここではVisula Studio Code(VSC)の「Python Interactive window」 を使用してJupter Notebookのような環境で説明します。 VSCを通常の環境からインタラクティブな環境に切り換えるにはコードを記述するときコメント「# %%」を入力します。 詳しい、操作手順については「ここ」 を参照してください。 インタラクティブな環境では、Pythonの「print(), plt.show()」などを使う必要がないので掲載しているコードでは省略しています。 VSCで通常の環境で使用するときは、必要に応じて「print(), plt.show()」等を追加してください。

この記事では、Pandas、Matplotlibのライブラリを使用しますので 「記事(Article001) | 記事(Article002) | 記事(Article003) | 記事(Article004)」 を参照して事前にインストールしておいてください。 Pythonのコードを入力するときにMicrosoftのVisula Studio Codeを使用します。 まだ、インストールしていないときは「記事(Article001)」を参照してインストールしておいてください。

説明文の左側に図の画像が表示されていますが縮小されています。 画像を拡大するにはマウスを画像上に移動してクリックします。 画像が拡大表示されます。拡大された画像を閉じるには右上の[X]をクリックします。 画像の任意の場所をクリックして閉じることもできます。

click image to zoom!
Streamlit v1[1]
click image to zoom!
Streamlit v1[2]
click image to zoom!
Streamlit v1[3]
click image to zoom!
Streamlit v1[4]
click image to zoom!
Streamlit v1[5]
click image to zoom!
Streamlit v1[6]
click image to zoom!
Streamlit v2[1]
click image to zoom!
Streamlit v2[2]
click image to zoom!
Streamlit v2[3]
click image to zoom!
Streamlit v2[4]
click image to zoom!
Streamlit v2[5]
click image to zoom!
Streamlit v2[6]
click image to zoom!
Streamlit v2[7]
click image to zoom!
Streamlit v2[8]
click image to zoom!
Streamlit v2[9]


ツイート(Twitter)の「いいね」分析をWebページに表示する V1.00

  1. まずはPythonのライブラリを取り込む

    Visual Studio Code(VSC)を起動したら新規ファイルを作成して行1-28をコピペします。 行2-26ではPythonのライブラリを取り込んでいます。 行16, 17, 23のライブラリは独自に作成したものです。 これらのライブラリについては、 「記事(Article047)」、「記事(Article050)」で解説しています。 行28ではPythonの警告メッセージを抑止しています。
    # import the libralies
    from os import terminal_size
    import sys
    from datetime import datetime
    import time
    import json
    import re
    import pandas as pd
    import matplotlib as mpl
    import matplotlib.pyplot as plt
    import numpy as np
    import winsound
    from textblob import TextBlob       # pip install textblob
    from googletrans import Translator  # pip install googletrans==4.0.0-rc1   
    import tweepy
    import twitter_credentials
    from twitter_libraries import TwitterClient, TwitterAuthenticator, TwitterStreamer, TweetAnalyzer
    import warnings
    
    import smtplib
    from email.mime.multipart import MIMEMultipart
    from email.mime.text import MIMEText
    import gmail_config
    
    import streamlit as st
    import plotly.graph_objects as go
    
    warnings.simplefilter('ignore')
    click image to zoom!
    図1
    図1はVisula Studio Code(VSC)の画面です。 行16, 17, 23のライブラリは独自に作成したものです。 これらのライブラリは 「記事(Article047)」と 「記事(Article050)」で解説しています。 その他のライブラリはPythonの「pip install」でインストールしてください。
  2. アプリの前処理を行う

    行3-6ではユーザー関数を定義しています。 この関数では世界標準時間をローカール時間に変換しています。 行10-12ではTwitterのAPIを初期化しています。 行17ではWebページのレイアウトを3段組みに設定しています。 行21-28ではCSSを定義しています。 行29ではCSSを取り込んでいます。
    #---------------------------------#
    # User Functions
    def utc2local(utc):
        epoch = time.mktime(utc.timetuple())
        offset = datetime.fromtimestamp(epoch) - datetime.utcfromtimestamp(epoch)
        return utc + offset
    
    #---------------------------------#
    # Main
    twitter_client = TwitterClient()
    tweet_analyzer = TweetAnalyzer()
    api = twitter_client.get_twitter_client_api()
    
    #---------------------------------#
    # Page layout
    ## Page expands to full width
    st.set_page_config(layout="wide")
    
    #---------------------------------#
    # load style sheet font-size: large, x-large, xx-large
    w3_css = """
    .w3-xlarge {font-size: x-large}
    .w3-green {color: forestgreen}
    .w3-red {color: red}
    .w3-pink {color: pink}
    .w3-orange {color: orange}
    .w3-cyan {color: cyan}
    """
    st.markdown(f'<style>{w3_css}</style>', unsafe_allow_html=True)
    click image to zoom!
    図2
    図2はVisula Studio Code(VSC)の画面です。
  3. Webページを3段組みのレイアウトに設定してTitle, Aboutを表示する

    行3ではアプリのタイトルを表示しています。 行4ではアプリの概要を表示しています。 行10-13では「About」を表示しています。 Webページには「About」の文字のみ表示されます。 「About」の右側の[+]ボタンをクリックすると行11-13の説明が表示されます。

    行18-19ではWebページを3段組みに設定しています。
    #---------------------------------#
    # Title
    st.title('Twitter Likes Analysis APP')
    st.markdown("""
    インタラクティブなデータドリブン型のTwitter「いいね」分析ウェブアプリ! 
    """)
    
    #---------------------------------#
    # About
    expander_bar = st.expander('About')
    expander_bar.markdown("""
    このウェブアプリは特定のユーザーのツイートの「いいね」の件数を分析して表示します。
    """)
    
    #---------------------------------#
    # Page layout (continued)
    ## Divide page to 3 columns (col1 = sidebar, col2 and col3 = page contents)
    col1 = st.sidebar
    col2, col3 = st.columns((2,1))
    click image to zoom!
    図3
    図3はVisula Studio Code(VSC)の画面とWebページの画面を同時に表示させています。 Pythonで記述したStreamlitのコードがWebページのどこに表示されるかがわかります。
  4. Webページの左端(Left Sidebar)の情報を表示する

    ここでは画面左側のサイドバーのコンテンツを表示しています。 サイドバーは右上の[X]をクリックして隠すことができます。 行3ではサイドバーのヘッダーを表示しています。 行6-10ではTwitterのユーザー(Screen Name)を選択するドロップダウンリストを定義しています。 行12では選択してユーザー名を表示しています。

    行16ではツイートの件数を取得するスライダーを定義しています。 行17では選択した件数を表示しています。

    行20では「いいね」の上位何件を表示するかを選択するスライダーを定義しています。 行21では件数を表示しています。

    行24では[START ANALYSIS!]ボタンを定義しています。 このボタンをクリックするとツイートの分析結果を表示します。 行26-32ではTwitterのAPIを使用してユーザーの直近のツイート情報を取得してPanadasのDataFrameに格納しています。 不正なデータを取得したときはエラーメッセージを表示して再試行させます。 行35-37ではデータが正常に取得できたとき列「date」を世界標準時間からローカル時間に変換しています。 さらにデータ型をdatetime64からstr型(YYYY/MM/DD HH:MM:SS)に変換しています。
    #---------------------------------#
    # Sidebar (Left Side)
    col1.header('Options')
    
    ### 1) Select the user:
    screen_name = col1.selectbox(
        'Select screen name',
        ('elonmusk', 'AkioKasai', 'takapon_jp', 'yousuck2020', 
        'kenichiromogi', 'job_type_ojisan', 'naka1031p', 'payequity1',
        'NoelRecords_App', 'satoai3', 'kanehiro'))
    
    col1.write('screen name:', '@'+screen_name)
    
    
    ### 2) Select tweet count: max 200 tweets
    tweet_count = col1.slider('Select tweet count', 50, 200, 50, 10)
    col1.write('tweet count:', tweet_count)
    
    ### 3) Select tweet top N:
    tweet_topN = col1.slider('Select likes top N', 10, 50, 10, 5)
    col1.write('likes top N:', tweet_topN)
    
    ### 4) Run analysis:
    bol_run_analysis = col1.button('START ANALYSIS !')    
    
    if bol_run_analysis:
        tweets = api.user_timeline(screen_name=screen_name, count=tweet_count)
        df = tweet_analyzer.tweets_to_data_frame(tweets)
        dataType = df.dtypes['date'] 
        if dataType == np.float64:
            col1.write('An unexpected error has occurred. Please try again.', dataType)
            bol_run_analysis = False
    
    # No error?
    if bol_run_analysis:
        df['date'] = df['date'].apply(utc2local)
        df['date'] = df['date'].dt.strftime('%Y/%m/%d %H:%M:%S') 
    click image to zoom!
    図4
    図4はVisula Studio Code(VSC)の画面とWebページの画面を同時に表示させています。 Pythonで記述したStreamlitのコードがWebページのどこに表示されるかがわかります。
  5. Webページの中央のデータを表示する

    行22-37ではツイート取得件数、「いいね」の合計件数、「リツイート」の合計件数、 「いいね」のMax件数、「リツイート」のMax件数を表示しています。 行40-47では「いいね」の件数上位n件を表示しています。

    行55-63ではPandasのDataFrameの内容をスタティックな表形式で表示しています。 行70-77ではPandasのDataFrameの内容をダイナミックな表形式で表示しています。 ダイナミックな表は列見出しをクリックして列を昇順・降順に並べ替えすることができます。 また、表を上下にスクロールすることもできます。
    #---------------------------------#
    # Main col2
    #col2.subheader('Main Column')
    
    # df
    # Data columns (total 7 columns):
    #  #   Column    Non-Null Count  Dtype              
    # ---  ------    --------------  -----              
    #  0   tweets    200 non-null    object             
    #  1   id        200 non-null    int64              
    #  2   len       200 non-null    int32              
    #  3   date      200 non-null    datetime64[ns, UTC]
    #  4   source    200 non-null    object             
    #  5   likes     200 non-null    int32              
    #  6   retweets  200 non-null    int32              
    # dtypes: datetime64[ns, UTC](1), int32(3), int64(1), object(2)
    
    ### 0) Display screen name 
    col2.header(f'Tweet Analysis for @{screen_name}')
    
    if bol_run_analysis:
        total_likes = df['likes'].sum()
        total_retweets = df['retweets'].sum()
    
        max_likes = np.max(df['likes'])
        max_retweets = np.max(df['retweets'])
    
        col2.markdown(f'tweet count = <span class="w3-cyan">{tweet_count:,}</span>, total likes = <span class="w3-cyan">{total_likes:,}</span>, total retweets = <span class="w3-cyan">{total_retweets:,}</span>',
            unsafe_allow_html=True)
     
        # Get the number of likes for the most liked tweet:
        col2.markdown(f'max(likes) = <span class="w3-cyan">{max_likes:,}</span>', unsafe_allow_html=True)
    
        # Get the number of retweets for the most retweeted tweet:
        col2.markdown(f'max(retweets) = <span class="w3-cyan">{max_retweets:,}</span'gt;', unsafe_allow_html=True)
    
        col2.markdown('''---''')    # horizontal line HR tag
    
        # sort likes in descending order
        df.sort_values('likes', ascending=False, inplace=True)
        for i in range(tweet_topN):
            str_date = df.iloc[i, 3]    
            str_tweet = df.iloc[i, 0]   
            str_likes = df.iloc[i, 5]   
            row = f':sunglasses:<b class="w3-cyan w3-xlarge">{i+1}</b>: {str_likes},  {str_date}, {str_tweet}'
            col2.markdown(row, unsafe_allow_html=True)
    
    col2.markdown('''---''')
    
    ### 1) Top N Tweets : sorted by likes
    col2.subheader(f'DataFrame 1: Top {tweet_topN} likes of the tweet')
    
    if bol_run_analysis:
        df1 = df.copy()
        df1.sort_values('likes', ascending=False, inplace=True)
        df1.reset_index(inplace=True)
        df1.drop(['id','len','source','retweets'], axis=1, inplace=True) 
        df1 = df1[['likes','date','tweets']]
        df1.set_index('likes', inplace=True)
        df1 = df1.head(tweet_topN)  # 10 - 50
        col2.markdown(f'Data Dimension: <span class="w3-cyan">{df1.shape[0]:,}</span> rows and <span class="w3-cyan">{df1.shape[1]:,}</span> columns (sorted in descending order by likes).', unsafe_allow_html=True)
        col2.table(df1)
    
    col2.markdown('''---''')
    
    ### 2 Tweets DataFrame
    col2.subheader('DataFrame 2: Tweet data view')
    
    if bol_run_analysis:
        df2 = df.copy() # 50 - 200 (max 200)
        df2['date_local'] = pd.to_datetime(df2['date'], format='%Y/%m/%d %H:%M:%S') # Convert string to datetime format    
        df2.sort_values('date_local', ascending=False, inplace=True)
        df2.drop(['id', 'len', 'source', 'date_local'], axis=1, inplace=True) 
        df2 = df2[['date', 'likes', 'retweets', 'tweets']]
        df2.set_index('date', inplace=True)
        col2.markdown(f'Data Dimension: <span class="w3-cyan">{df2.shape[0]:,}>/span> rows and <span class="w3-cyan">{df2.shape[1]:,}</span> columns (sorted in descending order by date).', unsafe_allow_html=True)
        col2.dataframe(df2)
    click image to zoom!
    図5-1
    図5-1はVisula Studio Code(VSC)の画面とWebページの画面を同時に表示させています。 Pythonで記述したStreamlitのコードがWebページのどこに表示されるかがわかります。
    click image to zoom!
    図5-2
    図5-2はVisula Studio Code(VSC)の画面とWebページの画面を同時に表示させています。 Pythonで記述したStreamlitのコードがWebページのどこに表示されるかがわかります。
    click image to zoom!
    図5-3
    図5-3はVisula Studio Code(VSC)の画面とWebページの画面を同時に表示させています。 Pythonで記述したStreamlitのコードがWebページのどこに表示されるかがわかります。
  6. Webページの右端(Right Side)のデータを表示する

    行9-43ではツイートの「いいね」の件数上位n件の横棒グラフを作成して表示させています。
    #---------------------------------#
    # Right Side col3
    #col3.subheader('Right Side Column')
    
    ### 1) Horizontal bar chart (Tweet likes top N)
    col3.subheader(f'Top {tweet_topN} likes of the tweet: bar chart')
    
    if bol_run_analysis:
        df3 = df.copy()
        df3.sort_values('likes', ascending=False, inplace=True)
        df3 = df3.head(tweet_topN)
        df3.sort_values('likes', ascending=True, inplace=True)
        df3.drop(['id','len','tweets','source','retweets'], axis=1, inplace=True) 
        df3 = df3[['likes','date']]
        df3 = df3.set_index('date')
        col3.write('Data Dimension: ' + str(df3.shape[0]) + ' rows and ' + str(df3.shape[1]) + ' columns.')
    
        plt.rcParams['font.family'] = 'Meiryo' 
        plt.style.use('dark_background')     
        mpl.rcParams['axes.linewidth'] = 0.1 #set the value globally
    
        # tweet_topN: 10 - 50 (max 50)
        if tweet_topN <= 10:
            plt.figure(figsize=(6,6))   
        elif tweet_topN <= 20:
            plt.figure(figsize=(6,10))    
        elif tweet_topN <= 30:
            plt.figure(figsize=(6,14))     
        elif tweet_topN <= 40:
            plt.figure(figsize=(6,18))    
        else:
            plt.figure(figsize=(6,22))     
    
        df3['likes'].plot(kind='barh', color='red', edgecolor='none') 
         
        plt.legend()
        plt.grid(False)
        plt.ylabel('Date / Time')
        plt.title('Top 10 likes of the tweet')
        plt.legend(loc='lower right')
        plt.tight_layout()
    
        col3.pyplot(plt)
    click image to zoom!
    図6
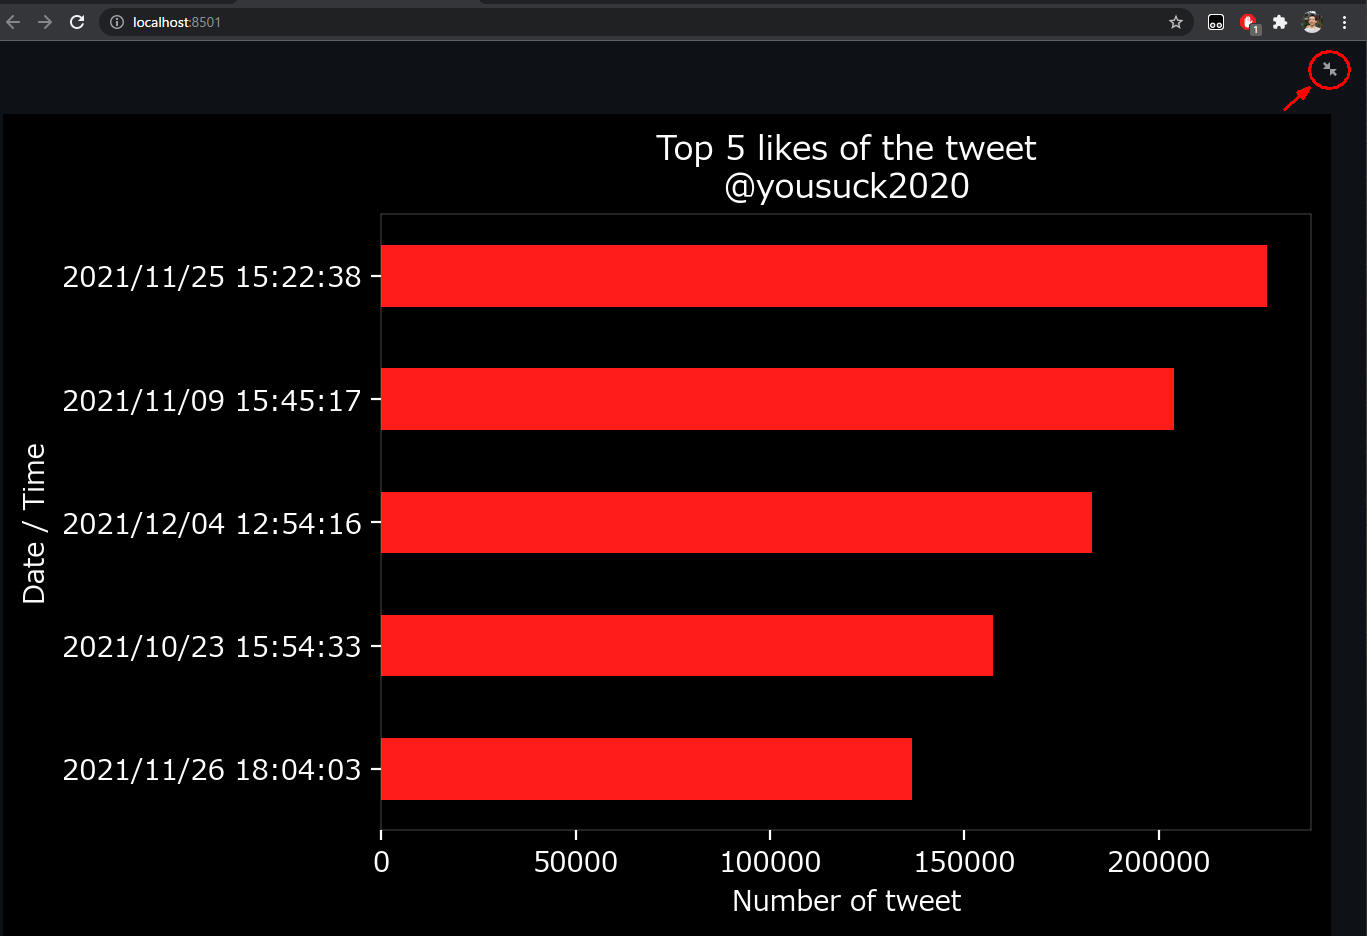
    図6はVisula Studio Code(VSC)の画面とWebページの画面を同時に表示させています。 Pythonで記述したStreamlitのコードがWebページのどこに表示されるかがわかります。 横棒グラフ上にマウスを移動すると右上に拡大「矢印」が表示されます。 この矢印をクリックすると横棒グラフが拡大されて表示されます。
  7. アプリの起動と操作方法の解説

    アプリはVisual Studio Code(VSC)の「TERMINAL」ウィンドウに行1をコピペして[Enter]で起動します。 アプリのファイル名はご自分のものと置換してください。 しばらくするとブラウザにアプリが表示されます。 アプリの操作手順については図7-1~図7-6の説明を参照してください。

    streamlit run "Article052_10_Streamlit Twitter likes analysis.py"
    click image to zoom!
    図7-1
    図7-1はアプリが起動してWebページに表示されたときの画面です。 左側のサイドバーにはデフォルトのオプションが表示されています。 「Select screen name」からはドロップダウンリストからTwitterの「ユーザー名(@UserNameの@を除く)」を選択します。

    「Select tweet count」のスライダーからは取得するツイートの件数を選択します。 「50-200」の範囲から選択できます。

    「Select likes top N」からツイートの「いいね」の件数を上位から何件表示するかを選択します。 たとえば、上位20件を表示させたいときは「20」を選択します。 「10-50」の範囲で選択できます。

    すべてのオプションを選択したら[START ANALYSIS!]ボタンをクリックします。 しばらくするとツイートの分析結果が表示されます。


    click image to zoom!
    図7-2
    [START ANALYSIS!]ボタンをクリックすると、 取得したツイートの件数、「いいね」の合計件数、「リツイート」の合計件数が表示されます。 また、「ツイート」のMaxの件数と「リツイート」のMaxの件数も表示されます。 最後にツイートの「いいね」の上位n件の内容が1位から順番に表示されます。


    click image to zoom!
    図7-3
    図7-3には分析結果としてPandasのDataFrameに格納されているデータをスタティックな表形式で表示しています。 この表にはツイートの「いいね」件数の降順に「日付」「ツイート」のデータが表示されます。 表の右上の拡大「矢印」をクリックすると表のみWebページに拡大して表示します。


    click image to zoom!
    図7-4
    図7-4には表がWebページに拡大されて表示されています。 表の右上の縮小「矢印」をクリックすると元の画面に戻ります。


    click image to zoom!
    図7-5
    図7-5ではPandasのDataFrameに格納されているデータをインタラクティブな表形式で表示しています。 この表にはツイートの「日付」の降順に「いいね」の件数、「リツイート」の件数、「ツイート」のデータが表示されます。 表に表示されているデータは表の「列見出し」をクリックして昇順・降順に並べ替えることができます。 表右上の拡大「矢印」をクリックするとWebページに表を拡大表示します。


    click image to zoom!
    図7-6
    図7-6には「ツイート」の列のデータを拡大して表示しています。 列のデータを拡大するにはマウスを列のセル上に移動します。 表右端のスクロールバーをドラッグすると表のデータを上下にスクロールすることができます。


  8. ここで解説したコードをまとめて掲載

    最後にここで解説したすべてのコードをまとめて掲載しましたので参考にしてください。
    
    # import the libralies
    from os import terminal_size
    import sys
    from datetime import datetime
    import time
    import json
    import re
    import pandas as pd
    import matplotlib as mpl
    import matplotlib.pyplot as plt
    import numpy as np
    import winsound
    from textblob import TextBlob       # pip install textblob
    from googletrans import Translator  # pip install googletrans==4.0.0-rc1   
    import tweepy
    import twitter_credentials
    from twitter_libraries import TwitterClient, TwitterAuthenticator, TwitterStreamer, TweetAnalyzer
    import warnings
    
    import smtplib
    from email.mime.multipart import MIMEMultipart
    from email.mime.text import MIMEText
    import gmail_config
    
    import streamlit as st
    import plotly.graph_objects as go
    
    warnings.simplefilter('ignore')
    
    #---------------------------------#
    # User Functions
    def utc2local(utc):
        epoch = time.mktime(utc.timetuple())
        offset = datetime.fromtimestamp(epoch) - datetime.utcfromtimestamp(epoch)
        return utc + offset
    
    #---------------------------------#
    # Main
    twitter_client = TwitterClient()
    tweet_analyzer = TweetAnalyzer()
    api = twitter_client.get_twitter_client_api()
    
    #---------------------------------#
    # Page layout
    ## Page expands to full width
    st.set_page_config(layout="wide")
    
    #---------------------------------#
    # load style sheet font-size: large, x-large, xx-large
    w3_css = """
    .w3-xlarge {font-size: x-large}
    .w3-green {color: forestgreen}
    .w3-red {color: red}
    .w3-pink {color: pink}
    .w3-orange {color: orange}
    .w3-cyan {color: cyan}
    """
    st.markdown(f'<style>{w3_css}</style>', unsafe_allow_html=True)
    
    #---------------------------------#
    # Title
    st.title('Twitter Likes Analysis APP')
    st.markdown("""
    インタラクティブなデータドリブン型のTwitter「いいね」分析ウェブアプリ! 
    """)
    
    #---------------------------------#
    # About
    expander_bar = st.expander('About')
    expander_bar.markdown("""
    このウェブアプリは特定のユーザーのツイートの「いいね」の件数を分析して表示します。
    """)
    
    #---------------------------------#
    # Page layout (continued)
    ## Divide page to 3 columns (col1 = sidebar, col2 and col3 = page contents)
    col1 = st.sidebar
    col2, col3 = st.columns((2,1))
    
    #---------------------------------#
    # Sidebar (Left Side)
    col1.header('Options')
    
    ### 1) Select the user:
    screen_name = col1.selectbox(
        'Select screen name',
        ('elonmusk', 'AkioKasai', 'takapon_jp', 'yousuck2020', 
        'kenichiromogi', 'job_type_ojisan', 'naka1031p', 'payequity1',
        'NoelRecords_App', 'satoai3', 'kanehiro'))
    
    col1.write('screen name:', '@'+screen_name)
    
    
    ### 2) Select tweet count: max 200 tweets
    tweet_count = col1.slider('Select tweet count', 50, 200, 50, 10)
    col1.write('tweet count:', tweet_count)
    
    ### 3) Select tweet top N:
    tweet_topN = col1.slider('Select likes top N', 10, 50, 10, 5)
    col1.write('likes top N:', tweet_topN)
    
    ### 4) Run analysis:
    bol_run_analysis = col1.button('START ANALYSIS !')    
    
    if bol_run_analysis:
        tweets = api.user_timeline(screen_name=screen_name, count=tweet_count)
        df = tweet_analyzer.tweets_to_data_frame(tweets)
        dataType = df.dtypes['date'] # pandas.core.dtypes.dtypes.DatetimeTZDtype
        #col1.write(dataType)
        if dataType == np.float64:
            col1.write(dataType)
            df['date'] = df['date'].apply(datetime.utcnow())
        else:   # datetime64[ns, UTC]        
            df['date'] = df['date'].apply(utc2local)
            df['date'] = df['date'].dt.strftime('%Y/%m/%d %H:%M:%S')
    
    #---------------------------------#
    # Main col2
    #col2.subheader('Main Column')
    
    # df
    # Data columns (total 7 columns):
    #  #   Column    Non-Null Count  Dtype              
    # ---  ------    --------------  -----              
    #  0   tweets    200 non-null    object             
    #  1   id        200 non-null    int64              
    #  2   len       200 non-null    int32              
    #  3   date      200 non-null    datetime64[ns, UTC]
    #  4   source    200 non-null    object             
    #  5   likes     200 non-null    int32              
    #  6   retweets  200 non-null    int32              
    # dtypes: datetime64[ns, UTC](1), int32(3), int64(1), object(2)
    
    ### 0) Display screen name 
    col2.header(f'Tweet Analysis for @{screen_name}')
    
    if bol_run_analysis:
        total_likes = df['likes'].sum()
        total_retweets = df['retweets'].sum()
    
        max_likes = np.max(df['likes'])
        max_retweets = np.max(df['retweets'])
    
        col2.markdown(f'tweet count = {tweet_count:,}, total likes = {total_likes:,}, total retweets = {total_retweets:,}',
            unsafe_allow_html=True)
        #col2.write(f'tweet count = {tweet_count:,}, total likes = {total_likes:,}, total retweets = {total_retweets:,}')
     
        # Get the number of likes for the most liked tweet:
        col2.markdown(f'max(likes) = {max_likes:,}', unsafe_allow_html=True)
        #col2.write(f'max(likes) = {max_likes:,}')
    
        # Get the number of retweets for the most retweeted tweet:
        col2.markdown(f'max(retweets) = {max_retweets:,}', unsafe_allow_html=True)
        #col2.write(f'max(retweets) = {max_retweets:,}')  
    
        col2.markdown('''---''')    # horizontal line HR tag
    
        # sort likes in descending order
        df.sort_values('likes', ascending=False, inplace=True)
        for i in range(tweet_topN):
            str_date = df.iloc[i, 3]    # date
            str_tweet = df.iloc[i, 0]   # tweets
            str_likes = df.iloc[i, 5]   # likes
            row = f':sunglasses:{i+1}: {str_likes},  {str_date}, {str_tweet}'
            col2.markdown(row, unsafe_allow_html=True)
            #col2.write(row)
            # col2.markdown(f'max(likes) = {max_likes:,}', unsafe_allow_html=True)
    
    #  #   Column    Non-Null Count  Dtype                 
    # ---  ------    --------------  -----              
    #  0   tweets    200 non-null    object             
    #  1   id        200 non-null    int64               
    #  2   len       200 non-null    int32                
    #  3   date      200 non-null    datetime64[ns, UTC] 
    #  4   source    200 non-null    object              
    #  5   likes     200 non-null    int32              
    #  6   retweets  200 non-null    int32  
    
    col2.markdown('''---''')
    
    ### 1) Top N Tweets : sorted by likes
    col2.subheader(f'DataFrame 1: Top {tweet_topN} likes of the tweet')
    
    if bol_run_analysis:
        df1 = df.copy()
        df1.sort_values('likes', ascending=False, inplace=True)
        df1.reset_index(inplace=True)
        df1.drop(['id','len','source','retweets'], axis=1, inplace=True) 
        df1 = df1[['likes','date','tweets']]
        #df1.reset_index(drop=True, inplace=True)    # cannot remove the default index
        #df1.style.hide_index()
        df1.set_index('likes', inplace=True)
        df1 = df1.head(tweet_topN)  # 10 - 50
        col2.markdown(f'Data Dimension: {df1.shape[0]:,} rows and {df1.shape[1]:,} columns (sorted in descending order by likes).', unsafe_allow_html=True)
        #col2.write('Data Dimension: ' + str(df1.shape[0]) + ' rows and ' + str(df1.shape[1]) + ' columns. (sorted in descending order by likes)')
        #col2.dataframe(df1)    
        col2.table(df1)
     
    #  #   Column    Non-Null Count  Dtype              
    # ---  ------    --------------  -----              
    #  0   tweets    200 non-null    object             
    #  1   id        200 non-null    int64  => Remove             
    #  2   len       200 non-null    int32  => Remove              
    #  3   date      200 non-null    datetime64[ns, UTC] 
    #  4   source    200 non-null    object => Remove             
    #  5   likes     200 non-null    int32              
    #  6   retweets  200 non-null    int32  => Remove
    
    col2.markdown('''---''')
    
    ### 2 Tweets DataFrame
    col2.subheader('DataFrame 2: Tweet data view')
    
    if bol_run_analysis:
        df2 = df.copy() # 50 - 200 (max 200)
        df2['date_local'] = pd.to_datetime(df2['date'], format='%Y/%m/%d %H:%M:%S') # Convert string to datetime format    
        df2.sort_values('date_local', ascending=False, inplace=True)
        df2.drop(['id', 'len', 'source', 'date_local'], axis=1, inplace=True) 
        df2 = df2[['date', 'likes', 'retweets', 'tweets']]
        #df2.reset_index(drop=True, inplace=True)    # cannot remove the default index
        df2.set_index('date', inplace=True)
        col2.markdown(f'Data Dimension: {df2.shape[0]:,} rows and {df2.shape[1]:,} columns (sorted in descending order by date).', unsafe_allow_html=True)
        #col2.write('Data Dimension: ' + str(df2.shape[0]) + ' rows and ' + str(df2.shape[1]) + ' columns. (sorted in descending order by date)')
        col2.dataframe(df2)
    
    #  #   Column    Non-Null Count  Dtype              
    # ---  ------    --------------  -----              
    #  0   tweets    200 non-null    object             
    #  1   id        200 non-null    int64  => Remove             
    #  2   len       200 non-null    int32  => Remove              
    #  3   date      200 non-null    datetime64[ns, UTC] 
    #  4   source    200 non-null    object              
    #  5   likes     200 non-null    int32              
    #  6   retweets  200 non-null    int32  => Remove    
    
    #---------------------------------#
    # Right Side col3
    #col3.subheader('Right Side Column')
    
    ### 1) Horizontal bar chart (Tweet likes top 10)
    col3.subheader(f'Top {tweet_topN} likes of the tweet: bar chart')
    
    if bol_run_analysis:
        df3 = df.copy()
        df3.sort_values('likes', ascending=False, inplace=True)
        df3 = df3.head(tweet_topN)
        df3.sort_values('likes', ascending=True, inplace=True)
        df3.drop(['id','len','tweets','source','retweets'], axis=1, inplace=True) 
        #df1.drop(['id','len','date','source','retweets'], axis=1, inplace=True) 
        df3 = df3[['likes','date']]
        df3 = df3.set_index('date')
        col3.write('Data Dimension: ' + str(df3.shape[0]) + ' rows and ' + str(df3.shape[1]) + ' columns.')
    
        #  #   Column    Non-Null Count  Dtype              
        # ---  ------    --------------  -----              
        #  0   tweets    200 non-null    object => Remoce            
        #  1   id        200 non-null    int64  => Remove             
        #  2   len       200 non-null    int32  => Remove              
        #  3   date      200 non-null    datetime64[ns, UTC] 
        #  4   source    200 non-null    object => Remove             
        #  5   likes     200 non-null    int32              
        #  6   retweets  200 non-null    int32  => Remove 
    
        plt.rcParams['font.family'] = 'Meiryo' 
        plt.style.use('dark_background')     
        #plt.style.use('fivethirtyeight')    # 'dark_background' or  'fivethirtyeight'   
        mpl.rcParams['axes.linewidth'] = 0.1 #set the value globally
    
        # tweet_topN: 10 - 50 (max 50)
        if tweet_topN <= 10:
            plt.figure(figsize=(6,6))  # 6, 6   width=6.4, height=4.8       
        elif tweet_topN <= 20:
            plt.figure(figsize=(6,10))  # 6, 8   width=6.4, height=4.8    
        elif tweet_topN <= 30:
            plt.figure(figsize=(6,14))  # 6, 8   width=6.4, height=4.8    
        elif tweet_topN <= 40:
            plt.figure(figsize=(6,18))  # 6, 8   width=6.4, height=4.8    
        else:
            plt.figure(figsize=(6,22))  # 6, 8   width=6.4, height=4.8    
    
        df3['likes'].plot(kind='barh', color='red', edgecolor='none') 
    
        #plt.axis('off')
        plt.legend()
        plt.grid(False)
        plt.ylabel('Date / Time')
        plt.title('Top 10 likes of the tweet')
        plt.legend(loc='lower right')
        plt.tight_layout()
    
        col3.pyplot(plt)
    
    
    # streamlit run "Article052_10_Streamlit Twitter likes analysis.py"

ツイート(Twitter)の「いいね」分析をWebページに表示する V2.00

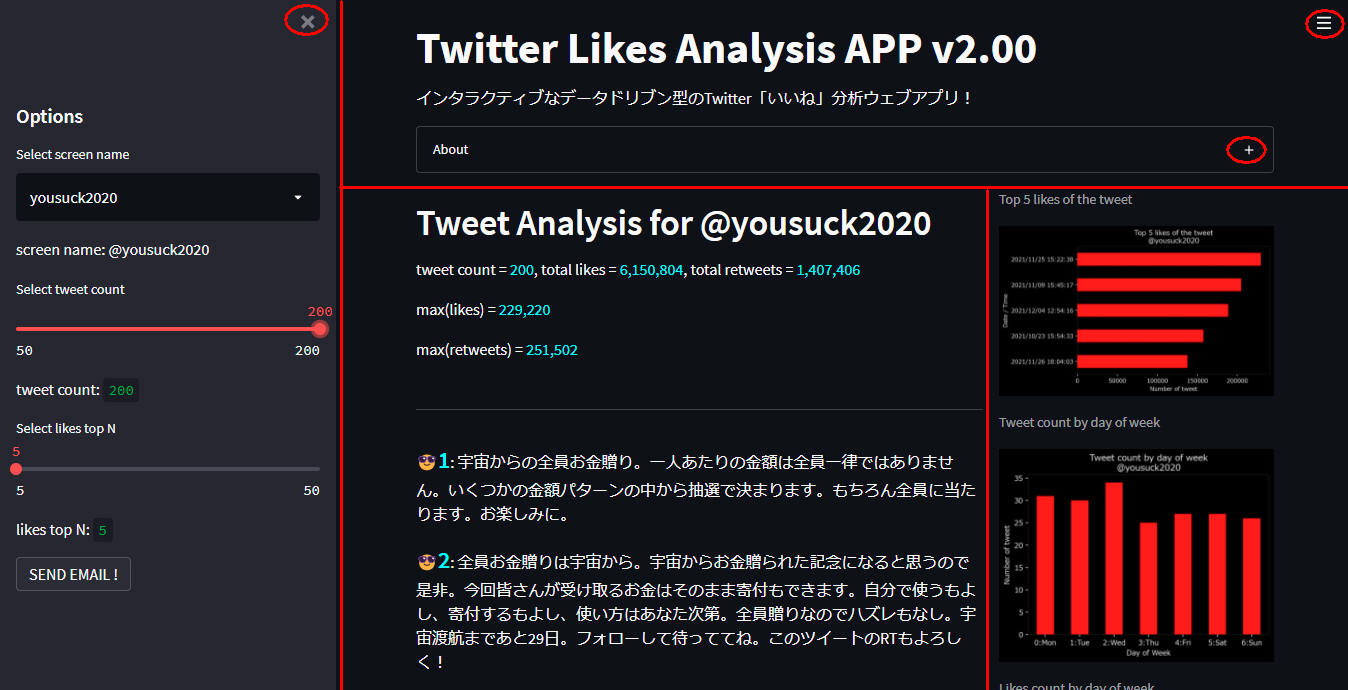
  1. V2.00で追加した主な機能概要

    • Webページから[START ANALYSIS!]ボタンを削除しました。V2.00ではツイートの分析結果が自動的に表示されます。
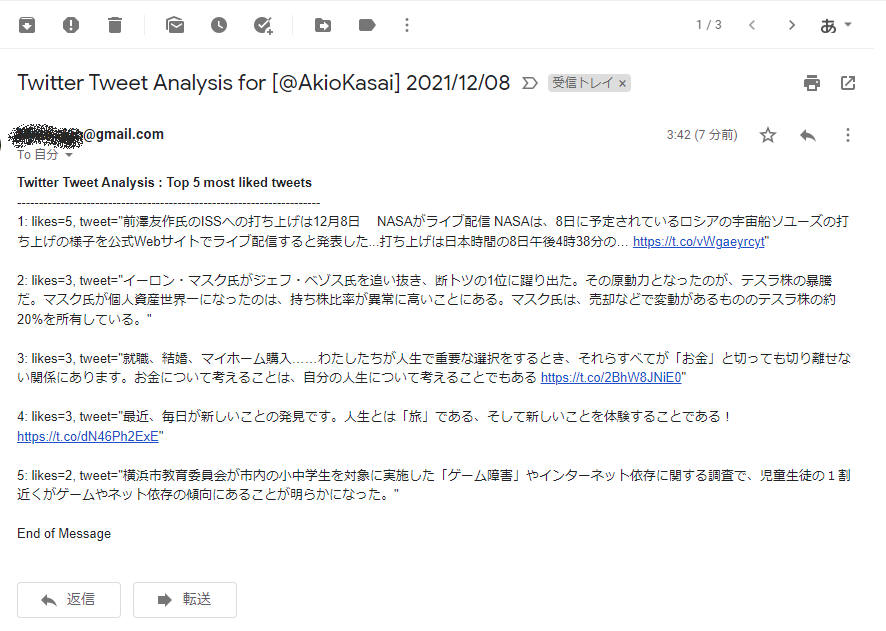
    • Webページに[SEND EMAIL!]ボタンを追加しました。このボタンをクリックするとツイート「いいね」の上位n件のデータがGmailに送信されます。
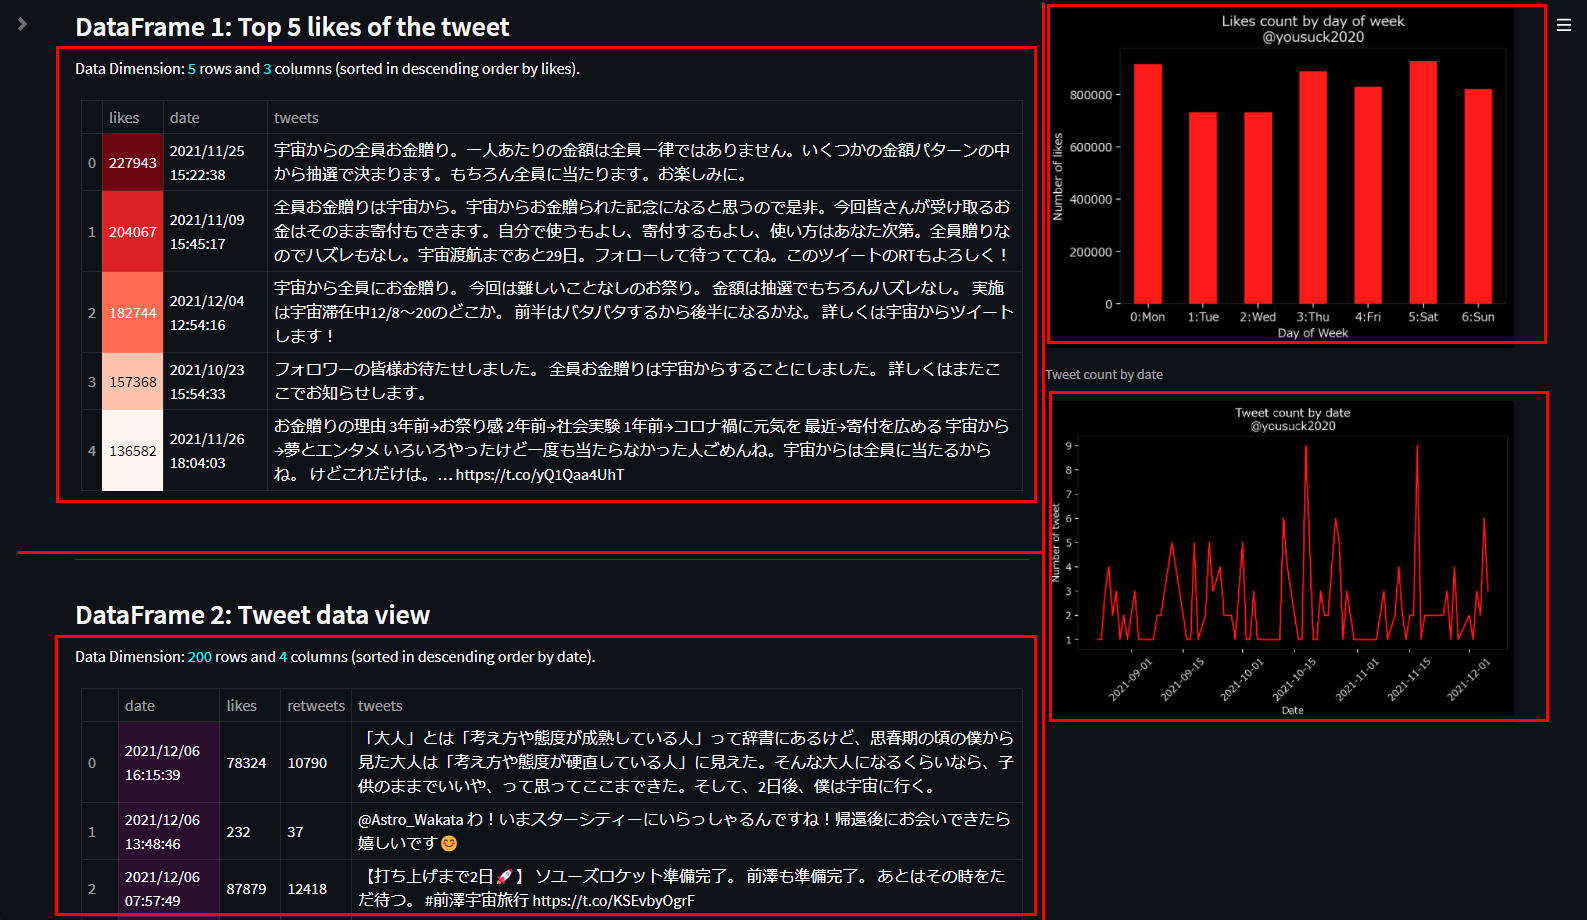
    • DataFrame1のDataFrameにスタイルを追加して列「likes」にグラデーションを適用しました。
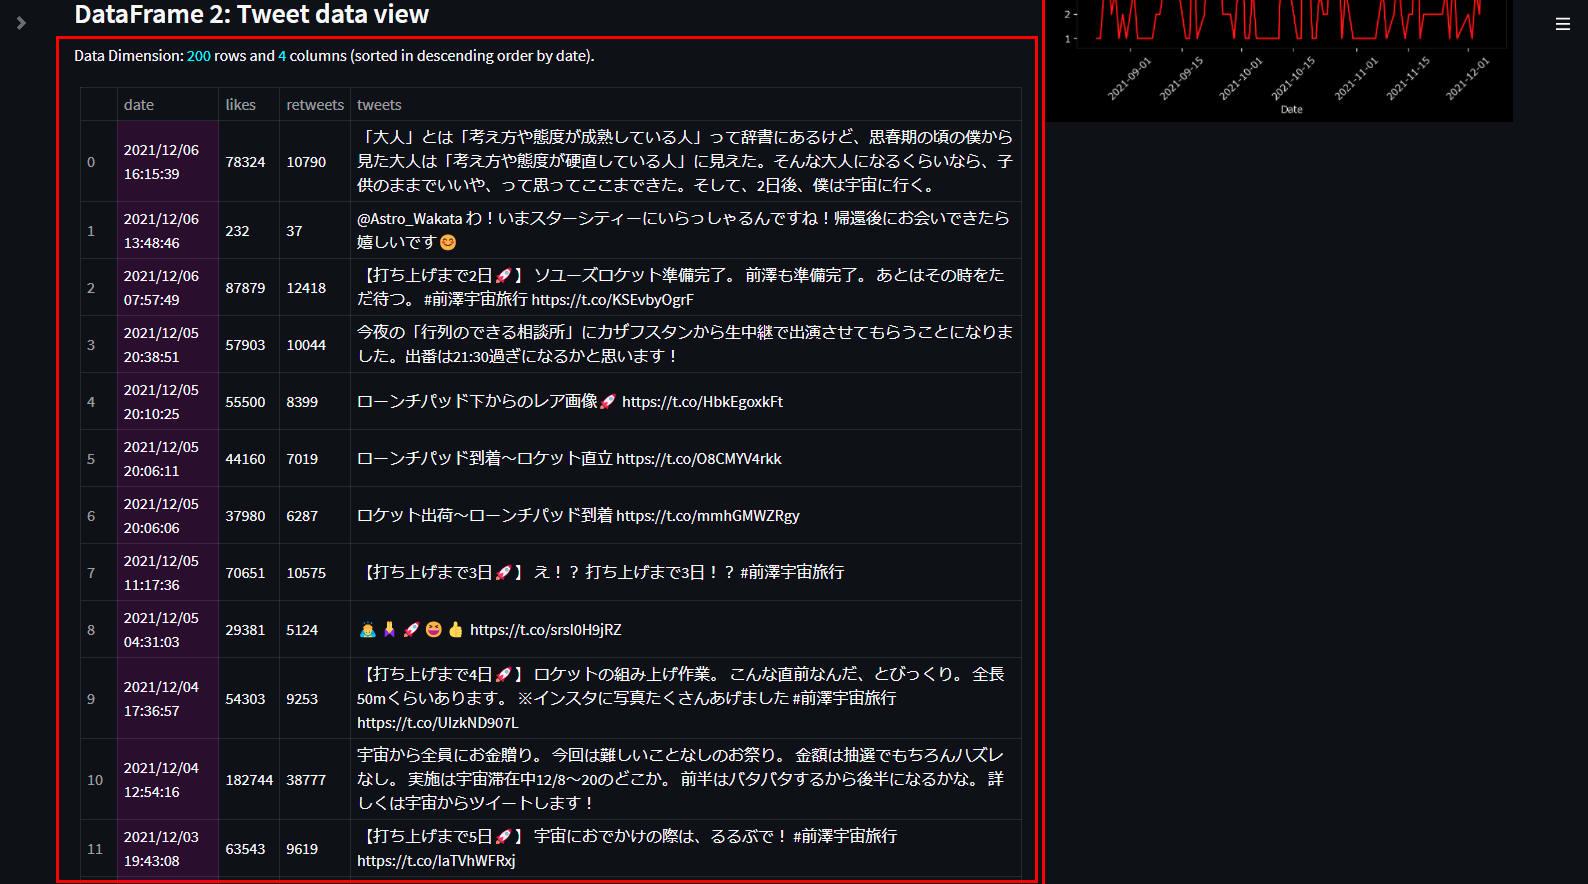
    • DataFrame2をダイナミック(動的)な表からスタティック(静的)な表に変更しました。これでツイートの内容がすべて表示されます。
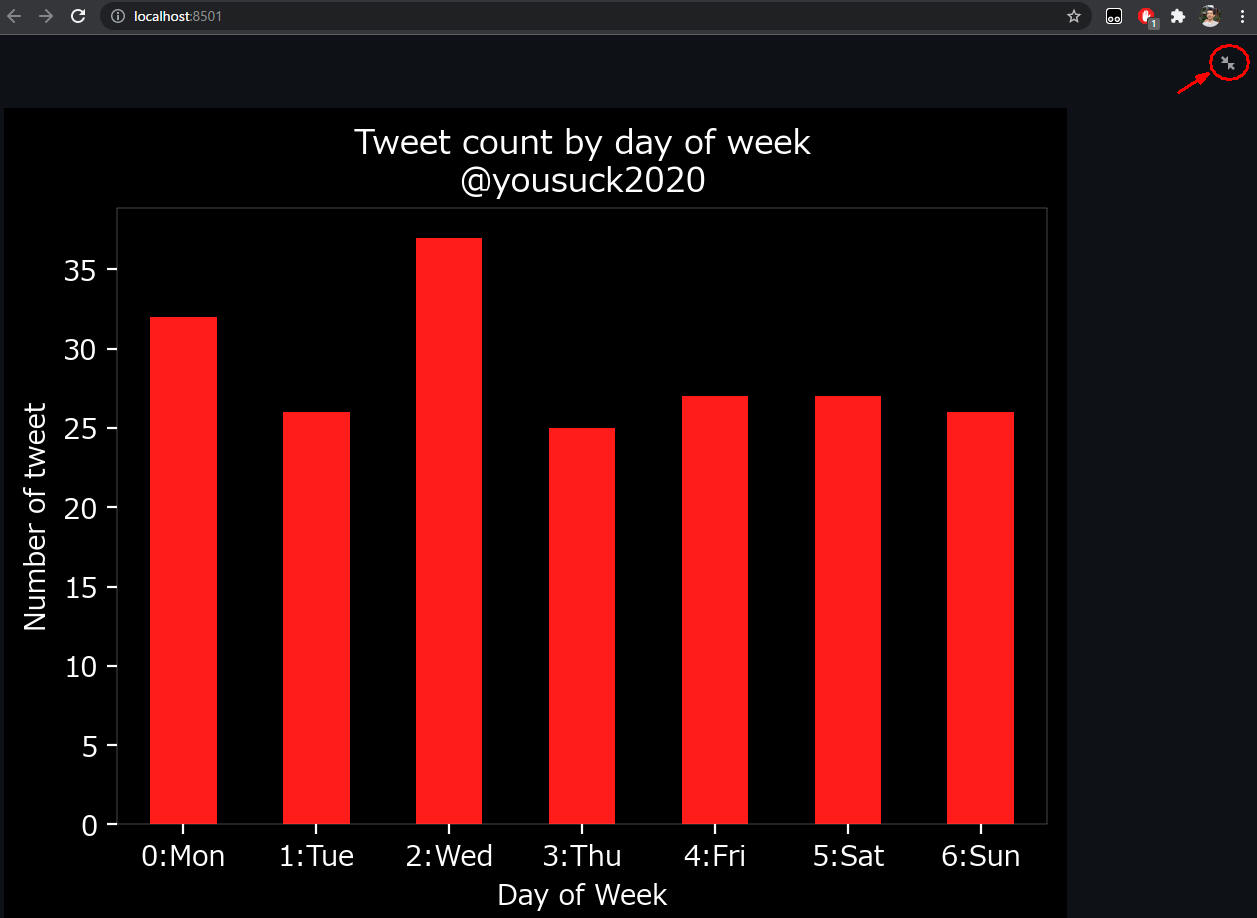
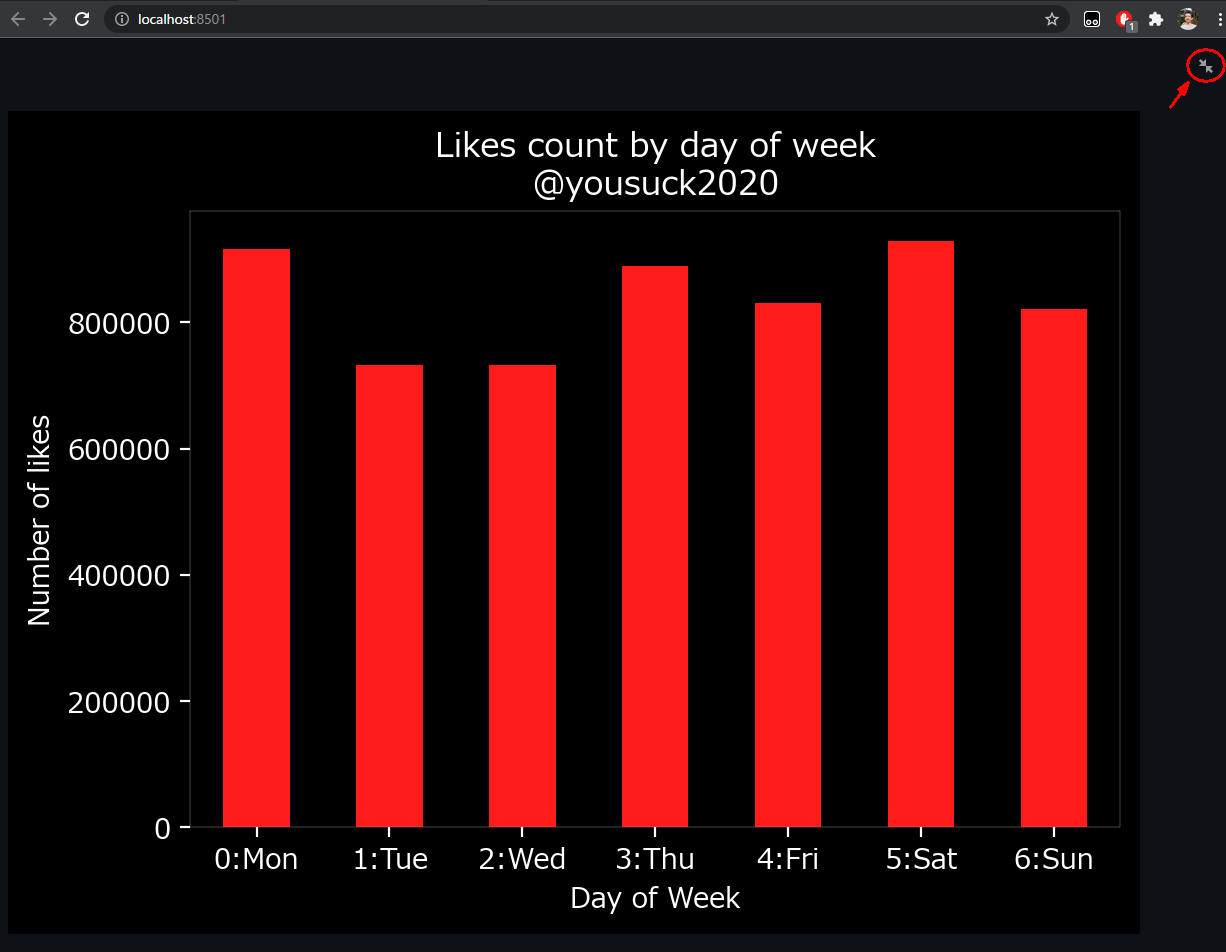
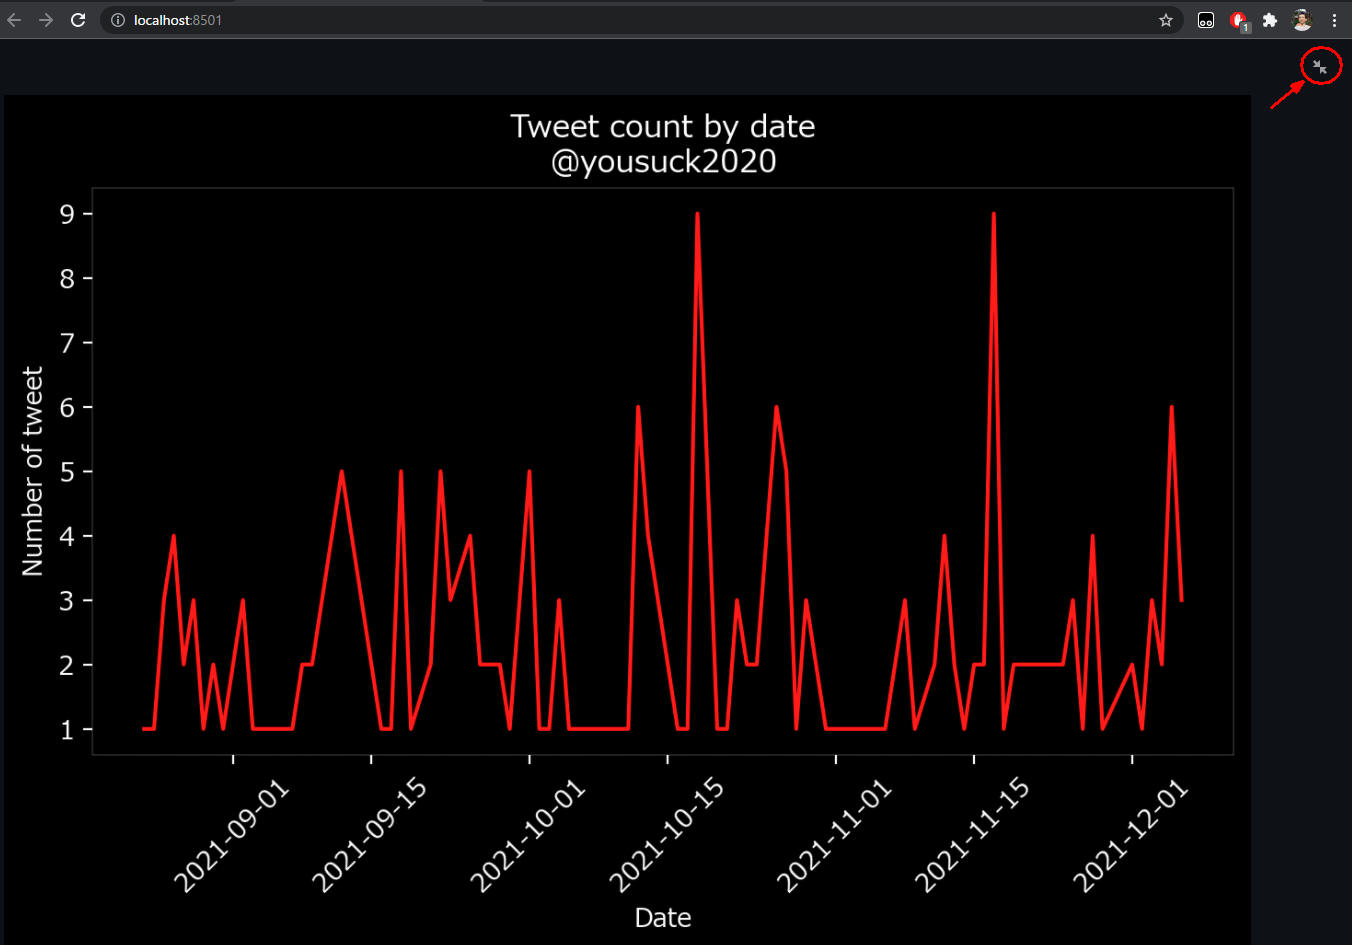
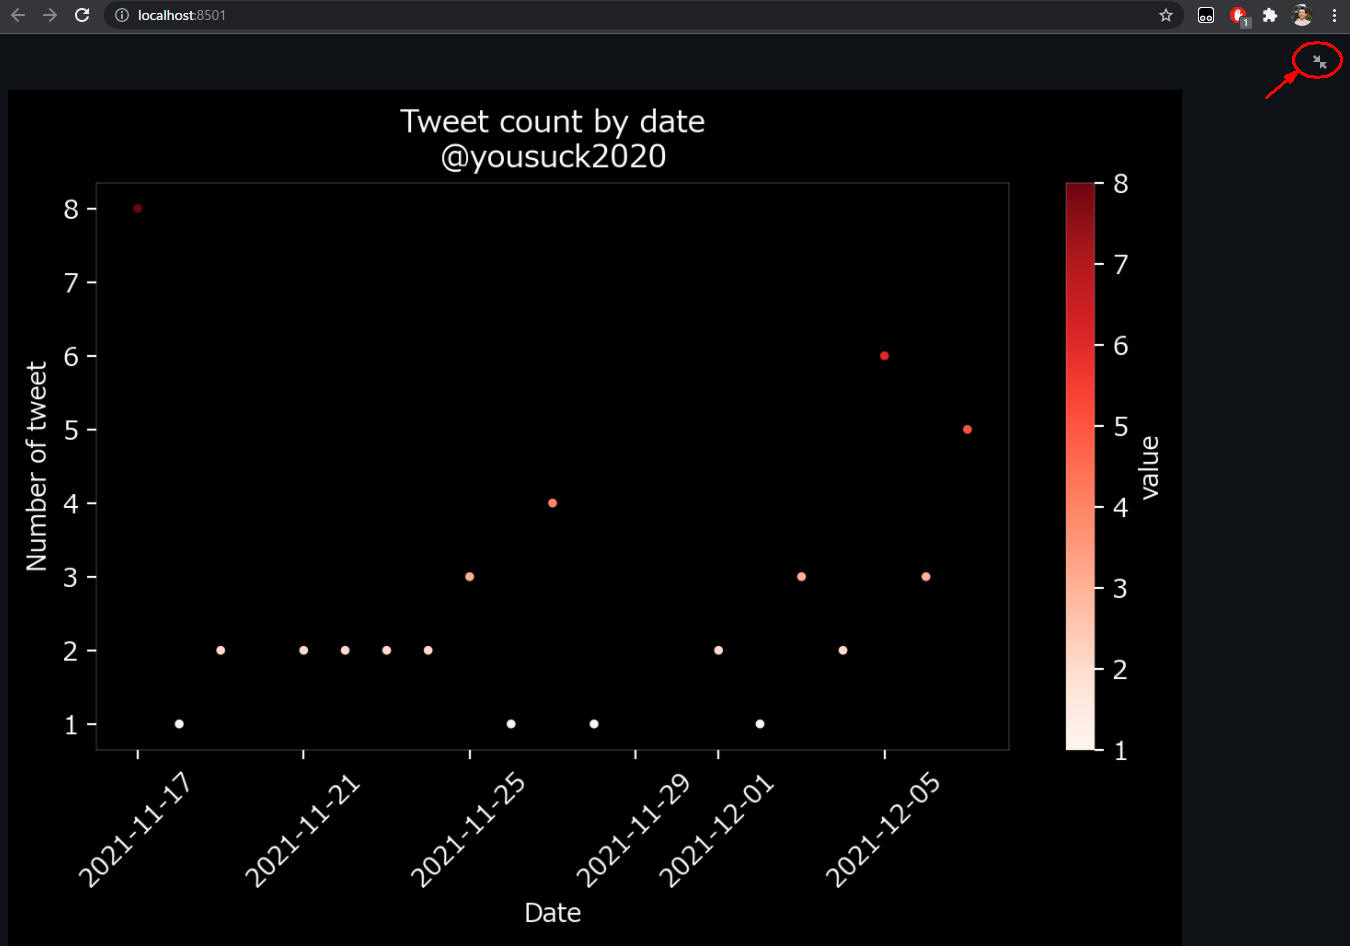
    • Webページに4個のグラフを追加しました。

    click image to zoom!
    Streamlit v2[1]
    click image to zoom!
    Streamlit v2[2]
    click image to zoom!
    Streamlit v2[3]
    click image to zoom!
    Streamlit v2[4]
    click image to zoom!
    Streamlit v2[5]
    click image to zoom!
    Streamlit v2[6]
    click image to zoom!
    Streamlit v2[7]
    click image to zoom!
    Streamlit v2[8]
    click image to zoom!
    Streamlit v2[9]


    以下にV2.00のソースコードを一括して掲載していますので参考にしてください。

    # Article052_20_Streamlit Twitter likes analysis.py
    # streamlit run "Article052_20_Streamlit Twitter likes analysis.py"
    
    # import the libralies
    import functools
    from os import terminal_size
    import sys
    from datetime import datetime
    import time
    import json
    import re
    import pandas as pd
    import matplotlib as mpl
    import matplotlib.pyplot as plt
    import numpy as np
    import winsound
    from textblob import TextBlob       # pip install textblob
    from googletrans import Translator  # pip install googletrans==4.0.0-rc1   
    import tweepy
    import twitter_credentials
    from twitter_libraries import TwitterClient, TwitterAuthenticator, TwitterStreamer, TweetAnalyzer
    import warnings
    
    import smtplib
    from email.mime.multipart import MIMEMultipart
    from email.mime.text import MIMEText
    import gmail_config
    
    import streamlit as st
    import plotly.graph_objects as go
    
    warnings.simplefilter('ignore')
    
    #---------------------------------#
    # User Functions
    def utc2local(utc):
        epoch = time.mktime(utc.timetuple())
        offset = datetime.fromtimestamp(epoch) - datetime.utcfromtimestamp(epoch)
        return utc + offset
    
    #---------------------------------#
    # Main
    twitter_client = TwitterClient()
    tweet_analyzer = TweetAnalyzer()
    api = twitter_client.get_twitter_client_api()
    
    #---------------------------------#
    # Page layout
    ## Page expands to full width
    st.set_page_config(layout="wide")
    
    #---------------------------------#
    # load style sheet font-size: large, x-large, xx-large
    w3_css = """
    .w3-xlarge {font-size: x-large}
    .w3-green {color: forestgreen}
    .w3-red {color: red}
    .w3-pink {color: pink}
    .w3-orange {color: orange}
    .w3-cyan {color: cyan}
    """
    st.markdown(f'<style>{w3_css}</style>', unsafe_allow_html=True)
    
    BG_COLOR = 'background-color: rgba(255, 0, 255, 0.1)'   # 'background-color: green' 
    # rgba(255, 0, 0, 0.2); 
    # rgba(255, 0, 0, 0.4);
    # rgba(255, 0, 0, 0.6);
    # rgba(255, 0, 0, 0.8);
    # {background-color: rgba(255, 0, 0, 0.3);}  /* red with opacity */
    # {background-color: rgba(0, 255, 0, 0.3);}  /* green with opacity */
    # {background-color: rgba(0, 0, 255, 0.3);}  /* blue with opacity */
    
    #---------------------------------#
    # Title
    st.title('Twitter Likes Analysis APP v2.00')
    st.markdown("""
    インタラクティブなデータドリブン型のTwitter「いいね」分析ウェブアプリ! 
    """)
    
    #---------------------------------#
    # About
    expander_bar = st.expander('About')
    expander_bar.markdown("""
    このウェブアプリは特定のユーザーのツイートの「いいね」の件数を分析して表示します。
    """)
    
    #---------------------------------#
    # Page layout (continued)
    ## Divide page to 3 columns (col1 = sidebar, col2 and col3 = page contents)
    col1 = st.sidebar
    col2, col3 = st.columns((2,1))
    
    #---------------------------------#
    # Sidebar (Left Side)
    col1.header('Options')
    
    ### 1) Select the user:
    screen_name = col1.selectbox(
        'Select screen name',
        ('AkioKasai', 'elonmusk', 'takapon_jp', 'yousuck2020', 
        'kenichiromogi', 'job_type_ojisan', 'naka1031p', 'payequity1',
        'NoelRecords_App', 'satoai3', 'kurasikaiteki3', 'kanehiro'))
    
    col1.write('screen name:', '@'+screen_name)
    
    
    ### 2) Select tweet count: max 200 tweets
    tweet_count = col1.slider('Select tweet count', 50, 200, 50, 10)
    col1.write('tweet count:', tweet_count)
    
    ### 3) Select tweet top N:
    tweet_topN = col1.slider('Select likes top N', 5, 50, 10, 5)
    col1.write('likes top N:', tweet_topN)
    
    ### 4) Run analysis:
    bol_run_analysis = True # col1.button('START ANALYSIS !')    
    
    if bol_run_analysis:
        tweets = api.user_timeline(screen_name=screen_name, count=tweet_count)
        df = tweet_analyzer.tweets_to_data_frame(tweets)
        dataType = df.dtypes['date'] # pandas.core.dtypes.dtypes.DatetimeTZDtype
        #col1.write(dataType)
        if dataType == np.float64:
            col1.write('An unexpected error has occurred. Please try again.', dataType)
            bol_run_analysis = False
    
    # No error?
    if bol_run_analysis:
        df['date_local'] = df['date'].apply(utc2local)
        df['date_local_string'] = df['date_local'].dt.strftime('%Y/%m/%d %H:%M:%S') # ABEND
    
    ### 5) Send mail: 
    
    # No error ?
    if bol_run_analysis:
        bol_send_email = col1.button('SEND EMAIL !')    
    
        if bol_send_email:
            df_0 = df.copy()
            df_0.sort_values('likes', ascending=False, inplace=True)
            df_0.reset_index(inplace=True)    
    
            likes = df_0.loc[:,'likes'].values
            tweets = df_0.loc[:,'tweets'].values
    
            # email content placeholder
            content = (f'<b>Twitter Tweet Analysis : Top {tweet_topN} most liked tweets</b>\n' + '<br />' + '-'*70 + '<br />')
            cnt = tweet_topN
            for i in range(cnt):
                content += f'{i+1}: likes={likes[0:cnt][i]}, tweet="{tweets[0:cnt][i]}" <br /><br />'
    
            content +=('End of Message') 
    
            # send the email
            col1.write('Send the Email...')
            str_now = datetime.now().strftime('%Y/%m/%d')
    
            # update your email details
            SERVER = gmail_config.GMAIL_SERVER  
            PORT = gmail_config.GMAIL_PORT      
            FROM = gmail_config.GMAIL_FROM      
            TO = gmail_config.GMAIL_TO          
            PASS = gmail_config.GMAIL_PASS      
    
            msg = MIMEMultipart()
            msg['Subject'] = f'Twitter Tweet Analysis for [@{screen_name}] {str_now}'
            msg['From'] = FROM
            msg['To'] = TO
    
            msg.attach(MIMEText(content, 'html'))
    
            col1.write('Initiating Server...')
    
            server = smtplib.SMTP(SERVER, PORT)
            server.set_debuglevel(0)    # 0-suppress debug info, 1-display debug info
            server.ehlo()
            server.starttls()
            server.login(FROM, PASS)
            server.sendmail(FROM, TO, msg.as_string())
    
            col1.write('Email Sent...')
    
            server.quit()        
    
    #---------------------------------#
    # Main col2
    #col2.subheader('Main Column')
    
    # df
    # Data columns (total 7 columns):
    #  #   Column    Non-Null Count  Dtype              
    # ---  ------    --------------  -----              
    #  0   tweets    200 non-null    object             
    #  1   id        200 non-null    int64              
    #  2   len       200 non-null    int32              
    #  3   date      200 non-null    datetime64[ns, UTC]
    #  4   source    200 non-null    object             
    #  5   likes     200 non-null    int32              
    #  6   retweets  200 non-null    int32     
    #  7   date_local                datetime64[ns, UTC] ★ added
    #  8   date_local_string         object ★ added       
    # dtypes: datetime64[ns, UTC](1), int32(3), int64(1), object(2)
    
    ### 0) Display screen name 
    col2.header(f'Tweet Analysis for @{screen_name}')
    
    if bol_run_analysis:
        total_likes = df['likes'].sum()
        total_retweets = df['retweets'].sum()
    
        max_likes = np.max(df['likes'])
        max_retweets = np.max(df['retweets'])
    
        col2.markdown(f'tweet count = <span class="w3-cyan">{tweet_count:,}</span>, total likes = <span class="w3-cyan">{total_likes:,}</span>, total retweets = <span class="w3-cyan">{total_retweets:,}</span>',
            unsafe_allow_html=True)
        #col2.write(f'tweet count = {tweet_count:,}, total likes = {total_likes:,}, total retweets = {total_retweets:,}')
     
        # Get the number of likes for the most liked tweet:
        col2.markdown(f'max(likes) = <span class="w3-cyan">{max_likes:,}</span>', unsafe_allow_html=True)
        #col2.write(f'max(likes) = {max_likes:,}')
    
        # Get the number of retweets for the most retweeted tweet:
        col2.markdown(f'max(retweets) = <span class="w3-cyan">{max_retweets:,}</span>', unsafe_allow_html=True)
        #col2.write(f'max(retweets) = {max_retweets:,}')  
    
        col2.markdown('''---''')    # horizontal line HR tag
    
        # sort likes in descending order
        df.sort_values('likes', ascending=False, inplace=True)
        rows = min(tweet_topN, df.shape[0])
        for i in range(rows):
            #str_date = df.iloc[i, 8]    # date_local_string
            str_tweet = df.iloc[i, 0]    # tweets
            #str_likes = df.iloc[i, 5]   # likes
            row = f':sunglasses:<b class="w3-cyan w3-xlarge">{i+1}</b>: {str_tweet}'      
            col2.markdown(row, unsafe_allow_html=True)    
    
    
    col2.markdown('''---''')
    
    ### 1) Top N Tweets : sorted by likes
    col2.subheader(f'DataFrame 1: Top {tweet_topN} likes of the tweet')
    
    if bol_run_analysis:
        df_1 = df.copy()
        df_1.sort_values('likes', ascending=False, inplace=True)
        df_1.reset_index(inplace=True)
        df_1.drop(['id','len','date','source','retweets','date_local'], axis=1, inplace=True) 
        # reorder columns 
        df_1 = df_1[['likes','date_local_string','tweets']]
        # rename column names
        df_1.columns = ['likes','date','tweets']
        df_1.reset_index(drop=True, inplace=True)        
        df_1 = df_1.head(tweet_topN)  # 5 - 50
        col2.markdown(f'Data Dimension: <span class="w3-cyan">{df_1.shape[0]:,}</span> rows and <span class="w3-cyan">{df_1.shape[1]:,}</span> columns (sorted in descending order by likes).', unsafe_allow_html=True)
        col2.table(df_1.style.background_gradient(subset='likes', cmap='Reds'))
    
        #  0   tweets    200 non-null    object ★            
        #  1   id        200 non-null    int64 => remove             
        #  2   len       200 non-null    int32 => remove             
        #  3   date      200 non-null    datetime64[ns, UTC] => remove
        #  4   source    200 non-null    object => remove            
        #  5   likes     200 non-null    int32 ★             
        #  6   retweets  200 non-null    int32 => remove    
        #  7   date_local                datetime64[ns, UTC] => remove
        #  8   date_local_string         object ★ => rename date     
    
    col2.markdown('''---''')
    
    ### 2 Tweets DataFrame
    col2.subheader('DataFrame 2: Tweet data view')
    
    if bol_run_analysis:
        df_2 = df.copy() # 50 - 200 (max 200)   
        df_2.sort_values('date_local', ascending=False, inplace=True)
        df_2.drop(['id', 'len', 'date','source', 'date_local'], axis=1, inplace=True) 
        # reorder columns 
        df_2 = df_2[['date_local_string', 'likes', 'retweets', 'tweets']]
        # rename column names
        df_2.columns = ['date','likes','retweets','tweets']    
        df_2.reset_index(drop=True, inplace=True)   
        col2.markdown(f'Data Dimension: <span class="w3-cyan">{df_2.shape[0]:,}</span> rows and <span class="w3-cyan">{df_2.shape[1]:,}</span> columns (sorted in descending order by date).', unsafe_allow_html=True)
        col2.table(df_2.style.applymap(lambda x: BG_COLOR, subset='date'))
    
        #  0   tweets    200 non-null    object ★            
        #  1   id        200 non-null    int64 => remove             
        #  2   len       200 non-null    int32 => remove             
        #  3   date      200 non-null    datetime64[ns, UTC] => remove
        #  4   source    200 non-null    object => remove            
        #  5   likes     200 non-null    int32 ★             
        #  6   retweets  200 non-null    int32 ★    
        #  7   date_local                datetime64[ns, UTC] => remove
        #  8   date_local_string         object ★ => rename date   
    
    #---------------------------------#
    # Right Side col3
    #col3.subheader('Right Side Column')
    
    ### 3-1) Plot 'Top {tweet_topN} likes of the tweet'
    col3.caption(f'Top {tweet_topN} likes of the tweet')
    
    if bol_run_analysis:
        df1 = df.copy()
        df1.sort_values('likes', ascending=False, inplace=True)
        df1 = df1.head(tweet_topN)
        df1.sort_values('likes', ascending=True, inplace=True)
        df1.drop(['tweets','id','len','date','source','retweets','date_local'], axis=1, inplace=True) 
        # reorder columns
        df1 = df1[['likes','date_local_string']]
        # rename column names
        df1.columns = ['likes','date']     
        df1 = df1.set_index('date')
    
        #  0   tweets    200 non-null    object => remove             
        #  1   id        200 non-null    int64 => remove             
        #  2   len       200 non-null    int32 => remove             
        #  3   date      200 non-null    datetime64[ns, UTC] => remove
        #  4   source    200 non-null    object => remove            
        #  5   likes     200 non-null    int32 ★             
        #  6   retweets  200 non-null    int32 => remove    
        #  7   date_local                datetime64[ns, UTC] => remove 
        #  8   date_local_string         object ★ => rename date  
    
        plt.rcParams['font.family'] = 'Meiryo' 
        plt.style.use('dark_background')     
        mpl.rcParams['axes.linewidth'] = 0.1 #set the value globally
    
        fig1, ax1 = plt.subplots()
    
        # tweet_topN: 5 - 50 (max 50)
        if tweet_topN <= 5:
            plt.figure(figsize=(6,4))  # 6, 6   width=6.4, height=4.8     
        elif tweet_topN <= 10:
            plt.figure(figsize=(6,6))  # 6, 6   width=6.4, height=4.8       
        elif tweet_topN <= 20:
            plt.figure(figsize=(6,10))  # 6, 8   width=6.4, height=4.8    
        elif tweet_topN <= 30:
            plt.figure(figsize=(6,14))  # 6, 8   width=6.4, height=4.8    
        elif tweet_topN <= 40:
            plt.figure(figsize=(6,18))  # 6, 8   width=6.4, height=4.8    
        else:
            plt.figure(figsize=(6,22))  # 6, 8   width=6.4, height=4.8    
    
        df1['likes'].plot(ax=ax1, kind='barh', 
            figsize=(6, 4), color='r', edgecolor='none',
            title=f'Top {tweet_topN} likes of the tweet\n@{screen_name}')    
    
        # set labels for both axes
        ax1.set(ylabel='Date / Time', xlabel='Number of tweet')
    
        col3.pyplot(fig1)
    
    ### 3-2) Plot 'Tweet count by day of week '
    col3.caption('Tweet count by day of week')
    
    if bol_run_analysis:
        df2 = df.copy()
        dw_mapping={
            0: '0:Mon', 
            1: '1:Tue', 
            2: '2:Wed', 
            3: '3:Thu', 
            4: '4:Fri',
            5: '5:Sat', 
            6: '6:Sun'
        } 
        df2['day_of_week_num'] = df2['date_local'].dt.dayofweek # 0-6
        df2['day_of_week'] = df2['day_of_week_num'].map(dw_mapping)  # Mon-Sun
    
        #  0   tweets    200 non-null    object              
        #  1   id        200 non-null    int64              
        #  2   len       200 non-null    int32              
        #  3   date      200 non-null    datetime64[ns, UTC] 
        #  4   source    200 non-null    object          
        #  5   likes     200 non-null    int32              
        #  6   retweets  200 non-null    int32     
        #  7   date_local                datetime64[ns, UTC] 
        #  8   date_local_string         object
        #  9   day_of_week_num  200 non-null    int64  # 0-6            
        # 10   day_of_week      200 non-null    object # ★ index (0:Mon-6:Sun)     
     
        fig2, ax2 = plt.subplots()
    
        grp2 = df2.groupby('day_of_week')['day_of_week'].count()  
     
        grp2.plot(ax=ax2, kind='bar', rot=0, 
            figsize=(6, 4), color='r', 
            xlabel='Day of Week', ylabel='Number of tweet', 
            title=f'Tweet count by day of week\n@{screen_name}')   
    
        col3.pyplot(fig2)
    
    
    ### 3-3) Plot 'Likes count by day of week '
    col3.caption('Likes count by day of week')
    
    if bol_run_analysis:
        df3 = df.copy()
        dw_mapping={
            0: '0:Mon', 
            1: '1:Tue', 
            2: '2:Wed', 
            3: '3:Thu', 
            4: '4:Fri',
            5: '5:Sat', 
            6: '6:Sun'
        } 
        df3['day_of_week_num'] = df3['date_local'].dt.dayofweek # 0-6
        df3['day_of_week'] = df3['day_of_week_num'].map(dw_mapping)  # Mon-Sun
    
        #  0   tweets    200 non-null    object              
        #  1   id        200 non-null    int64              
        #  2   len       200 non-null    int32              
        #  3   date      200 non-null    datetime64[ns, UTC] 
        #  4   source    200 non-null    object          
        #  5   likes     200 non-null    int32              
        #  6   retweets  200 non-null    int32     
        #  7   date_local                datetime64[ns, UTC] 
        #  8   date_local_string         object
        #  9   day_of_week_num  200 non-null    int64  # 0-6            
        # 10   day_of_week      200 non-null    object # ★ index (0:Mon-6:Sun)     
     
        fig3, ax3 = plt.subplots()
    
        grp3 = df3.groupby('day_of_week')['likes'].sum()  
     
        grp3.plot(ax=ax3, kind='bar', rot=0, 
            figsize=(6, 4), color='r', 
            xlabel='Day of Week', ylabel='Number of likes', 
            title=f'Likes count by day of week\n@{screen_name}')   
    
        col3.pyplot(fig3)


    ### 3-4) Plot 'Tweet count by date '
    col3.caption('Tweet count by date')
    
    if bol_run_analysis:
        df4 = df.copy()
        df4['date_local2'] = df4['date_local'].dt.date  # yyyy-mm-dd 
    
        #  0   tweets    200 non-null    object              
        #  1   id        200 non-null    int64              
        #  2   len       200 non-null    int32              
        #  3   date      200 non-null    datetime64[ns, UTC] 
        #  4   source    200 non-null    object          
        #  5   likes     200 non-null    int32              
        #  6   retweets  200 non-null    int32     
        #  7   date_local                datetime64[ns, UTC] 
        #  8   date_local_string         object
        #  9   date_local2               datetime64[ns, UTC] : just date yyyy-mm-dd    
     
        fig4, ax4 = plt.subplots()
    
        grp4 = df4.groupby('date_local2')['date_local2'].count() 
        grp4.plot(ax=ax4, kind='line', rot=45, 
            figsize=(8, 4), color='r', 
            xlabel='Date', ylabel='Number of tweet', 
            title=f'Tweet count by date\n@{screen_name}')   
    
        col3.pyplot(fig4)
    
    ### 3-5) Plot 'Tweet count by date '
    col3.caption('Tweet count by date')
    
    if bol_run_analysis:
        df5 = df.copy()
        df5['date_local2'] = df5['date_local'].dt.date  # yyyy-mm-dd 
    
        #  0   tweets    200 non-null    object              
        #  1   id        200 non-null    int64              
        #  2   len       200 non-null    int32              
        #  3   date      200 non-null    datetime64[ns, UTC] 
        #  4   source    200 non-null    object          
        #  5   likes     200 non-null    int32              
        #  6   retweets  200 non-null    int32     
        #  7   date_local                datetime64[ns, UTC] 
        #  8   date_local_string         object
        #  9   date_local2               datetime64[ns, UTC] : just date yyyy-mm-dd    
     
        fig5, ax5 = plt.subplots()
    
        grp5 = df5.groupby('date_local2')['date_local2'].count()  
        # convert pandas series to dataframe and reset index
        df5 = grp5.to_frame(name='tweet_count').reset_index()
        # rename column names
        df5.columns = ['date','value']
        #  0   date         10 non-null     object
        #  1   value        10 non-null     int64  
     
        df5.plot(ax=ax5, kind='scatter', x='date', y='value', 
            s=None, c='value', cmap='Reds', edgecolor='black',  
            rot=45, figsize=(8, 4),  
            xlabel='Date', ylabel='Number of tweet', 
            title=f'Tweet count by date\n@{screen_name}')   
    
        col3.pyplot(fig5)
    
    # streamlit run "Article052_20_Streamlit Twitter likes analysis.py"