-
新規HTMLファイルを作成してCSSを追加する
Visual Studio Code(VSC)を起動したら新規HTMLファイルを作成します。
HTMLファイルが表示されたら「!」を入力してポップアップリストから「先頭行」クリックします。
HTMLのテンプレートが表示されたら行7のtitleを書き換えます。
次に行8-22を入力してCSSを追加します。
<!DOCTYPE html>
<html lang="en">
<head>
    <meta charset="UTF-8">
    <meta http-equiv="X-UA-Compatible" content="IE=edge">
    <meta name="viewport" content="width=device-width, initial-scale=1.0">
    <title>Predicting whether a visitor will buy a car using AI in PyScript</title>
    <style>
        body {
          margin: 5% 5% !important;
        }
        .p_article078 {
          font-size: smaller;
        }
        .span_article078 {
          font-size: smaller;
        }
        .div_article078 {
          width: 85%;
          margin: 20px auto;
        }
    </style>

</head>
<body>

</body>
</html>
-
headセクションにlink, scriptを追加してPyScriptのCSS, JavaScriptライブラリを取り込む
headセクションに行23-31を追加します。
行23ではBootstrapのCSSを取り込んでいます。
行24ではPyScriptのCSSを取り込んでいます。
行25ではPyScriptのJavaScriptのライブラリを取り込んでいます。
行26-31ではPythonのライブラリを宣言しています。
<!DOCTYPE html>
<html lang="en">
<head>
    <meta charset="UTF-8">
    <meta http-equiv="X-UA-Compatible" content="IE=edge">
    <meta name="viewport" content="width=device-width, initial-scale=1.0">
    <title>Predicting whether a visitor will buy a car using AI in PyScript</title>
    <style>
        body {
          margin: 5% 5% !important;
        }
        .p_article078 {
          font-size: smaller;
        }
        .span_article078 {
          font-size: smaller;
        }
        .div_article078 {
          width: 85%;
          margin: 20px auto;
        }
    </style>
    <link rel="stylesheet" href="https://cdn.jsdelivr.net/npm/bootstrap@4.3.1/dist/css/bootstrap.min.css">
    <link rel="stylesheet" href="https://pyscript.net/alpha/pyscript.css" />
    <script defer src="https://pyscript.net/alpha/pyscript.js"></script>
    <py-env>
      - numpy
      - pandas
      - matplotlib
      - scikit-learn
    </py-env>
</head>
<body>

</body>
</html>
-
bodyセクションにHTMLのh1, div, span, label, input等の要素を配置する
bodyセクションにdiv, h1, p, label, input等のHTML要素を追加して配置します。
行7-10ではWebページの見出しを配置しています。
行13-17では売上データをどのように分割するかを入力するテキストボックスを配置しています。
行21-40では機械学習のモデルを選択させるためにラジオボタンを配置しています。
行45-53では来店客(見込客)の年齢、年収を入力するテキストボックスを配置しています。
行55-62では各種ボタンを配置しています。
行65ではボタンをクリックしたときの結果を表示する領域を配置しています。
<!DOCTYPE html>
<html lang="en">
<head>
    :::
</head>
<body>
    <div>
        <h1>Predicting whether a visitor will buy a car using machine learning in PyScript 🐍</h1>
        <p class="p_article078">(ここでは来店客の年齢・年収から車を購入するかどうかを予測します)</p>
    </div>

    <div class="div_article078">
        <div class="form-group">
            <label for="test_split">Choose Test Split: <span class="span_article077">(分割するテスト用データの割合)</span> </label>
            <input type="number" class="form-control" id="test_split" aria-describedby="testSplitHelp" value="0.25">
            <small id="testSplitHelp" class="form-text text-muted">Answer between 0 to 1.</small>
        </div>

        <h2>Choose Model: <span class="span_article078">(モデルを選択)</span></h2>
        <div class="row ml-1">
            <div class="form-check col-lg-6">
                <input class="form-check-input" type="radio" name="modelSelection" id="svm_model" value="SVM" checked>
                <label class="form-check-label" for="svm_model">Support Vector Machine</label>
            </div>
            <div class="form-check col-lg-6">
                <input class="form-check-input" type="radio" name="modelSelection" id="rf_model" value="RF">
                <label class="form-check-label" for="rf_model">Random Forest</label>
            </div>
            <div class="form-check col-lg-6">
                <input class="form-check-input" type="radio" name="modelSelection" id="dt_model" value="DT">
                <label class="form-check-label" for="dt_model">Decision Tree</label>
            </div>
            <div class="form-check col-lg-6">
                <input class="form-check-input" type="radio" name="modelSelection" id="nb_model" value="NB">
                <label class="form-check-label" for="nb_model">Naive Bayes</label>
            </div>
            <div class="form-check col-lg-6">
                <input class="form-check-input" type="radio" name="modelSelection" id="lr_model" value="LR">
                <label class="form-check-label" for="lr_model">Logistic Regression</label>
            </div>
        </div>

        <br />
        <h2>Buyer's Parameters <span class="span_article078">(見込客の情報)</span> </h2>
        <div class="form-group">
            <label for="age">Age: <span class="span_article078">(年齢)</span> </label>
            <input type="number" class="form-control" id="age" aria-describedby="ageHelp" value="35">
            <small id="ageHelp" class="form-text text-muted">Answer age of buyer.</small>

            <label for="salary">Annual Salary (US $): <span class="span_article078">(年収: 米ドル)</span> </label>
            <input type="number" class="form-control" id="salary" aria-describedby="salaryHelp" value="100000">
            <small id="salaryHelp" class="form-text text-muted">Answer annual salary of buyer.</small>
        </div>

        <div class="form-group">
            <button id="import" class="btn btn-primary mt-2"  pys-onClick="import_data">Import Data</button>
            <button id="visualize" class="btn btn-primary mt-2 disabled" disabled pys-onClick="visualize_data">Visualize Data</button>
            <button id="train" class="btn btn-primary mt-2 disabled" disabled pys-onClick="train_model">Train Model</button>
            <button id="plot" class="btn btn-primary mt-2 disabled" disabled pys-onClick="plot_boundary">Plot Boundary</button>
            <button id="score" class="btn btn-primary mt-2 disabled" disabled pys-onClick="accuracy">Accuracy</button>
            <button id="predict" class="btn btn-primary mt-2 disabled" disabled pys-onClick="predict">Predict</button>
        </div>

        <hr />
        <div id="output"></div>

    </div>

</body>
</html>
-
bodyセクションにpy-scriptを追加してPythonのコードを追加する
bodyセクションに<py-script>...</py-script>を追加してPythonのコードを記述します。
行71-89ではPythonのライブラリを取り込んでいます。
行90ではPythonの警告メッセージを抑止しています。
行93-97ではglobal変数を定義しています。
行99-123では関数「import_data()」を定義しています。
行104ではPandasのread_csv()メソッドでCSVファイルをDataFrameに取り込んでいます。
PyScriptでCSVファイルを取り込むときはCSVファイルの場所をURL形式で指定します。
さらに、CSVファイルをopen_url()メソッドでロードしておく必要があります。
行106ではDataFrameのshapeでレコード件数をチェックしています。
行107-116ではbutton要素のclass属性から「disabled」クラスを削除しています。
さらにbutton要素のdisabled属性にFalseを設定してボタンを有効にしています。
行120ではpyscriptのwrite()メソッドでDataFrameのレコード件数を表示しています。
行123ではpyscriptのwrite()メソッドでエラーメッセージを表示しています。
行125-138では関数「visualize_data()」を定義しています。
行131-138ではmatplotlibで散布図を作成してブラウザに表示しています。
つまり、売上データを可視化しています。
行140-182では関数「train_mode()」を定義しています。
行144ではラジオボタンから選択したモデルを取得しています。
行146-160では選択したモデルのインスタンスを生成しています。
行165ではテキストボックスからテスト用に分割するパーセント(%)を取得しています。
行173ではtran_test_split()メソッドで売上データを学習用とテスト用に分割しています。
行175-177では売上データを正規化・平準化しています。
行180では売上データをもとに学習させています。
行184-210では関数「plot_boundary()」を定義しています。
この関数ではMatplotlibのscatter()メソッドで散布図を作成しています。
さらにMatplotlibのcontourf()メソッドで車の未購入者の領域を塗りつぶしています。
車の購入者、未購入者の境界線は黄色で表示されます。
行212-217では関数「accuracy()」を定義しています。
この関数ではモデルの正解率を計算して表示しています。
行219-228では関数「predict()」を定義しています。
この関数では見込客が車を買うかどうかを予測して結果を表示しています。
<!DOCTYPE html>
<html lang="en">
<head>
    :::
</head>
<body>
    <div>
        <h1>Predicting whether a visitor will buy a car using machine learning in PyScript 🐍</h1>
        <p class="p_article078">(ここでは来店客の年齢・年収から車を購入するかどうかを予測します)</p>
    </div>

    <div class="div_article078">
        <div class="form-group">
            <label for="test_split">Choose Test Split: <span class="span_article077">(分割するテスト用データの割合)</span> </label>
            <input type="number" class="form-control" id="test_split" aria-describedby="testSplitHelp" value="0.25">
            <small id="testSplitHelp" class="form-text text-muted">Answer between 0 to 1.</small>
        </div>

        <h2>Choose Model: <span class="span_article078">(モデルを選択)</span></h2>
        <div class="row ml-1">
            <div class="form-check col-lg-6">
                <input class="form-check-input" type="radio" name="modelSelection" id="svm_model" value="SVM" checked>
                <label class="form-check-label" for="svm_model">Support Vector Machine</label>
            </div>
            <div class="form-check col-lg-6">
                <input class="form-check-input" type="radio" name="modelSelection" id="rf_model" value="RF">
                <label class="form-check-label" for="rf_model">Random Forest</label>
            </div>
            <div class="form-check col-lg-6">
                <input class="form-check-input" type="radio" name="modelSelection" id="dt_model" value="DT">
                <label class="form-check-label" for="dt_model">Decision Tree</label>
            </div>
            <div class="form-check col-lg-6">
                <input class="form-check-input" type="radio" name="modelSelection" id="nb_model" value="NB">
                <label class="form-check-label" for="nb_model">Naive Bayes</label>
            </div>
            <div class="form-check col-lg-6">
                <input class="form-check-input" type="radio" name="modelSelection" id="lr_model" value="LR">
                <label class="form-check-label" for="lr_model">Logistic Regression</label>
            </div>
        </div>

        <br />
        <h2>Buyer's Parameters <span class="span_article078">(見込客の情報)</span> </h2>
        <div class="form-group">
            <label for="age">Age: <span class="span_article078">(年齢)</span> </label>
            <input type="number" class="form-control" id="age" aria-describedby="ageHelp" value="35">
            <small id="ageHelp" class="form-text text-muted">Answer age of buyer.</small>

            <label for="salary">Annual Salary (US $): <span class="span_article078">(年収: 米ドル)</span> </label>
            <input type="number" class="form-control" id="salary" aria-describedby="salaryHelp" value="100000">
            <small id="salaryHelp" class="form-text text-muted">Answer annual salary of buyer.</small>
        </div>

        <div class="form-group">
            <button id="import" class="btn btn-primary mt-2"  pys-onClick="import_data">Import Data</button>
            <button id="visualize" class="btn btn-primary mt-2 disabled" disabled pys-onClick="visualize_data">Visualize Data</button>
            <button id="train" class="btn btn-primary mt-2 disabled" disabled pys-onClick="train_model">Train Model</button>
            <button id="plot" class="btn btn-primary mt-2 disabled" disabled pys-onClick="plot_boundary">Plot Boundary</button>
            <button id="score" class="btn btn-primary mt-2 disabled" disabled pys-onClick="accuracy">Accuracy</button>
            <button id="predict" class="btn btn-primary mt-2 disabled" disabled pys-onClick="predict">Predict</button>
        </div>

        <hr />
        <div id="output"></div>

    </div>

    <py-script>
# import python libraries
import numpy as np
import pandas as pd
import matplotlib.pyplot as plt
from pyodide.http import open_url

from sklearn.model_selection import train_test_split

from sklearn.metrics import classification_report
from sklearn.metrics import confusion_matrix
from sklearn.metrics import accuracy_score

from sklearn.preprocessing import StandardScaler
from sklearn.linear_model import LogisticRegression
from sklearn.tree import DecisionTreeClassifier
from sklearn.naive_bayes import GaussianNB
from sklearn.ensemble import RandomForestClassifier
from sklearn.svm import SVC # SVC: Linear Support Vector Classification

import warnings
warnings.simplefilter('ignore')

# define global variables
sales_data = pd.DataFrame()
X_train = 0; X_test = 0; y_train = 0; y_test = 0
sc = StandardScaler()
model = SVC()
model_name = ''

def import_data(*args, **kwargs):
    # Import the data
    global sales_data
    csv_file = './data/csv/CarSalesData.csv'
    url_content = open_url(csv_file)
    df = pd.read_csv(url_content)

    if df.shape[0] == 400:
        document.getElementById("visualize").classList.remove("disabled");
        document.getElementById("visualize").disabled = False;
        document.getElementById("train").classList.remove("disabled");
        document.getElementById("train").disabled = False;
        document.getElementById("plot").classList.remove("disabled");
        document.getElementById("plot").disabled = False;
        document.getElementById("score").classList.remove("disabled");
        document.getElementById("score").disabled = False;
        document.getElementById("predict").classList.remove("disabled");
        document.getElementById("predict").disabled = False;

        console.warn(f'df.shape: {df.shape}')
        sales_data = df
        pyscript.write('output', f'import_data(): df.shape {df.shape}')
    else:
        console.error(f'pd.read_csv() error: df.shape: {df.shape}')
        pyscript.write('output', f'import_data(): pd.read_csv() network error df.shape {df.shape}')

def visualize_data(*args, **kwargs):
    # Visualize car sales data
    df = sales_data
    X = df.iloc[:, [2,3]].values    # Age[0], EstimatedSalary[1]
    y = df.iloc[:, 4].values        # Purchased (0 or 1)

    plt.style.use('dark_background')
    fig, ax = plt.subplots(1, 1, figsize=(10,6))

    ax.scatter(X[y == 0][:, 0], X[y == 0][:, 1], color='r', label='0:Not Purchased') # Age
    ax.scatter(X[y == 1][:, 0], X[y == 1][:, 1], color='g', label='1:Purchased')     # Salary
    ax.legend()
    ax.set(xlabel='Age', ylabel='Estimated Salary ($)', title='Plot input data\n(Age vs Salary)')
    pyscript.write('output', fig)

def train_model(*args, **kwargs):
    global sc, model, model_name
    global X_train, X_test, y_train, y_test

    model_type = document.querySelector('input[name="modelSelection"]:checked').value   # SVM, RF, DT, NB, LR

    if model_type == 'SVM':
        model = SVC(gamma='auto')
        model_name = 'Support Vector Classification'
    elif model_type == 'RF':
        model = RandomForestClassifier(random_state=1, n_estimators=100)
        model_name = 'Random Forest Classifier'
    elif model_type == 'DT':
        model = DecisionTreeClassifier()
        model_name = 'Decision Tree Classifier'
    elif model_type == 'NB':
        model = GaussianNB()
        model_name = 'Gaussian Naive Bayes'
    elif model_type == 'LR':
        model = LogisticRegression(random_state=0)
        model_name = 'Logistic Regression'

    console.warn(f'model= {model_type} - {model_name}')

    # Prepare the data
    test_split = float(document.getElementById("test_split").value)
    console.warn(f'test_split= {test_split:.2f}')

    df = sales_data
    X = df.iloc[:, [2,3]].values    # Age[0], EstimatedSalary[1]
    y = df.iloc[:, 4].values        # Purchased (0 or 1)

    # Split the input data (75:25)
    X_train, X_test, y_train, y_test = train_test_split(X, y, test_size=test_split, random_state=0)

    sc = StandardScaler()
    X_train = sc.fit_transform(X_train)
    X_test = sc.transform(X_test)

    # Train the model
    model.fit(X_train, y_train)
    console.warn('model.fit(x, y) done!')
    pyscript.write('output', f'train_model(): done!')

def plot_boundary(*args, **kwargs):
    # Plot the dicision boundary
    plt.style.use('dark_background')
    fig, ax = plt.subplots(1, 1, figsize=(10,8))

    X = X_train
    y = y_train

    # Set min and max values and give it some padding:  X: Age, Salary
    x_min, x_max = X[:, 0].min() - .5, X[:, 0].max() + .5   # Age: x_min=17.5, x_max=60.5
    y_min, y_max = X[:, 1].min() - .5, X[:, 1].max() + .5   # Salary: y_min=14999.5, y_max=150000.5

    h = 0.1

    # Generate a grid of points with distance h between them
    xx, yy = np.meshgrid(np.arange(x_min, x_max, h), np.arange(y_min, y_max, h))

    # Predict the whole grid
    Z = model.predict(np.c_[xx.ravel(), yy.ravel()])
    Z = Z.reshape(xx.shape)

    # Plot the contour and training examples
    ax.contourf(xx, yy, Z, cmap=plt.cm.Spectral)
    ax.scatter(X[:, 0], X[:, 1], c=y, cmap=plt.cm.Spectral)    # X=Age, Y=Salary

    ax.set(title=f'{model_name}\n(Decision Boundary)')
    pyscript.write('output', fig)

def accuracy(*args, **kwargs):
    # Evaluate the prediction results
    y_pred = model.predict(X_test)
    score = accuracy_score(y_test, y_pred) * 100
    console.warn(f'score: {score}')
    pyscript.write('output', f'accuracy(): score= {score}')

def predict(*args, **kwargs):
    # Make Predictions
    age = int(document.getElementById("age").value) # 40
    salary = int(document.getElementById("salary").value) # 100,000

    X_test = [[age, salary]]             # Age=40, EstimakedSalary=$100,000
    X_test = sc.transform(X_test)
    y_pred = model.predict(X_test)
    result = 'A visitor will be buy it (購入する)' if y_pred[0] == 1 else 'A visitor will not buy it (購入しない)'
    pyscript.write('output', f'age={age}, salary={salary:,.0f} ▶ {result}')
    </py-script>

</body>
</html>
-
HTMLファイルのすべてを掲載
最後にここで解説したHTMLファイルのすべてを掲載しましたので参考にしてください。
<!DOCTYPE html>
<html lang="en">
<head>
    <meta charset="UTF-8">
    <meta http-equiv="X-UA-Compatible" content="IE=edge">
    <meta name="viewport" content="width=device-width, initial-scale=1.0">
    <title>Predicting whether a visitor will buy a car using machine learning in PyScript</title>
    <style>
        body {
          margin: 5% 5% !important;
        }
        .p_article078 {
          font-size: smaller;
        }
        .span_article078 {
          font-size: smaller;
        }
        .div_article078 {
          width: 85%;
          margin: 20px auto;
        }
    </style>
    <link rel="stylesheet" href="https://cdn.jsdelivr.net/npm/bootstrap@4.3.1/dist/css/bootstrap.min.css">
    <link rel="stylesheet" href="https://pyscript.net/alpha/pyscript.css" />
    <script defer src="https://pyscript.net/alpha/pyscript.js"></script>
    <py-env>
      - numpy
      - pandas
      - matplotlib
      - scikit-learn
    </py-env>
</head>
<body>
    <!-- Heading Content -->
    <div>
        <h1>Predicting whether a visitor will buy a car using machine learning in PyScript 🐍</h1>
        <p class="p_article078">(ここでは来店客の年齢・年収から車を購入するかどうかを予測します)</p>
    </div>

    <!-- Training Parameters -->
    <div class="div_article078">
        <!-- Choose Test Split -->
        <div class="form-group">
            <label for="test_split">Choose Test Split: <span class="span_article077">(分割するテスト用データの割合)</span> </label>
            <input type="number" class="form-control" id="test_split" aria-describedby="testSplitHelp" value="0.25">
            <small id="testSplitHelp" class="form-text text-muted">Answer between 0 to 1.</small>
        </div>

        <!-- Choose Model -->
        <h2>Choose Model: <span class="span_article078">(モデルを選択)</span></h2>
        <!-- radio button list -->
        <div class="row ml-1">
            <div class="form-check col-lg-6">
                <input class="form-check-input" type="radio" name="modelSelection" id="svm_model" value="SVM" checked>
                <label class="form-check-label" for="svm_model">Support Vector Machine</label>
            </div>
            <div class="form-check col-lg-6">
                <input class="form-check-input" type="radio" name="modelSelection" id="rf_model" value="RF">
                <label class="form-check-label" for="rf_model">Random Forest</label>
            </div>
            <div class="form-check col-lg-6">
                <input class="form-check-input" type="radio" name="modelSelection" id="dt_model" value="DT">
                <label class="form-check-label" for="dt_model">Decision Tree</label>
            </div>
            <div class="form-check col-lg-6">
                <input class="form-check-input" type="radio" name="modelSelection" id="nb_model" value="NB">
                <label class="form-check-label" for="nb_model">Naive Bayes</label>
            </div>
            <div class="form-check col-lg-6">
                <input class="form-check-input" type="radio" name="modelSelection" id="lr_model" value="LR">
                <label class="form-check-label" for="lr_model">Logistic Regression</label>
            </div>
        </div>

        <br />
        <!-- Buyer's parameters -->
        <h2>Buyer's Parameters <span class="span_article078">(見込客の情報)</span> </h2>
        <div class="form-group">
            <label for="age">Age: <span class="span_article078">(年齢)</span> </label>
            <input type="number" class="form-control" id="age" aria-describedby="ageHelp" value="35">
            <small id="ageHelp" class="form-text text-muted">Answer age of buyer.</small>

            <label for="salary">Annual Salary (US $): <span class="span_article078">(年収: 米ドル)</span> </label>
            <input type="number" class="form-control" id="salary" aria-describedby="salaryHelp" value="100000">
            <small id="salaryHelp" class="form-text text-muted">Answer annual salary of buyer.</small>
        </div>

        <!-- Buttons -->
        <div class="form-group">
            <button id="import" class="btn btn-primary mt-2"  pys-onClick="import_data">Import Data</button>
            <button id="visualize" class="btn btn-primary mt-2 disabled" disabled pys-onClick="visualize_data">Visualize Data</button>
            <button id="train" class="btn btn-primary mt-2 disabled" disabled pys-onClick="train_model">Train Model</button>
            <button id="plot" class="btn btn-primary mt-2 disabled" disabled pys-onClick="plot_boundary">Plot Boundary</button>
            <button id="score" class="btn btn-primary mt-2 disabled" disabled pys-onClick="accuracy">Accuracy</button>
            <button id="predict" class="btn btn-primary mt-2 disabled" disabled pys-onClick="predict">Predict</button>
        </div>

        <hr />
        <div id="output"></div>

    </div>

    <py-script>
# import python libraries
import numpy as np
import pandas as pd
import matplotlib.pyplot as plt
from pyodide.http import open_url

from sklearn.model_selection import train_test_split

from sklearn.metrics import classification_report
from sklearn.metrics import confusion_matrix
from sklearn.metrics import accuracy_score

from sklearn.preprocessing import StandardScaler
from sklearn.linear_model import LogisticRegression
from sklearn.tree import DecisionTreeClassifier
from sklearn.naive_bayes import GaussianNB
from sklearn.ensemble import RandomForestClassifier
from sklearn.svm import SVC # SVC: Linear Support Vector Classification

import warnings
warnings.simplefilter('ignore')

# define global variables
sales_data = pd.DataFrame()
X_train = 0; X_test = 0; y_train = 0; y_test = 0
sc = StandardScaler()
model = SVC()
model_name = ''

def import_data(*args, **kwargs):
    # Import the data
    global sales_data
    csv_file = './data/csv/CarSalesData.csv'
    url_content = open_url(csv_file)
    df = pd.read_csv(url_content)

    if df.shape[0] == 400:
        document.getElementById("visualize").classList.remove("disabled");
        document.getElementById("visualize").disabled = False;
        document.getElementById("train").classList.remove("disabled");
        document.getElementById("train").disabled = False;
        document.getElementById("plot").classList.remove("disabled");
        document.getElementById("plot").disabled = False;
        document.getElementById("score").classList.remove("disabled");
        document.getElementById("score").disabled = False;
        document.getElementById("predict").classList.remove("disabled");
        document.getElementById("predict").disabled = False;

        console.warn(f'df.shape: {df.shape}')
        sales_data = df
        pyscript.write('output', f'import_data(): df.shape {df.shape}')
    else:
        console.error(f'pd.read_csv() error: df.shape: {df.shape}')
        pyscript.write('output', f'import_data(): pd.read_csv() network error df.shape {df.shape}')

def visualize_data(*args, **kwargs):
    # Visualize car sales data
    df = sales_data
    X = df.iloc[:, [2,3]].values    # Age[0], EstimatedSalary[1]
    y = df.iloc[:, 4].values        # Purchased (0 or 1)

    plt.style.use('dark_background')
    fig, ax = plt.subplots(1, 1, figsize=(10,6))

    ax.scatter(X[y == 0][:, 0], X[y == 0][:, 1], color='r', label='0:Not Purchased') # Age
    ax.scatter(X[y == 1][:, 0], X[y == 1][:, 1], color='g', label='1:Purchased')     # Salary
    ax.legend()
    ax.set(xlabel='Age', ylabel='Estimated Salary ($)', title='Plot input data\n(Age vs Salary)')
    pyscript.write('output', fig)

def train_model(*args, **kwargs):
    global sc, model, model_name
    global X_train, X_test, y_train, y_test

    model_type = document.querySelector('input[name="modelSelection"]:checked').value   # SVM, RF, DT, NB, LR

    if model_type == 'SVM':
        model = SVC(gamma='auto')
        model_name = 'Support Vector Classification'
    elif model_type == 'RF':
        model = RandomForestClassifier(random_state=1, n_estimators=100)
        model_name = 'Random Forest Classifier'
    elif model_type == 'DT':
        model = DecisionTreeClassifier()
        model_name = 'Decision Tree Classifier'
    elif model_type == 'NB':
        model = GaussianNB()
        model_name = 'Gaussian Naive Bayes'
    elif model_type == 'LR':
        model = LogisticRegression(random_state=0)
        model_name = 'Logistic Regression'

    console.warn(f'model= {model_type} - {model_name}')

    # Prepare the data
    test_split = float(document.getElementById("test_split").value) # 0.25
    console.warn(f'test_split= {test_split:.2f}')

    df = sales_data
    X = df.iloc[:, [2,3]].values    # Age[0], EstimatedSalary[1]
    y = df.iloc[:, 4].values        # Purchased (0 or 1)

    # Split the input data (75:25)
    X_train, X_test, y_train, y_test = train_test_split(X, y, test_size=test_split, random_state=0)

    sc = StandardScaler()
    X_train = sc.fit_transform(X_train)
    X_test = sc.transform(X_test)

    # Train the model
    model.fit(X_train, y_train)
    console.warn('model.fit(x, y) done!')
    pyscript.write('output', f'train_model(): done!')

def plot_boundary(*args, **kwargs):
    # Plot the dicision boundary
    plt.style.use('dark_background')
    fig, ax = plt.subplots(1, 1, figsize=(10,8))

    X = X_train
    y = y_train

    # Set min and max values and give it some padding:  X: Age, Salary
    x_min, x_max = X[:, 0].min() - .5, X[:, 0].max() + .5   # Age: x_min=17.5, x_max=60.5
    y_min, y_max = X[:, 1].min() - .5, X[:, 1].max() + .5   # Salary: y_min=14999.5, y_max=150000.5

    h = 0.1

    # Generate a grid of points with distance h between them
    xx, yy = np.meshgrid(np.arange(x_min, x_max, h), np.arange(y_min, y_max, h))

    # Predict the whole grid
    Z = model.predict(np.c_[xx.ravel(), yy.ravel()])
    Z = Z.reshape(xx.shape)

    # Plot the contour and training examples
    ax.contourf(xx, yy, Z, cmap=plt.cm.Spectral)
    ax.scatter(X[:, 0], X[:, 1], c=y, cmap=plt.cm.Spectral)    # X=Age, Y=Salary

    ax.set(title=f'{model_name}\n(Decision Boundary)')
    pyscript.write('output', fig)

def accuracy(*args, **kwargs):
    # Evaluate the prediction results
    y_pred = model.predict(X_test)
    score = accuracy_score(y_test, y_pred) * 100  # 93%
    console.warn(f'score: {score}')
    pyscript.write('output', f'accuracy(): score= {score}')

def predict(*args, **kwargs):
    # Make Predictions
    age = int(document.getElementById("age").value) # 40
    salary = int(document.getElementById("salary").value) # 100,000

    X_test = [[age, salary]]             # Age=40, EstimakedSalary=$100,000
    X_test = sc.transform(X_test)
    y_pred = model.predict(X_test)
    result = 'A visitor will be buy it (購入する)' if y_pred[0] == 1 else 'A visitor will not buy it (購入しない)'
    pyscript.write('output', f'age={age}, salary={salary:,.0f} ▶ {result}')
    </py-script>

</body>
</html>
-
HTMLファイルをブラウザに表示する
Visual Studo Code(VSC)からHTMLファイルをブラウザに表示するには、「Live Server」を使用します。
「Live Server」のインストールと操作については「記事(Article073)」で解説しています。
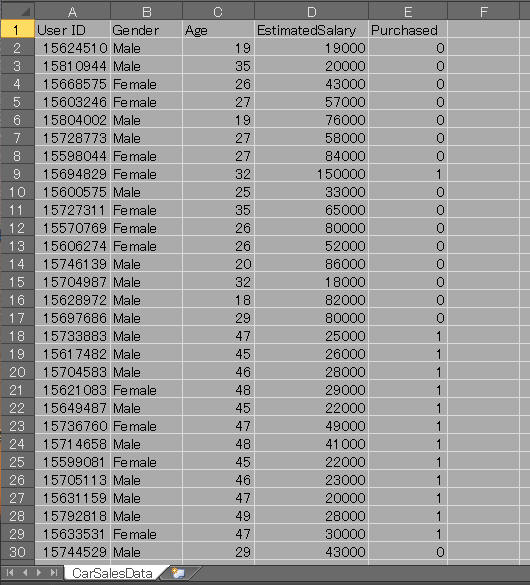 図:1-0 CSV File
図1-0はCSVファイル(CarSalesData.csv)の内容をExcelで表示した画像です。
CSVファイルのレコードは「User ID」「Gender(性別)」「Age(年齢)」「EstimatedSalary(年収)」「Purchased(購入済)」の列から構成されています。
HTMLファイルをブラウザに表示する前に事前に当サイトからCSVファイル(CarSalesData.csv)を
「ダウンロード」して適当なフォルダに保存しておいてください。
ここでは「./data/csv」フォルダに格納しています。
VSCから「Explorer」アイコンをクリックしてHTMLファイルの一覧を表示します。
一覧からHTMLファイルを右クリックしてポップアップリストから先頭の「Open with Live Server」をクリックします。
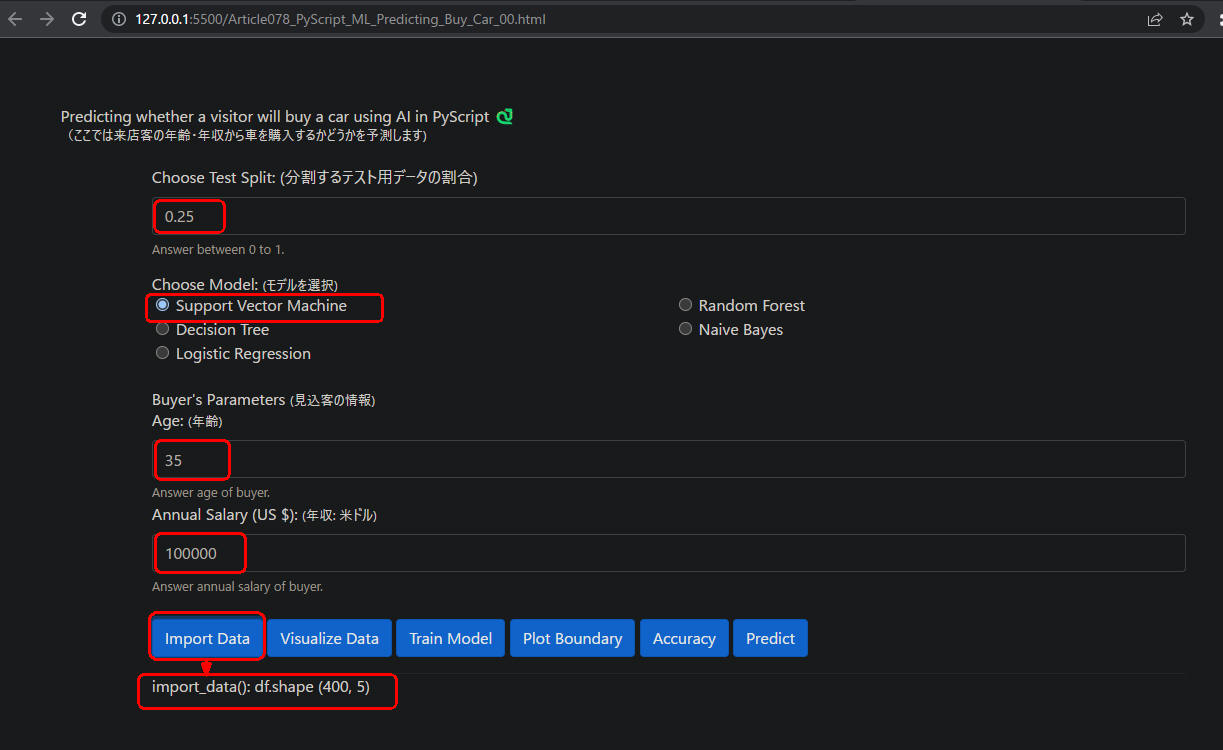 図1-1
図1-1はWebページから[Import Data]ボタンをクリックしたときの画像です。
CSVファイルから400件のデータが搬入されています。
図1-1
図1-1はWebページから[Import Data]ボタンをクリックしたときの画像です。
CSVファイルから400件のデータが搬入されています。
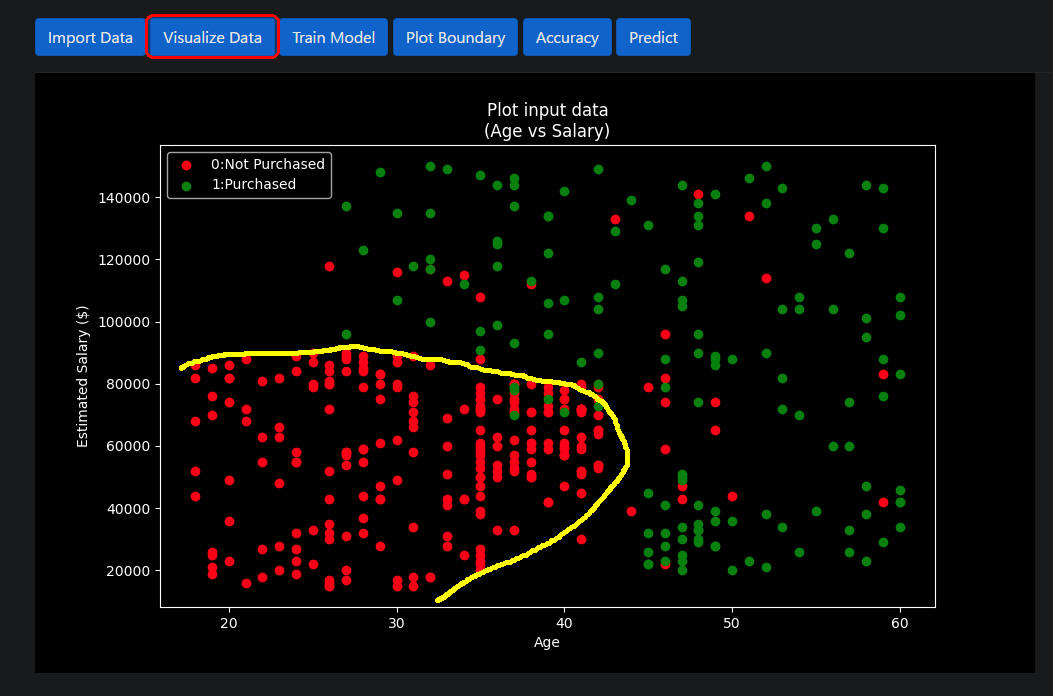 図1-2
図1-2はWebページから[Visualze Data]ボタンをクリックしたときの画像です。
見込客(来店客)が車を購入したかどうかが散布図としてプロットされています。
「緑」が購入者、「赤」が未購入者です。「黄色」が購入者と未購入者の境界線です。
ちなみにAIによる予測がこの境界線に近くなるようなモデルを選択すると正解率が高くなります。
図1-2
図1-2はWebページから[Visualze Data]ボタンをクリックしたときの画像です。
見込客(来店客)が車を購入したかどうかが散布図としてプロットされています。
「緑」が購入者、「赤」が未購入者です。「黄色」が購入者と未購入者の境界線です。
ちなみにAIによる予測がこの境界線に近くなるようなモデルを選択すると正解率が高くなります。
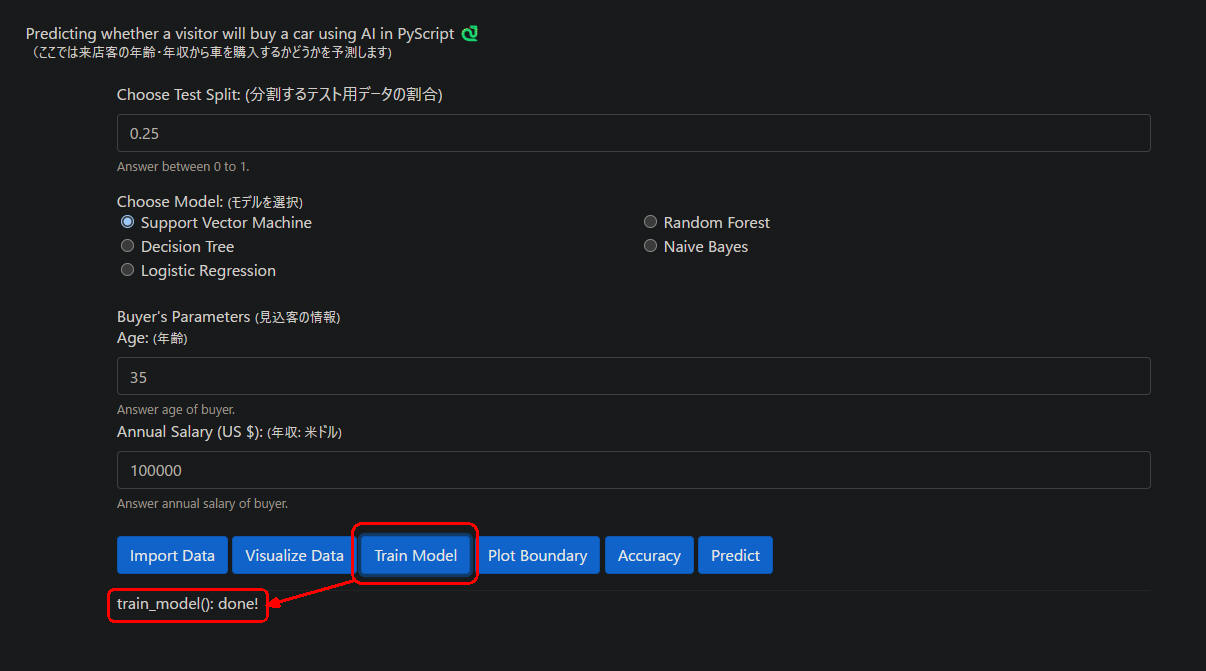 図1-3
図1-3はWebページから[Train Mode]ボタンをクリックしたときの画像です。
ここではモデルとして「Support Vector Machine」を選択しています。
図1-3
図1-3はWebページから[Train Mode]ボタンをクリックしたときの画像です。
ここではモデルとして「Support Vector Machine」を選択しています。
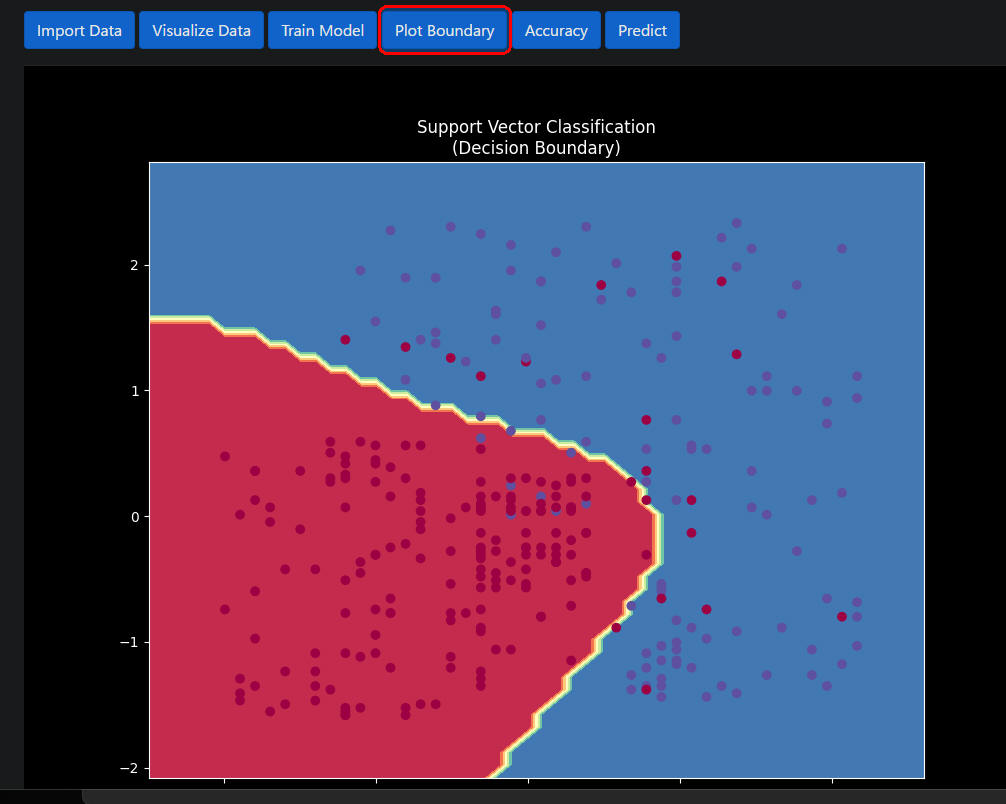 図1-4
図1-4はWebページから[Plot Boundary]ボタンをクリックしたときの画像です。
前出の図1-2と境界線が似ているのでかなり高い精度で予測されることが期待できます。
図1-4
図1-4はWebページから[Plot Boundary]ボタンをクリックしたときの画像です。
前出の図1-2と境界線が似ているのでかなり高い精度で予測されることが期待できます。
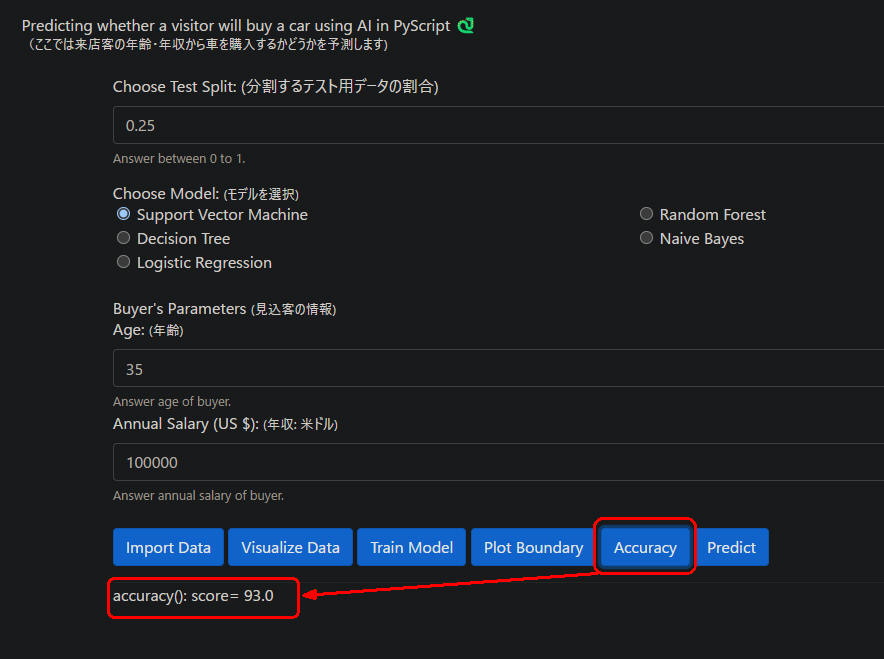 図1-5
図1-5はWebページから[Accuracy]ボタンをクリックしたときの画像です。
正解率が「93.0」%になっています。
図1-5
図1-5はWebページから[Accuracy]ボタンをクリックしたときの画像です。
正解率が「93.0」%になっています。
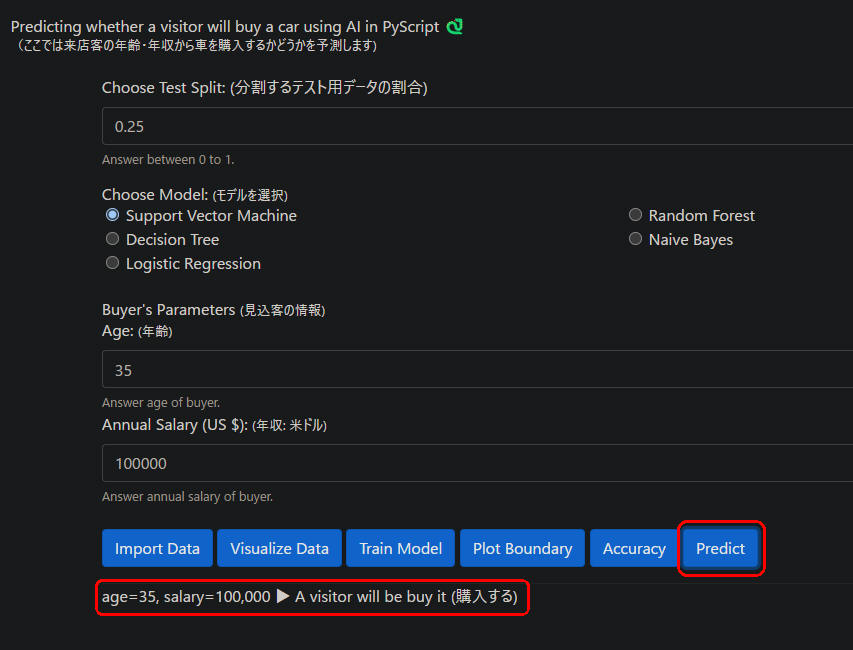 図1-6
図1-6はWebページから[Predict]ボタンをクリックしたときの画像です。
年齢(35)、年収(100,000ドル)の見込客が車を「購入する」という予測になっています。
図1-6
図1-6はWebページから[Predict]ボタンをクリックしたときの画像です。
年齢(35)、年収(100,000ドル)の見込客が車を「購入する」という予測になっています。
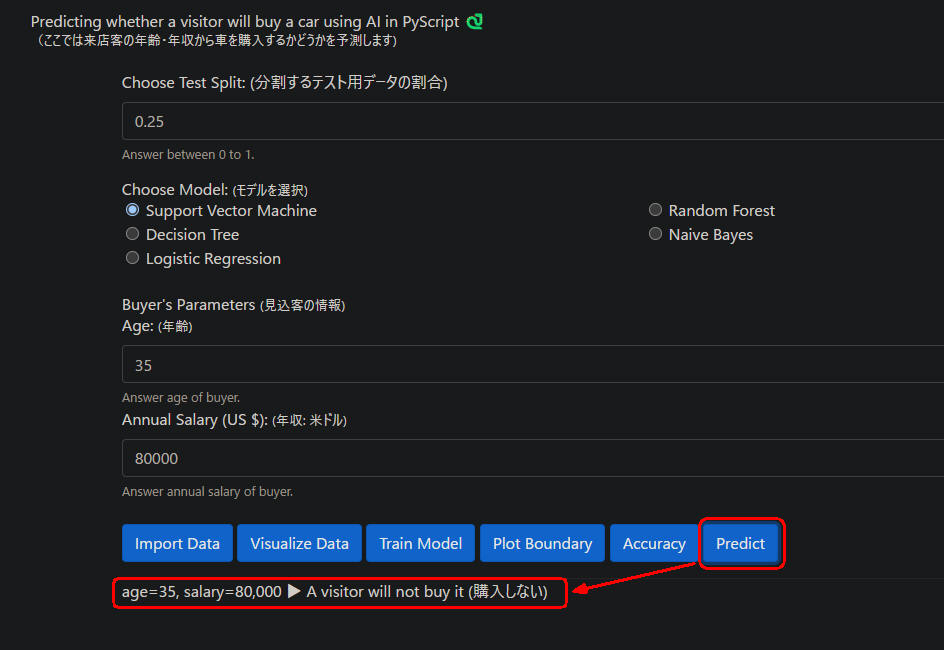 図1-7
図1-7は年齢(35)、年収(80,000ドル)の見込客の予測です。
ここでは車を「購入しない」という予測になっています。
図1-7
図1-7は年齢(35)、年収(80,000ドル)の見込客の予測です。
ここでは車を「購入しない」という予測になっています。
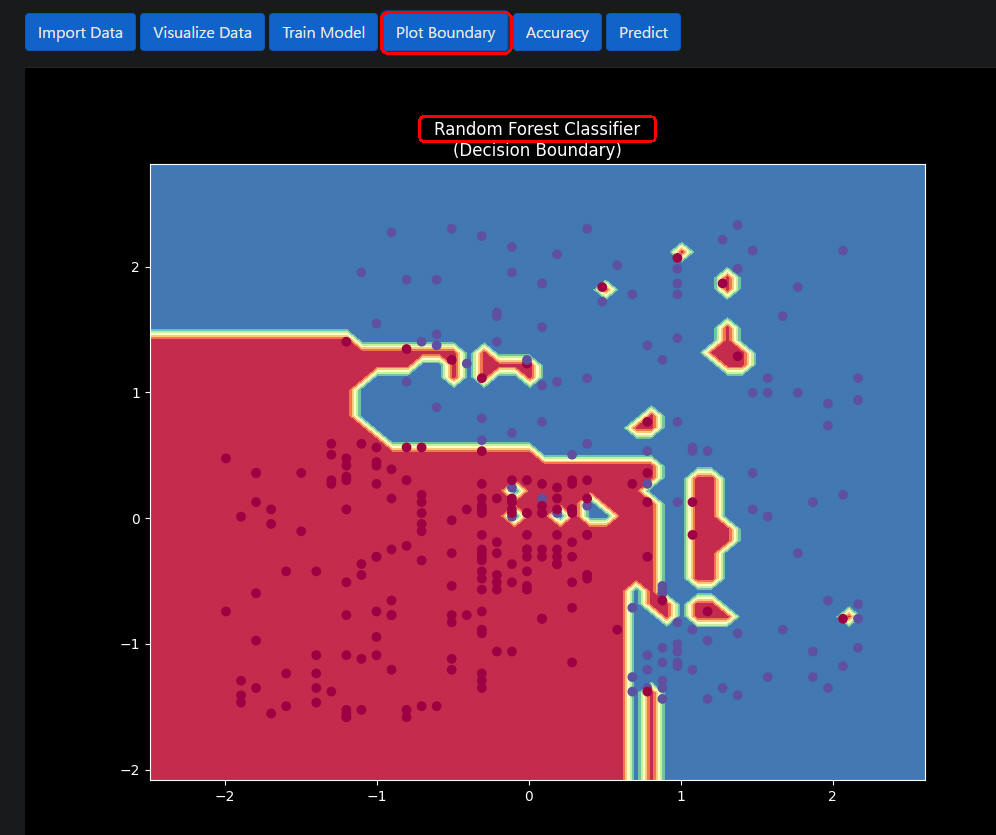 図1-8
図1-8は「Random Forest Classifer」モデルの境界線です。
ちなみに、「Random Forest Classifer」の正解率は「92.0」%です。
図1-8
図1-8は「Random Forest Classifer」モデルの境界線です。
ちなみに、「Random Forest Classifer」の正解率は「92.0」%です。
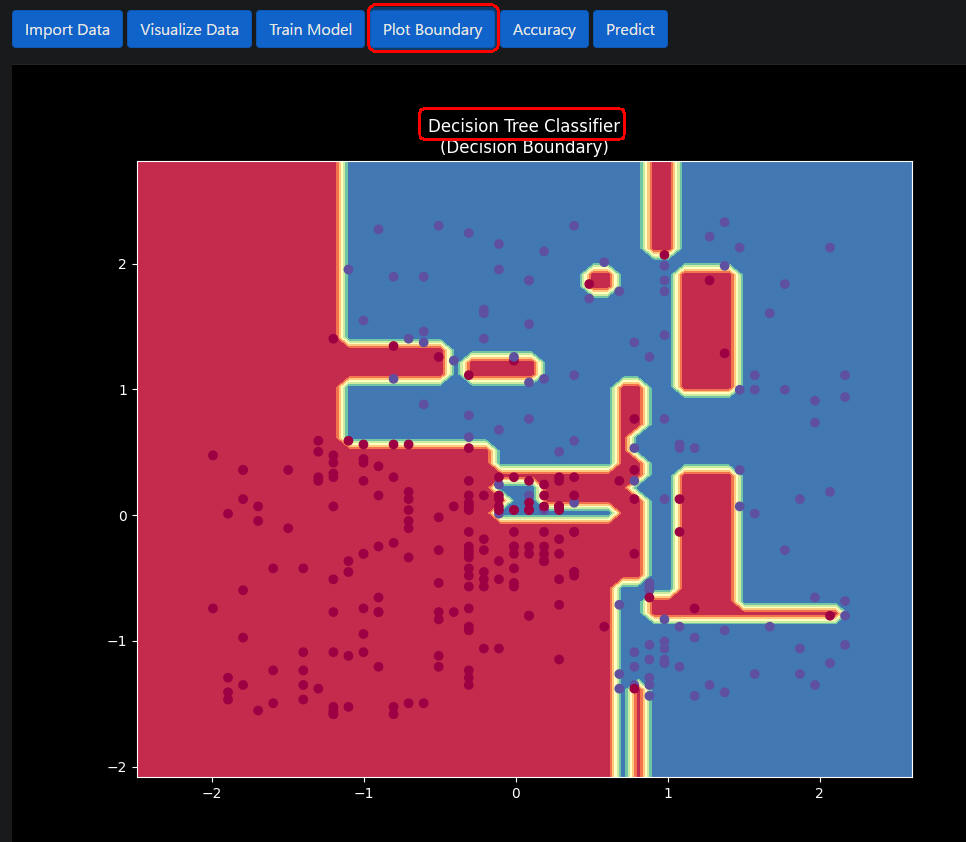 図1-9
図1-9は「Dicision Tree Classfiler」モデルの境界線です。
「Dicision Tree Classfiler」の正解率は「91.0」%です。
図1-9
図1-9は「Dicision Tree Classfiler」モデルの境界線です。
「Dicision Tree Classfiler」の正解率は「91.0」%です。
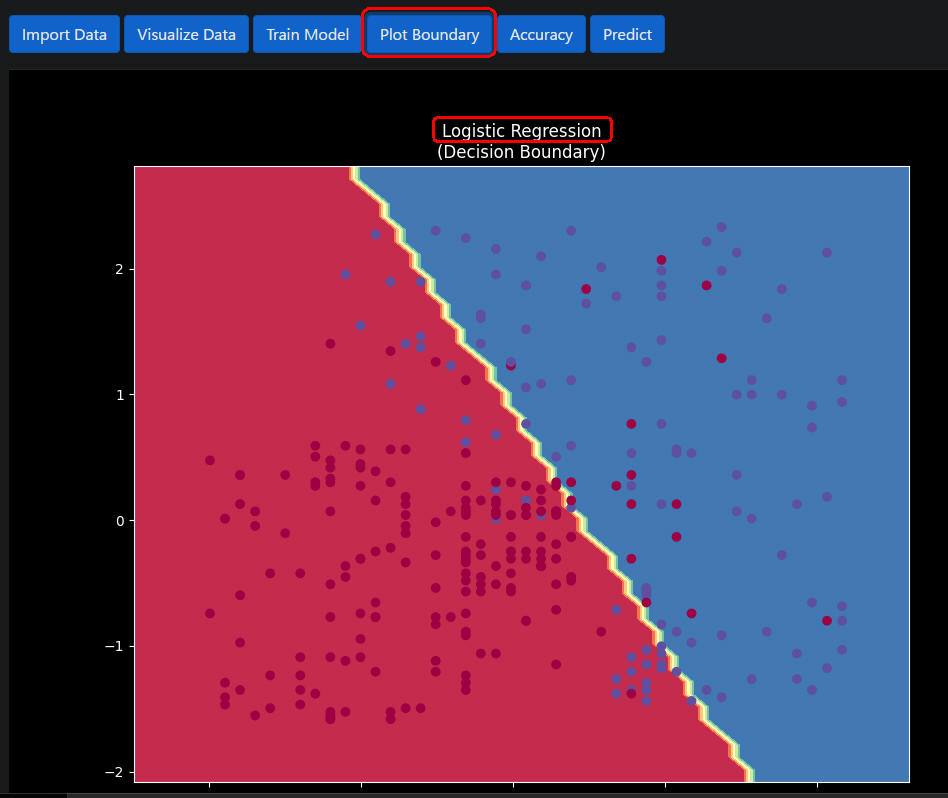 図1-10
図1-10は「Logistic Regression」モデルの境界線です。
「Logistic Regression」の正解率は「89.0」%です。
図1-10
図1-10は「Logistic Regression」モデルの境界線です。
「Logistic Regression」の正解率は「89.0」%です。