ここでは、Dash(※)のDataTableを使用してGMO Coinの仮想通貨の収益率(累積リターン)を表示するWebアプリを作る方法を解説します。
Webページには、GMO Coinの全ての仮想通貨(コイン)のシンボル、ランキング、累積リターンを表形式で表示します。
記事の前半では、表に表示されたコインをさまざまな条件でハイライトさせる方法を紹介します。
たとえば、コインの収益率が最大(max)、最小(min)のコインをハイライトさせたり、
収益率の上位3位/下位3位までをハイライトさせます。
さらに、収益率の上位10%、下位10%のコインをハイライトさせるといった方法も説明します。
記事の後半では、収益率を数値と棒グラフで表示したり、収益率をカラースケールさせて表示させる方法も説明します。
収益率を数字だけで表示するよりも、棒グラフと重ねて表示したり、カラースケールさせることにより視覚で数値の大小が判断できるようになります。
※ Dashは、PythonでWebアプリケーションを作成するためのフレームワークです。
Plotlyのグラフ描画ライブラリを利用しており、データを視覚化するために最適化されています。
Dashは、PythonのWebフレームワークであるFlaskをベースにしており、
Pythonの標準ライブラリを使用しているので、
パフォーマンスが高く、実行速度が速いといった特徴があります。
Dashは、Pythonを使用したデータ分析やデータ視覚化のためのツールとして広く使用されており、
ビジネスインテリジェンス、科学、エンジニアリング、金融、医療、教育などのさまざまな分野で使用されています。
Dashを使用することで、カスタマイズされたWebアプリケーションを比較的簡単に作成できます。
Dashは、PythonによるWebアプリケーション開発において選択肢にいれておきたい開発ツールのひとつです。
説明文の左側に図の画像が表示されていますが縮小されています。
画像を拡大するにはマウスを画像上に移動してクリックします。
画像が拡大表示されます。拡大された画像を閉じるには右上の[X]をクリックします。
画像の任意の場所をクリックして閉じることもできます。
-
まずは、Pythonの開発環境を準備する
まずは、
「記事(Article137)」を参照して、
Pythonの開発環境を準備してください。
ここでは、Pythonのプロジェクトフォルダとして「Dash」を使用しています。
 図1
図1は、Visual Studio Code(VS Code)の「Terminal」メニューから「New Terminal」を選択して、
「Terminal」ウィンドウを開いたときの画面です。 緑色の「(venv)」が表示されていれば、
Pythonの仮想環境が正常に作成されていることになります。
図1
図1は、Visual Studio Code(VS Code)の「Terminal」メニューから「New Terminal」を選択して、
「Terminal」ウィンドウを開いたときの画面です。 緑色の「(venv)」が表示されていれば、
Pythonの仮想環境が正常に作成されていることになります。
-
Visual Studio Codeを起動してプログラムファイルを作成する
Pythonの開発環境の準備が完了したら、 VS Codeを起動して新規のPythonファイル(*.py)を作成します。
ここで作成したPythonのファイルには「リスト1」のコードをコピペします。
リスト1:Article141.py
# Dash DataTable Conditional Formatting v10.py :
# Web Link: https://dash.plotly.com/datatable/conditional-formatting

### Import the libraries
import os
import math
import numpy as np
import pandas as pd
import requests

import datetime as dt
from datetime import timedelta
from time import sleep

from dash import Dash, dash_table, html, Output, Input, State, dcc, ctx
from dash.dash_table import DataTable, FormatTemplate
from dash.dash_table.Format import Format, Scheme, Align, Trim
import dash_bootstrap_components as dbc

from lib.com_lib import get_data, calculate_cum_log_return
from lib.gmo_api import get_crypto, get_crypto_symbols

import warnings
warnings.simplefilter('ignore')

#################################
# Main
#################################

### Load the data from gmo coin

# get all symbols from gmo coin
df = get_crypto_symbols()
symbols = df['symbol'].values.tolist()

interval = '1day'
date_list = ['2020','2021','2022','2023']

symbol_list = []
cum_log_return_list = []
cum_log_return_pct_list = []
for symbol in symbols:
    csv_file = f"datasets/csv/gmo_crypto_2020_2023({symbol})_{interval}.csv"
    isFile = os.path.isfile(csv_file)
    if not isFile:
        for date in date_list:  # '2020','2021','2022','2023'
            df = get_crypto(symbol, interval, date)    # get n rows from starting date
            if not df.empty:
                df.to_csv(csv_file, index=True)
    # end of if not isFile:
    isFile = os.path.isfile(csv_file)
    if isFile:
        df = get_data(csv_file)
        if not df.empty:
            df = calculate_cum_log_return(df)
            df.replace([np.inf, -np.inf], np.nan).dropna(axis=1, inplace=True)
            cum_log_return = df.iloc[-1]['cum_log_return']
            cum_log_return_pct = df.iloc[-1]['cum_log_return_pct']
            symbol_list.append(symbol)
            cum_log_return_list.append(cum_log_return)
            cum_log_return_pct_list.append(cum_log_return_pct)
# end of for symbol in symbols:

### Create DataFrame from dict
data = {
    'symbol': symbol_list,
    'cum_log_return': cum_log_return_list,
    'cum_log_return_pct': cum_log_return_pct_list
}

raw_df = pd.DataFrame(data)
if raw_df.empty:
    print(f"Quit the program due to raw_df is empty: {raw_df.empty=}")
    quit()

### Replace np.inf or -np.inf (positive or negative infinity) with np.nan(Not A Number)
df = raw_df.replace([np.inf, -np.inf], np.nan)
### Drop rows if np.nan (Not A Number)
df.dropna(axis=0, inplace=True)
df['cum_log_return_pct'] = df['cum_log_return']
### Sort in descending order of cum_log_return & Reset index
df = df.sort_values(by=['cum_log_return'], ascending=False).reset_index(drop=True)
### Add a ranking column
df['ranking'] = df.index + 1

### Instantiate Dash Class
app = Dash(__name__, external_stylesheets=[dbc.themes.CYBORG])  # CYBORG

data = df.to_dict('records')

log_return = FormatTemplate.Format(precision=6, scheme=Scheme.fixed)
log_return_pct = FormatTemplate.percentage(2)

columns = [
    dict(id='symbol', name='Symbol', type='text'),
    dict(id='ranking', name='Ranking', type='numeric'),
    dict(id='cum_log_return', name='Cum Log Return', type='numeric', deletable=False, format=log_return),
    dict(id='cum_log_return_pct', name='Cum Log Return (%)', type='numeric', format=log_return_pct)
]

style_header = {
    'backgroundColor': 'rgb(30, 30, 30)',
    'color': 'white',
    'fontWeight': 'bold'
}

style_data = {
    'backgroundColor': 'rgb(50, 50, 50)',
    'color': 'white'
}

style_data_conditional = [
    {
        'if': {
            'filter_query': '{ranking} <= 3',
            'column_id': 'cum_log_return_pct'
        },
        'color': 'white',
        'backgroundColor': 'mediumseagreen',
        'fontWeight': 'bold'
    },
    {
        'if': {
            'filter_query': '{ranking} > 23',
            'column_id': 'cum_log_return_pct'
        },
        'color': 'white',
        'backgroundColor': '#FF4136',
        'fontWeight': 'bold'
    }
]

style_cell_conditional= [{
        'if': {'column_id': 'symbol'},
        'textAlign': 'left'
}]

css = [{
    'selector': '.dash-table-tooltip',
    'rule': 'background-color: dodgerblue ; color: white'
}]

### Layout a Web Page
app.layout = dbc.Container(
    [
        dbc.Row([
            html.H3('GMO Coin: Cryptocurrencies by Cumulative Log Return'),
            html.H5('Dash DataTable Conditional Formatting Highlight Cells'),
        ]),
        dbc.Row(html.Br()),

        dbc.Row(
            dash_table.DataTable(
                id='dt',
                data=data,
                columns=columns,
                style_header=style_header,
                style_data=style_data,
                style_cell_conditional=style_cell_conditional,
                style_data_conditional=style_data_conditional,
                css=css,
            ),
        ),
        dbc.Row(html.Br()),

    ], # fluid=False,
)

### Run the server
if __name__ == '__main__':
    app.run_server(debug=True)
 図2
図2は、VS Codeの編集画面にプログラムのソースコードが表示されている画面です。
図2
図2は、VS Codeの編集画面にプログラムのソースコードが表示されている画面です。
-
プログラムを起動してブラウザにアプリを表示する
VS Codeの右上から「▶」ボタンをクリックしてアプリを起動します。
以下、手順は図の説明で解説します。
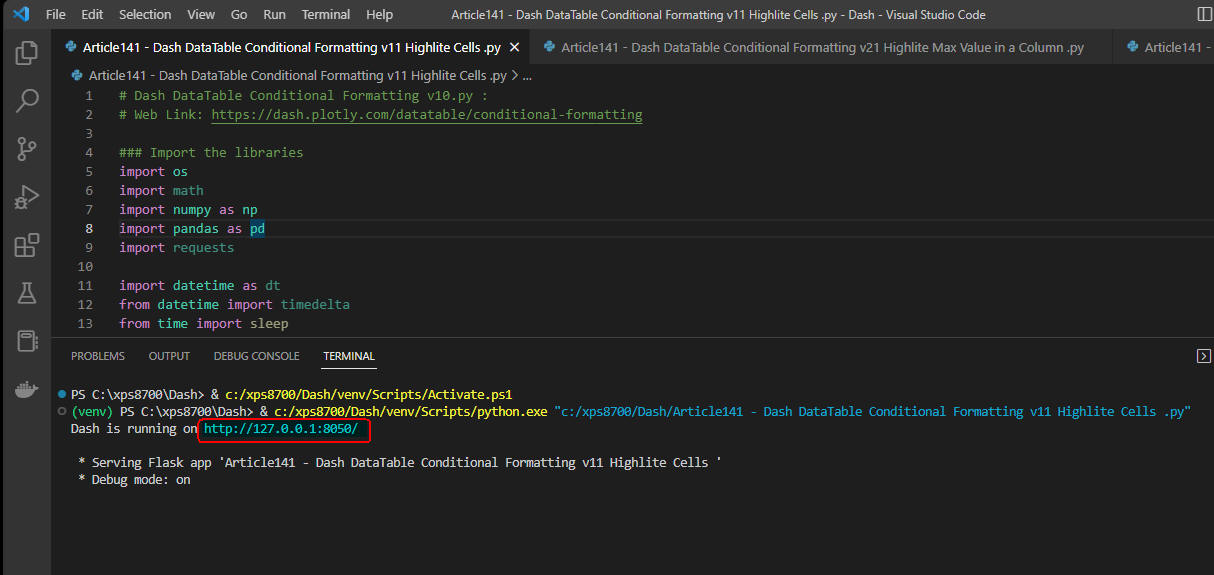 図3-1
アプリが起動すると「Dash is running on http://....」のメッセージが表示されます。
[Ctrl]を押しながらマウスで「URL」のリンクをクリックします。
しばらくすると、デフォルトのブラウザにアプリのWebページが表示されます。
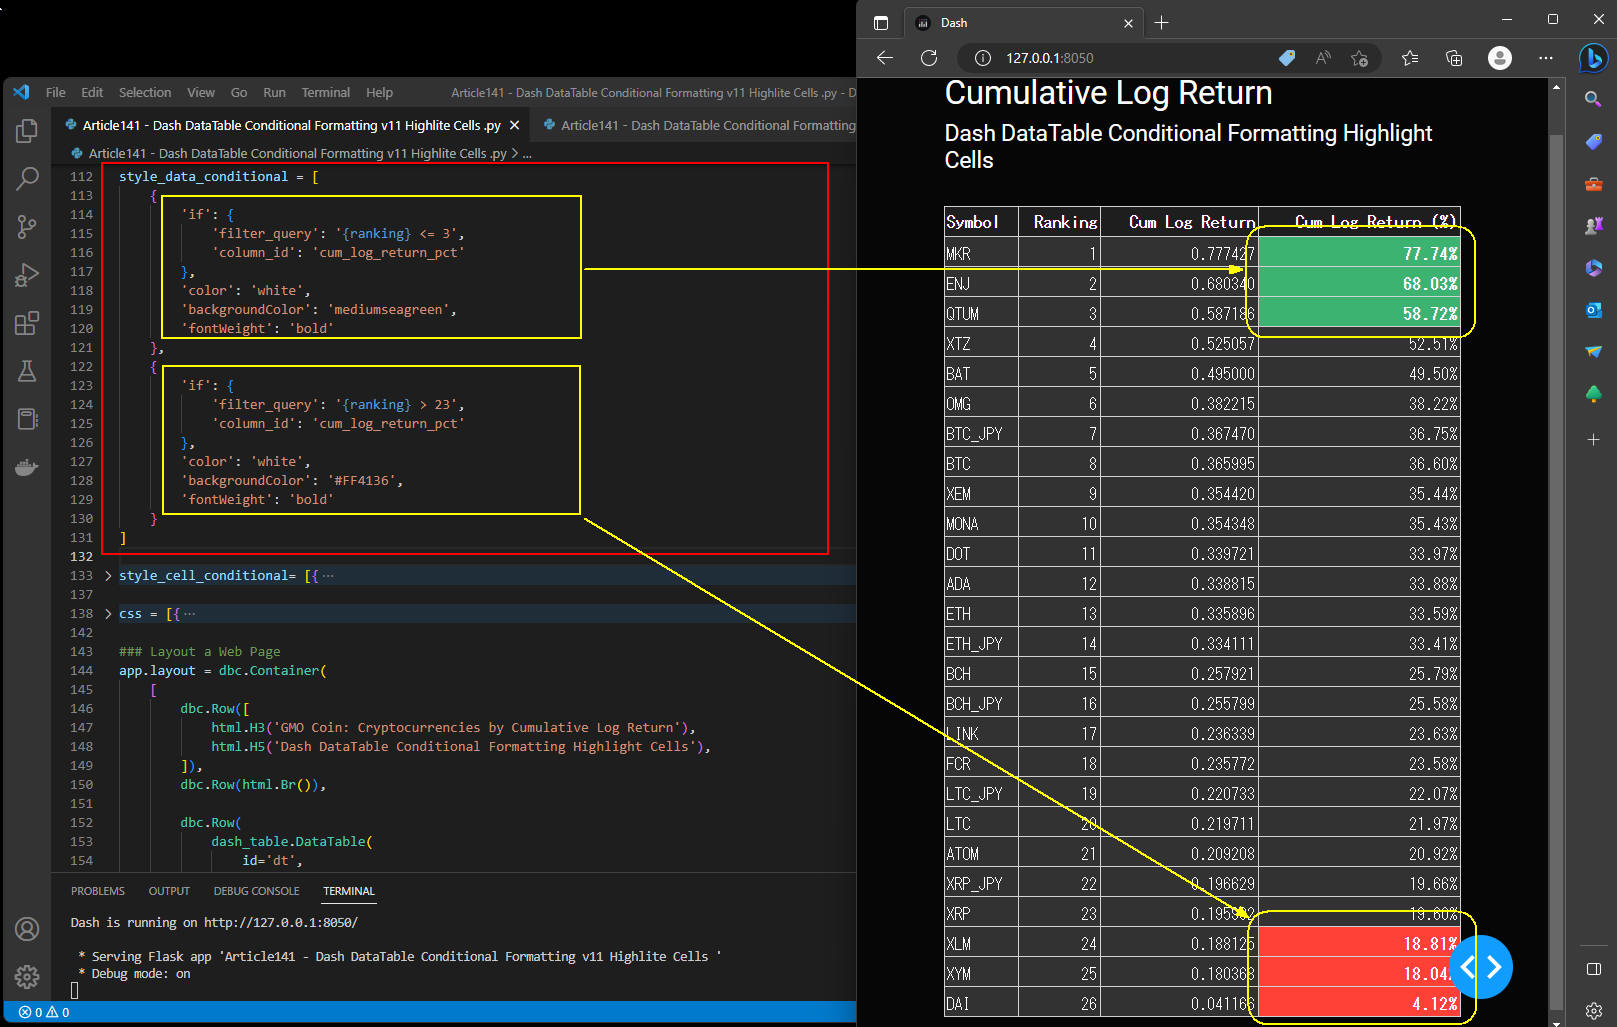 図3-2
図3-2には、ブラウザ(MS Edge)にアプリのWebページが表示されています。
Webページには、GMOコインの全ての仮想通貨(コイン)のシンボル、ランキング、累積リターン(収益率)が表示されています。
さらに、ランキングが1位から3位の仮想通貨と23位以上の仮想通貨をハイライトさせています。
1位から3位までは背景色を「緑色」、23位以上は「オレンジ色」でハイライトしています。
図3-2
図3-2には、ブラウザ(MS Edge)にアプリのWebページが表示されています。
Webページには、GMOコインの全ての仮想通貨(コイン)のシンボル、ランキング、累積リターン(収益率)が表示されています。
さらに、ランキングが1位から3位の仮想通貨と23位以上の仮想通貨をハイライトさせています。
1位から3位までは背景色を「緑色」、23位以上は「オレンジ色」でハイライトしています。
-
収益率が最大値(Max)の仮想通貨をハイライトする
ここでは、収益率が最大値のコインをハイライトさせています。
PandasのDataFrameから特定のカラム「cum_log_return」の最大値を取得するには「max()」メソッドを使用します。
DashのDataTableから特定の行を絞り込むには「filter_query」を使用します。
ここでは「cum_log_return_pct」のカラムに「filter_query」を適用して行を絞り込んでいます。
「'column_id': 'cum_log_return_pct'」を追加すると、該当するセルのみハイライトされます。
「'column_id': 'cum_log_return_pct'」を省略すると、行がハイライトされます。
以下にソースコードの一部を掲載しています。
変更箇所を「オレンジ色」でハイライトさせています。
### Instantiate Dash Class
app = Dash(__name__, external_stylesheets=[dbc.themes.CYBORG])

data = df.to_dict('records')

log_return = FormatTemplate.Format(precision=6, scheme=Scheme.fixed)
log_return_pct = FormatTemplate.percentage(2)

columns = [
    dict(id='symbol', name='Symbol', type='text'),
    dict(id='cum_log_return', name='Cum Log Return', type='numeric', deletable=False, format=log_return),
    dict(id='cum_log_return_pct', name='Cum Log Return (%)', type='numeric', format=log_return_pct)
]

style_header = {
    'backgroundColor': 'rgb(30, 30, 30)',
    'color': 'white',
    'fontWeight': 'bold'
}

style_data = {
    'backgroundColor': 'rgb(50, 50, 50)',
    'color': 'white'
}

style_data_conditional = [
    {
        'if': {
            'filter_query': '{{cum_log_return_pct}} = {}'.format(df['cum_log_return'].max()),
            # 'filter_query': 'cum_log_return_pct = 999'
            'column_id': 'cum_log_return_pct'
        },
        'backgroundColor': '#FF4136',
        'color': 'white'
    },
]

style_cell_conditional= [{
        'if': {'column_id': 'symbol'},
        'textAlign': 'left'
}]

### Layout a Web Page
app.layout = dbc.Container(
    [
        dbc.Row([
            html.H3('GMO Coin: Cryptocurrencies by Cumulative Log Return'),
            html.H5('Highlighting the Max Value in a Column'),
        ]),
        dbc.Row(html.Br()),

        dbc.Row(
            dash_table.DataTable(
                id='dt',
                data=data,
                columns=columns,
                style_header=style_header,
                style_data=style_data,
                style_cell_conditional=style_cell_conditional,
                style_data_conditional=style_data_conditional,
            ),
        ),
        dbc.Row(html.Br()),

    ], # fluid=False,
)

### Run the server
if __name__ == '__main__':
    app.run_server(debug=True)
 図4
図4には累積リターンが最大値(77.74%)のセルがハイライトされています。
行全体をハイライトさせるときは「'column_id': 'cum_log_return_pct'」をコメントにしてください。
図4
図4には累積リターンが最大値(77.74%)のセルがハイライトされています。
行全体をハイライトさせるときは「'column_id': 'cum_log_return_pct'」をコメントにしてください。
-
収益率の最小値(Min)の仮想通貨をハイライトする
ここでは、収益率が最小値のコインをハイライトさせています。
PandasのDataFrameから特定のカラム「cum_log_return」の最小値を取得するには「min()」メソッドを使用します。
DashのDataTableから特定の行を絞り込むには「filter_query」を使用します。
ここでは「cum_log_return_pct」のカラムに「filter_query」を適用して行を絞り込んでいます。
「'column_id': 'cum_log_return_pct'」をコメントにして行全体をハイライトさせています。
以下にソースコードの一部を掲載しています。
変更箇所を「オレンジ色」でハイライトさせています。
### Instantiate Dash Class
app = Dash(__name__, external_stylesheets=[dbc.themes.CYBORG])   # BOOTSTRAP

data = df.to_dict('records')

log_return = FormatTemplate.Format(precision=6, scheme=Scheme.fixed)
log_return_pct = FormatTemplate.percentage(2)

columns = [
    dict(id='symbol', name='Symbol', type='text'),
    dict(id='cum_log_return', name='Cum Log Return', type='numeric', deletable=False, format=log_return),
    dict(id='cum_log_return_pct', name='Cum Log Return (%)', type='numeric', format=log_return_pct)
]

style_header = {
    'backgroundColor': 'rgb(30, 30, 30)',
    'color': 'white',
    'fontWeight': 'bold'
}

style_data = {
    'backgroundColor': 'rgb(50, 50, 50)',
    'color': 'white'
}

style_data_conditional = [
    {
        'if': {
            'filter_query': '{{cum_log_return_pct}} = {}'.format(df['cum_log_return'].min()),
            # 'filter_query': 'cum_log_return_pct = 999'
        },
        'backgroundColor': '#FF4136',
        'color': 'white'
    },
]

style_cell_conditional= [{
        'if': {'column_id': 'symbol'},
        'textAlign': 'left'
}]

### Layout the Web Page#
app.layout = dbc.Container(
    [
        dbc.Row([
            html.H3('GMO Coin: Cryptocurrencies by Cumulative Log Return'),
            html.H5('Highlighting a Row with the Min Value'),
        ]),
        dbc.Row(html.Br()),

        dbc.Row(
            dash_table.DataTable(
                id='dt',
                data=data,
                columns=columns,
                style_header=style_header,
                style_data=style_data,
                style_cell_conditional=style_cell_conditional,
                style_data_conditional=style_data_conditional,
            ),
        ),
        dbc.Row(html.Br()),

    ], # fluid=False,
)

### Run the server
if __name__ == '__main__':
    app.run_server(debug=True)
 図5
図5には累積リターンが最小値(4.12%)の行がハイライトされています。
行全体をハイライトさせるときは「'column_id': 'cum_log_return_pct'」をコメントにします。
図5
図5には累積リターンが最小値(4.12%)の行がハイライトされています。
行全体をハイライトさせるときは「'column_id': 'cum_log_return_pct'」をコメントにします。
-
収益率の上位3位までと下位3位までの仮想通貨をハイライトする
ここでは、仮想通貨の収益率の上位3位までと、下位3位までをハイライトさせています。
PandasのDataFrameから上位3位までの仮想通貨を絞り込むには「nlargest()」メソッドを使用します。
上位3位まで絞り込むには、引数に「3」を指定します。
下位3位までの仮想通貨を絞り込むには「nsmallest()」メソッドを使用します。
下位3位まで絞り込むには、引数に「3」を指定します。
nlargest(), nsmallest()メソッドからは、収益率がDataFrameに格納されて戻り値として返されます。
DashのDataTableから特定の行を絞り込むには「filter_query」を使用します。
ここでは、カラム「cum_log_return_pct」に「filter_qeury」を適用して行を絞り込んでいます。
「'column_id': 'cum_log_return_pct'」を追加すると、該当するセルがハイライトされます。
「'column_id': 'cum_log_return_pct'」を省略すると、行全体がハイライトされます。
以下にソースコードの一部を掲載しています。
変更箇所を「オレンジ色」でハイライトさせています。
### Instantiate Dash Class
app = Dash(__name__, external_stylesheets=[dbc.themes.CYBORG])

data = df.to_dict('records')

log_return = FormatTemplate.Format(precision=6, scheme=Scheme.fixed)
log_return_pct = FormatTemplate.percentage(2)

columns = [
    dict(id='symbol', name='Symbol', type='text'),
    dict(id='cum_log_return', name='Cum Log Return', type='numeric', deletable=False, format=log_return),
    dict(id='cum_log_return_pct', name='Cum Log Return (%)', type='numeric', format=log_return_pct)
]

style_header = {
    'backgroundColor': 'rgb(30, 30, 30)',
    'color': 'white',
    'fontWeight': 'bold'
}

style_data = {
    'backgroundColor': 'rgb(50, 50, 50)',
    'color': 'white'
}

style_data_conditional = (
    [
        {
            'if': {
                'filter_query': '{{cum_log_return_pct}} = {}'.format(i),
                # 'filter_query': 'cum_log_return_pct = 0.999999',
                'column_id': 'cum_log_return_pct',
            },
            'backgroundColor': 'mediumseagreen',
            'color': 'white'
        }
        for i in df['cum_log_return_pct'].nlargest(3)
        # i=77.74,...
    ] +
    [
        {
            'if': {
                'filter_query': '{{cum_log_return_pct}} = {}'.format(i),
                # 'filter_query': 'cum_log_return_pct = 0.1111111',
                'column_id': 'cum_log_return_pct',
            },
            'backgroundColor': '#FF4136',
            'color': 'white'
        }
        for i in df['cum_log_return_pct'].nsmallest(3)
        # i=4.12,...
    ]
)

style_cell_conditional= [{
        'if': {'column_id': 'symbol'},
        'textAlign': 'left'
}]

### Layout the Web Page#
app.layout = dbc.Container(
    [
        dbc.Row([
            html.H3('GMO Coin: Cryptocurrencies by Cumulative Log Return'),
            html.H5('Highlighting the Top Three or Bottom Three Values in a Column'),
        ]),
        dbc.Row(html.Br()),

        dbc.Row(
            dash_table.DataTable(
                id='dt',
                data=data,
                columns=columns,
                style_header=style_header,
                style_data=style_data,
                style_cell_conditional=style_cell_conditional,
                style_data_conditional=style_data_conditional,
            ),
        ),
        dbc.Row(html.Br()),

    ], # fluid=False,
)

### Run the server
if __name__ == '__main__':
    app.run_server(debug=True)
 図6
図6には、仮想通貨の累積リターンの上位3位までと、下位3位までをハイライトさせています。
ここでは、「'column_id': 'cum_log_return_pct'」を指定してセルをハイライトさせています。
図6
図6には、仮想通貨の累積リターンの上位3位までと、下位3位までをハイライトさせています。
ここでは、「'column_id': 'cum_log_return_pct'」を指定してセルをハイライトさせています。
-
収益率の上位10%の仮想通貨をハイライトする
ここでは、仮想通貨の累積リターンの上位10%を選択してセルをハイライトさせています。
PandasのDataFrameから上位10%のレコードを絞り込むには「quantile()」メソッドを使用します。
このメソッドの引数にはパーセント(%)を指定します。
「0.5」を指定すると50%、「0.9」を指定すると上位10%、「0.1」を指定すると下位10%のレコードを絞り込みます。
ここでは、引数に「0.9」を指定して上位10%の仮想通貨を絞り込んでいます。
「quantile()」メソッドは、戻り値としてDataFrameを返します。
DataFrameの「items()」メソッドでは、DataFrameのカラム名と値を取得しています。
変数「col」には、カラム名「cum_log_return_pct」が格納されます。
変数「value」には、累積リターンの上位10%の数値がPandasのSeriesとして格納されます。
DashのDataTableから特定の行を絞り込むには「filter_query」を使用します。
上位10%に該当する仮想通貨は3コインあるので、
「'filter_query': '{cum_log_return} >= 0.999'」のような絞り込みが3回実行されます。
以下にソースコードの一部を掲載しています。
変更箇所を「オレンジ色」でハイライトさせています。
### Instantiate Dash Class
app = Dash(__name__, external_stylesheets=[dbc.themes.CYBORG])

data = df.to_dict('records')

log_return = FormatTemplate.Format(precision=6, scheme=Scheme.fixed)
log_return_pct = FormatTemplate.percentage(2)

columns = [
    dict(id='symbol', name='Symbol', type='text'),
    dict(id='cum_log_return', name='Cum Log Return', type='numeric', deletable=False, format=log_return),
    dict(id='cum_log_return_pct', name='Cum Log Return (%)', type='numeric', format=log_return_pct)
]

style_header = {
    'backgroundColor': 'rgb(30, 30, 30)',
    'color': 'white',
    'fontWeight': 'bold'
}

style_data = {
    'backgroundColor': 'rgb(50, 50, 50)',
    'color': 'white'
}

style_data_conditional = [
    {
        'if': {
            'filter_query': '{{{}}} >= {}'.format(col, value),
            # 'filter_query': '{cum_log_return} >= 0.99999',
            'column_id': 'cum_log_return_pct'
            # 'column_id': col
        },
        'backgroundColor': 'mediumseagreen',
        'color': 'white'
    } for (col, value) in df.quantile(0.9).items()  # top 10 % : quantile(0.5) => average
]

style_cell_conditional = [{
        'if': {'column_id': 'symbol'},
        'textAlign': 'left'
}]

### Layout a Web Page
app.layout = dbc.Container(
    [
        dbc.Row([
            html.H3('GMO Coin: Cryptocurrencies by Cumulative Log Return'),
            html.H5('Highlighting Top 10 Percent of Values by Column'),
        ]),
        dbc.Row(html.Br()),

        dbc.Row(
            dash_table.DataTable(
                id='dt',
                data=data,
                columns=columns,
                style_header=style_header,
                style_data=style_data,
                style_cell_conditional=style_cell_conditional,
                style_data_conditional=style_data_conditional,
            ),
        ),
        dbc.Row(html.Br()),

    ], # fluid=False,
)

### Run the server
if __name__ == '__main__':
    app.run_server(debug=True)
 図7
図7には、累積リターンの上位10%に該当するコイン(MKR, ENJ, QTUM)がハイライトされて表示されています。
図7
図7には、累積リターンの上位10%に該当するコイン(MKR, ENJ, QTUM)がハイライトされて表示されています。
-
収益率の下位10%の仮想通貨をハイライトする
ここでは、仮想通貨の累積リターンの下位10%を選択してセルをハイライトさせています。
PandasのDataFrameから下位10%のレコードを絞り込むには「quantile()」メソッドを使用します。
このメソッドの引数にはパーセント(%)を指定します。
「0.5」を指定すると50%、「0.9」を指定すると上位10%、「0.1」を指定すると下位10%のレコードを絞り込みます。
ここでは、引数に「0.1」を指定して下位10%の仮想通貨を絞り込んでいます。
「quantile()」メソッドは、戻り値としてDataFrameを返します。
DataFrameの「items()」メソッドでは、DataFrameのカラム名と値を取得しています。
変数「col」には、カラム名「cum_log_return_pct」が格納されます。
変数「value」には、累積リターンの下位10%の数値がPandasのSeriesとして格納されます。
DashのDataTableから特定の行を絞り込むには「filter_query」を使用します。
上位10%に該当する仮想通貨は3コインあるので、
「'filter_query': '{cum_log_return} <= 0.999'」のような絞り込みが3回実行されます。
以下にソースコードの一部を掲載しています。
変更箇所を「オレンジ色」でハイライトさせています。
### Instantiate Dash Class
app = Dash(__name__, external_stylesheets=[dbc.themes.CYBORG])

data = df.to_dict('records')

log_return = FormatTemplate.Format(precision=6, scheme=Scheme.fixed)
log_return_pct = FormatTemplate.percentage(2)

columns = [
    dict(id='symbol', name='Symbol', type='text'),
    dict(id='cum_log_return', name='Cum Log Return', type='numeric', deletable=False, format=log_return),
    dict(id='cum_log_return_pct', name='Cum Log Return (%)', type='numeric', format=log_return_pct)
]

style_header = {
    'backgroundColor': 'rgb(30, 30, 30)',
    'color': 'white',
    'fontWeight': 'bold'
}

style_data = {
    'backgroundColor': 'rgb(50, 50, 50)',
    'color': 'white'
}

style_data_conditional=[
    {
        'if': {
            'filter_query': '{{{}}} <= {}'.format(col, value),
            # 'filter_query': '{cum_log_return} <= 0.99999',
            'column_id': 'cum_log_return_pct'
            # 'column_id': col
        },
        'backgroundColor': '#FF4136',
        'color': 'white'
    } for (col, value) in df.quantile(0.1).items()  # bottom 10 % : quantile(0.5) => average
]

style_cell_conditional= [{
        'if': {'column_id': 'symbol'},
        'textAlign': 'left'
}]

### Layout a Web Page
app.layout = dbc.Container(
    [
        dbc.Row([
            html.H3('GMO Coin: Cryptocurrencies by Cumulative Log Return'),
            html.H5('Highlighting Bottom 10 Percent of Values by Column'),
        ]),
        dbc.Row(html.Br()),

        dbc.Row(
            dash_table.DataTable(
                id='dt',
                data=data,
                columns=columns,
                style_header=style_header,
                style_data=style_data,
                style_cell_conditional=style_cell_conditional,
                style_data_conditional=style_data_conditional,
            ),
        ),
        dbc.Row(html.Br()),

    ], # fluid=False,
)

### Run the server
if __name__ == '__main__':
    app.run_server(debug=True)
 図8
図8には、累積リターンの下位10%に該当するコイン(DAI, XYM, XLM)がハイライトされて表示されています。
図8
図8には、累積リターンの下位10%に該当するコイン(DAI, XYM, XLM)がハイライトされて表示されています。
-
仮想通貨の収益率をカラースケールさせて表示する
ここでは、仮想通貨の累積リターンの数値にカラースケールを適用させて表示しています。
累積リターンにカラースケールを適用すると、色の濃淡で数値の大小を把握させることができます。
カラースケールを適用するには、colorloverクラスの「scales()」メソッドを使用します。
引数の「seq」、「Purples」を書き換えるとカラースケールを変更することができます。
「Purples」を「Blues, Greens, Oranges, Reds」などに書き換えて実行して見てください。
以下にソースコードの一部を掲載しています。
変更箇所を「オレンジ色」でハイライトさせています。
### Instantiate Dash Class
app = Dash(__name__, external_stylesheets=[dbc.themes.CYBORG])

data = df.to_dict('records')

log_return = FormatTemplate.Format(precision=6, scheme=Scheme.fixed)
log_return_pct = FormatTemplate.percentage(2)

columns = [
    dict(id='symbol', name='Symbol', type='text'),
    dict(id='cum_log_return_int', name='Cum Log Return Int', type='numeric'),
    dict(id='cum_log_return_pct', name='Cum Log Return (%)', type='numeric', format=log_return_pct)
]

style_header = {
    'backgroundColor': 'rgb(30, 30, 30)',
    'color': 'white',
    'fontWeight': 'bold'
}

style_data = {
    'backgroundColor': 'rgb(50, 50, 50)',
    'color': 'white'
}

#######################################################################################
def discrete_background_color_bins(df: pd.DataFrame, columns: list, n_bins=5) -> tuple:
    bounds = [i * (1.0 / n_bins) for i in range(n_bins + 1)]
    # [0.0, 0.2, 0.4, 0.6, 0.8, 1.0]

    df_numeric_columns = df[columns]    # cum_log_return_int

    df_max = df_numeric_columns.max().max()
    df_min = df_numeric_columns.min().min()

    ranges = [((df_max - df_min) * i) + df_min for i in bounds]
    # [4.0, 18.6, 33.2, 47.8, 62.4, 77.0]

    styles = []
    legend = []

    for i in range(1, len(bounds)):
        min_bound = ranges[i - 1]
        max_bound = ranges[i]

        # Blues            seq
        # Greens           seq
        # Oranges          seq
        # Purples          seq
        # Reds             seq

        backgroundColor = colorlover.scales[str(n_bins+4)]['seq']['Purples'][2:-2][i - 1]
        color = 'black'

        # backgroundColor = colorlover.scales[str(n_bins+4)]['div']['RdYlGn'][2:-2][i - 1]
        # color = 'black'

        # backgroundColor = colorlover.scales[str(n_bins)]['seq']['Blues'][i - 1]
        # color = 'white' if i > len(bounds) / 2. else 'inherit'

        for column in df_numeric_columns:
            styles.append({
                'if': {
                    'filter_query': (
                        '{{{column}}} >= {min_bound}' +
                        (' && {{{column}}} < {max_bound}' if (i < len(bounds) - 1) else '')
                    ).format(column=column, min_bound=min_bound, max_bound=max_bound),
                    'column_id': column
                },
                # 'if': {'filter_query': '{cum_log_return_int} >= 4.0 && {cum_log_return_int} < 18.6', 'column_id': 'cum_log_return_int},
                'backgroundColor': backgroundColor,
                'color': color
                # 'backgroundColor': 'rgb(239,243,255)', 'color': 'inherit'
                # 'backgroundColor': 'rgb(8,81,156)', 'color': 'white'
            })

        legend.append(
            html.Div(style={'display': 'inline-block', 'width': '60px'}, children=[
                html.Div(
                    style={
                        'backgroundColor': backgroundColor,
                        'borderLeft': '1px rgb(50, 50, 50) solid',
                        'height': '10px'
                    }
                ),
                html.Small(round(min_bound, 2), style={'paddingLeft': '2px'})
            ])
        )

    return (styles, html.Div(legend, style={'padding': '5px 0 5px 0'}))

(style_data_conditional, legend) = discrete_background_color_bins(df, columns=['cum_log_return_int'], n_bins=5)

# style_data_conditional = [
#     {'if': {'filter_query': '{cum_log_return_int} >= 4.0 && {cum_log_return_int} < 18.6', 'column_id': 'cum_log_return_int'}, 'backgroundColor': 'rgb(239,243,255)', 'color': 'inherit'},
#     {'if': {'filter_query': '{cum_log_return_int} >= 18.6 && {cum_log_return_int} < 33.2', 'column_id': 'cum_log_return_int'}, 'backgroundColor': 'rgb(189,215,231)', 'color': 'inherit'},
#     :::
# ]

style_cell_conditional= [{
        'if': {'column_id': 'symbol'},
        'textAlign': 'left'
}]

### Layout a Web Page
app.layout = dbc.Container(
    [
        dbc.Row([
            html.H3('GMO Coin: Cryptocurrencies by Cumulative Log Return'),
            html.H5('Highlighting with a Colorscale on a Single Column'),
        ]),
        dbc.Row(html.Br()),

        dbc.Row(
            dash_table.DataTable(
                id='dt',
                data=data,
                columns=columns,
                style_header=style_header,
                style_data=style_data,
                style_cell_conditional=style_cell_conditional,
                style_data_conditional=style_data_conditional,
            ),
        ),
        dbc.Row(html.Br()),

    ], # fluid=False,
)

### Run the server
if __name__ == '__main__':
    app.run_server(debug=True)
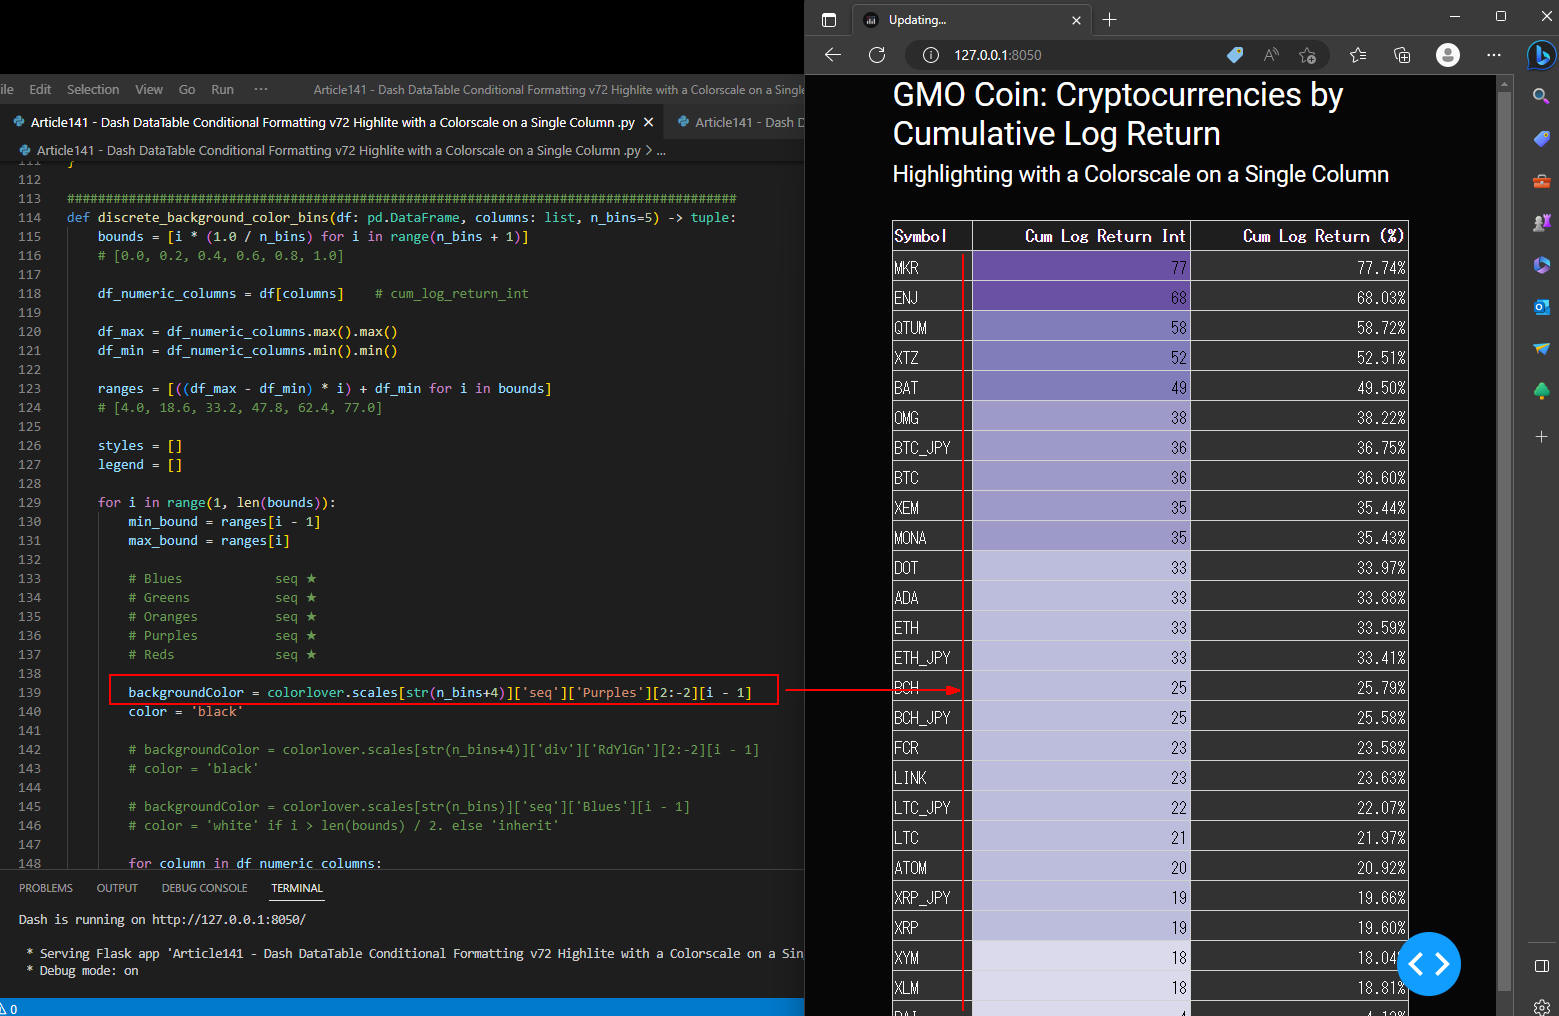 図9-1
図9には、仮想通貨の累積リターンがカラースケールされて表示されています。
色の濃淡で累積リターンの数値の大小が把握できるようになります。
ここでは、「Purples」を使用していますが、「Greens」「Oragnes」に書き換えて実行して見てください。
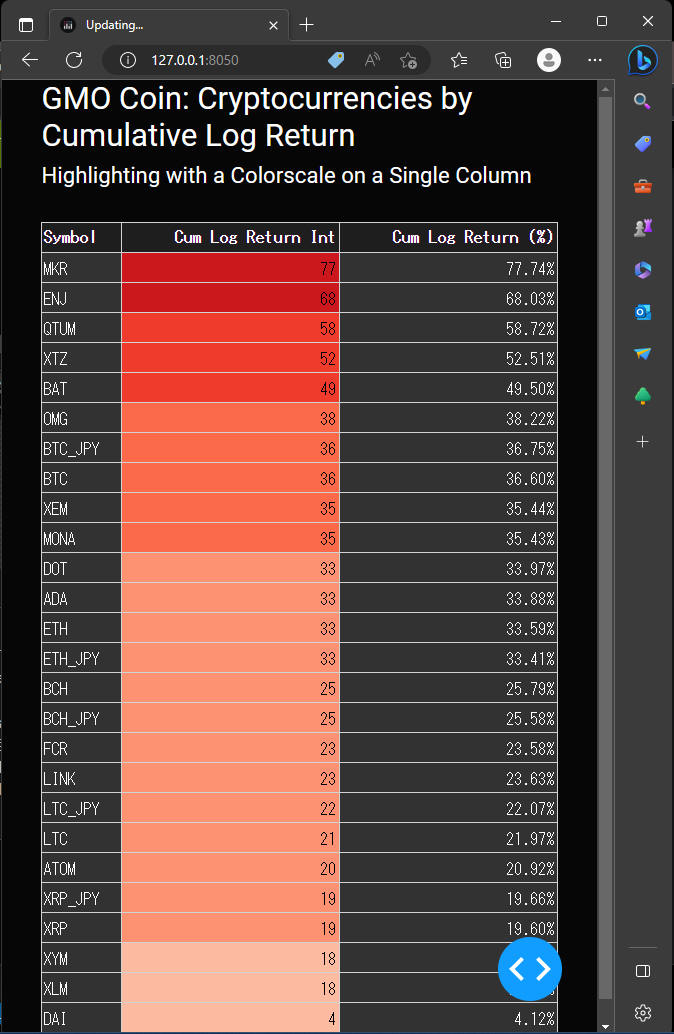 図9-2
図9-2では「Reds」を使用しています。
図9-2
図9-2では「Reds」を使用しています。
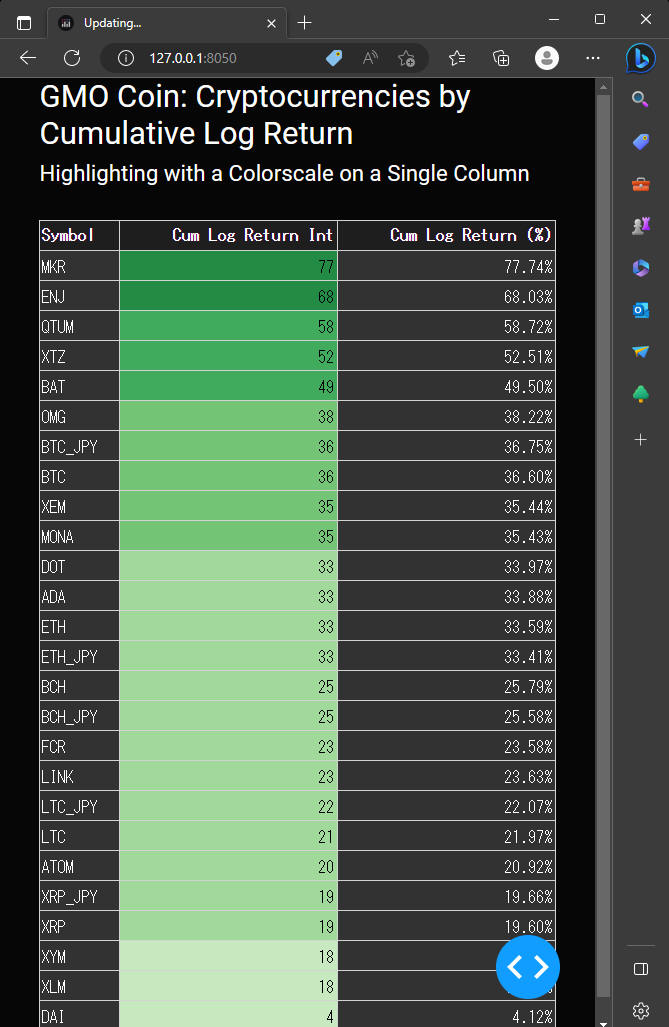 図9-3
図9-3では「Greens」を使用しています。
図9-3
図9-3では「Greens」を使用しています。
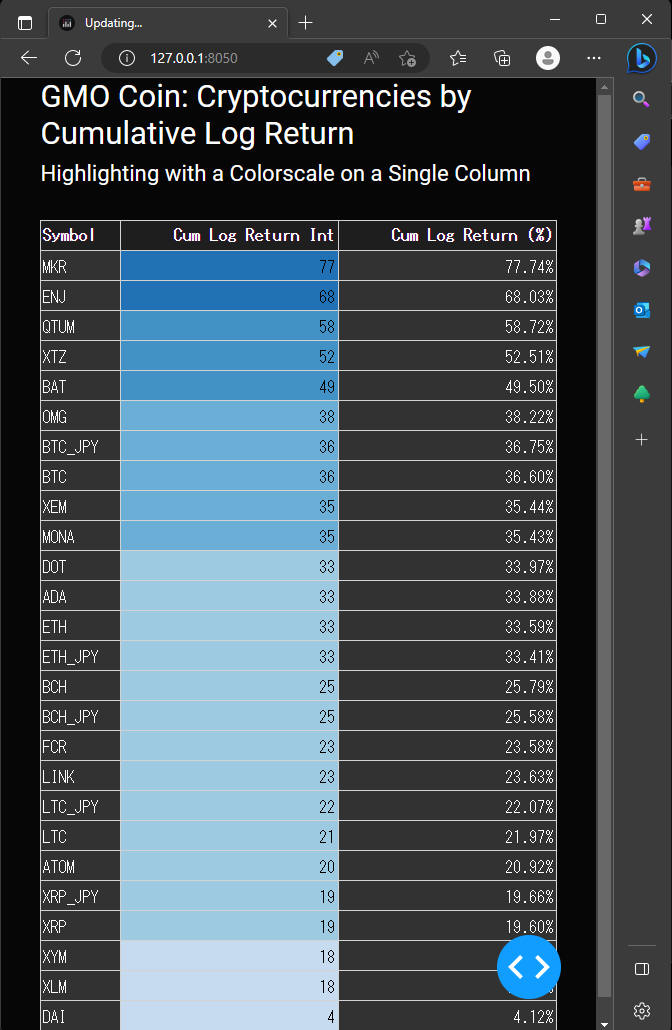 図9-4
図9-4では「Blues」を使用しています。
図9-4
図9-4では「Blues」を使用しています。
-
仮想通貨の収益率の「数値」と「棒グラフ(Right to Left)」を重ねて表示する
ここでは、CSSの「background: linear-gradient()」を使用して表のセルに数値と棒グラフを重ねて表示しています。
数値と棒グラフを重ねることにより、数値の大小が視覚化できるようになります。
linear-gradient()の引数には「direction or angle, color-stop1, color-stop2,...」を指定します。
引数1には、「direction」または「angle」を指定します。
directionを指定するときは「to right, to left, to top, to bottom」のように指定します。
angleを指定するときは「0deg, 90deg, 180deg, 270deg」のように指定します。
それぞれ、
0deg(to top), 90deg(to right), 180deg(to bottom), 270deg(to left)に対応します。
以下にソースコードの一部を掲載しています。
変更箇所を「オレンジ色」でハイライトさせています。
### Instantiate Dash Class
app = Dash(__name__, external_stylesheets=[dbc.themes.CYBORG])

data = df.to_dict('records')

log_return = FormatTemplate.Format(precision=6, scheme=Scheme.fixed)
log_return_pct = FormatTemplate.percentage(2)
log_return_float = FormatTemplate.Format(precision=6, scheme=Scheme.fixed)

columns = [
    dict(id='symbol', name='Symbol', type='text'),
    dict(id='cum_log_return_float', name='Cum Log Return Float', type='numeric', deletable=False, format=log_return_float),
    dict(id='cum_log_return_pct', name='Cum Log Return (%)', type='numeric', format=log_return_pct)
]

style_header = {
    'backgroundColor': 'rgb(30, 30, 30)',
    'color': 'white',
    'fontWeight': 'bold'
}

style_data = {
    'backgroundColor': 'rgb(50, 50, 50)',
    'color': 'white'
}


####################################################################################
def data_bars(df: pd.DataFrame, column: str, angle='90deg', direction=None) -> list:

    '''
    Linear Gradients (goes down/up/left/right/diagonally)
    Using Direction:
    background: linear-gradient(direction, color-stop1, color-stop2, ...);
    background: linear-gradient(to right, red , yellow);
    background: linear-gradient(to left, red , yellow);
    Using Angles:
    background: linear-gradient(angle, color-stop1, color-stop2);
    background: linear-gradient(0deg,   red, yellow); equivalent to "to top"
    background: linear-gradient(90deg,  red, yellow); equivalent to "to right"
    background: linear-gradient(180deg, red, yellow); equivalent to "to bottom"
    background: linear-gradient(270deg, red, yellow); equivalent to "to left"
    '''

    direction_or_angle = '90deg'
    if direction is None:
        direction_or_angle = angle      # 90deg, 270deg
    else:
        direction_or_angle = direction  # 'to right', 'to left'

    n_bins = 100

    bounds = [i * (1.0 / n_bins) for i in range(n_bins + 1)]

    ranges = [
        ((df[column].max() - df[column].min()) * i) + df[column].min()
        for i in bounds
    ]

    styles = []

    for i in range(1, len(bounds)):
        min_bound = ranges[i - 1]   # ranges[1-1] => ranges[0] : 4.0
        max_bound = ranges[i]       # ranges[1] : 4.73

        max_bound_percentage = bounds[i] * 100  # bounds[1] : 0.01

        styles.append({
            'if': {
                'filter_query': (
                    '{{{column}}} >= {min_bound}' +
                    (' && {{{column}}} < {max_bound}' if (i < len(bounds) - 1) else '')
                ).format(column=column, min_bound=min_bound, max_bound=max_bound),
                'column_id': column
            },

            # 'if': {
            #     'filter_query': '{cum_log_return_float} >= 4.11 && {cum_log_return_float} < 4.85',
            #     'column_id': 'cum_log_return_float'},

            # BAR: direction='to right', 'to left', angle='90deg', '270deg'
            'background': (
                '''
                    linear-gradient({direction_or_angle},
                    rgba(13, 230, 49, 0.2) 0%,
                    rgba(13, 230, 49, 0.2) {max_bound_percentage}%,
                    rgb(50, 50, 50) {max_bound_percentage}%,
                    rgb(50, 50, 50) 100%)
                '''.format(direction_or_angle=direction_or_angle, max_bound_percentage=max_bound_percentage)
            ),

            # 'background': (
            #     '''
            #        linear-gradient(to left,
            #        #0074D9 0%,
            #        #0074D9 1.0%,
            #        rgb(50, 50, 50) 1.0%,
            #        rgb(50, 50, 50) 100%)
            #     ''',

            'paddingBottom': 2,
            'paddingTop': 2
        })

    return styles

style_data_conditional = (data_bars(df, column='cum_log_return_float', direction='to left'))

# style_data_conditional = [
#     {
#         'if': {'filter_query': '{cum_log_return_float} >= 4.11 && {cum_log_return_float} < 4.85',
#                'column_id': 'cum_log_return_float'},
#             'background': '''
#                 linear-gradient(to left,
#                                 #0074D9 0%,
#                                 #0074D9 1.0%,
#                                 rgb(50, 50, 50) 1.0%,
#                                 rgb(50, 50, 50) 100%)
#                 ''',
#             'paddingBottom': 2,
#             'paddingTop': 2
#     },
#     :::
# ]

style_cell_conditional= [{
        'if': {'column_id': 'symbol'},
        'textAlign': 'left'
}]

### Layout a Web Page
app.layout = dbc.Container(
    [
        dbc.Row([
            html.H3('GMO Coin: Cryptocurrencies by Cumulative Log Return'),
            html.H5('Displaying Data Bars (Right to Left)'),
        ]),
        dbc.Row(html.Br()),

        dbc.Row(
            dash_table.DataTable(
                id='dt',
                data=data,
                columns=columns,
                style_header=style_header,
                style_data=style_data,
                style_cell_conditional=style_cell_conditional,
                style_data_conditional=style_data_conditional,
            ),
        ),
        dbc.Row(html.Br()),

    ], # fluid=False,
)

### Run the server
if __name__ == '__main__':
    app.run_server(debug=True)
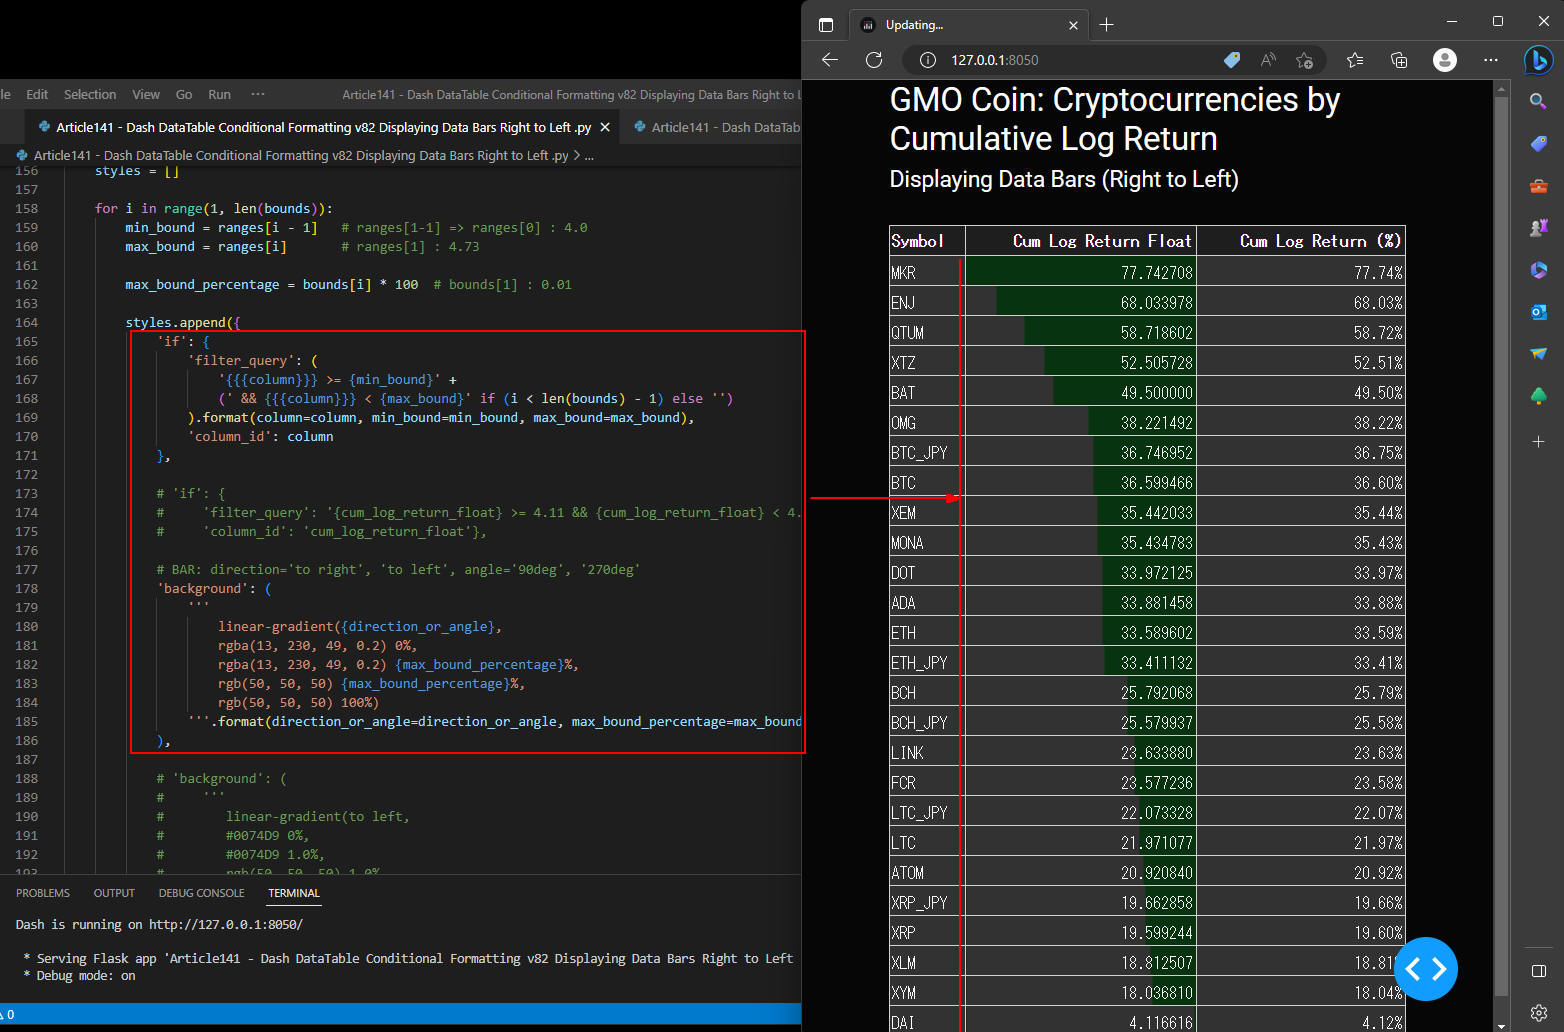 図10-1
図10-1には累積リターンの数値と棒グラフを同じセル内に表示しています。
棒グラフを表示することにより累積リターンの数値が視覚化されます。
ここでは、「Right to Left」の棒グラフを表示しています。
棒グラフの背景色には「rgba()」を使用しているので輝度(opaicty)で濃淡を調整できます。
図10-1
図10-1には累積リターンの数値と棒グラフを同じセル内に表示しています。
棒グラフを表示することにより累積リターンの数値が視覚化されます。
ここでは、「Right to Left」の棒グラフを表示しています。
棒グラフの背景色には「rgba()」を使用しているので輝度(opaicty)で濃淡を調整できます。
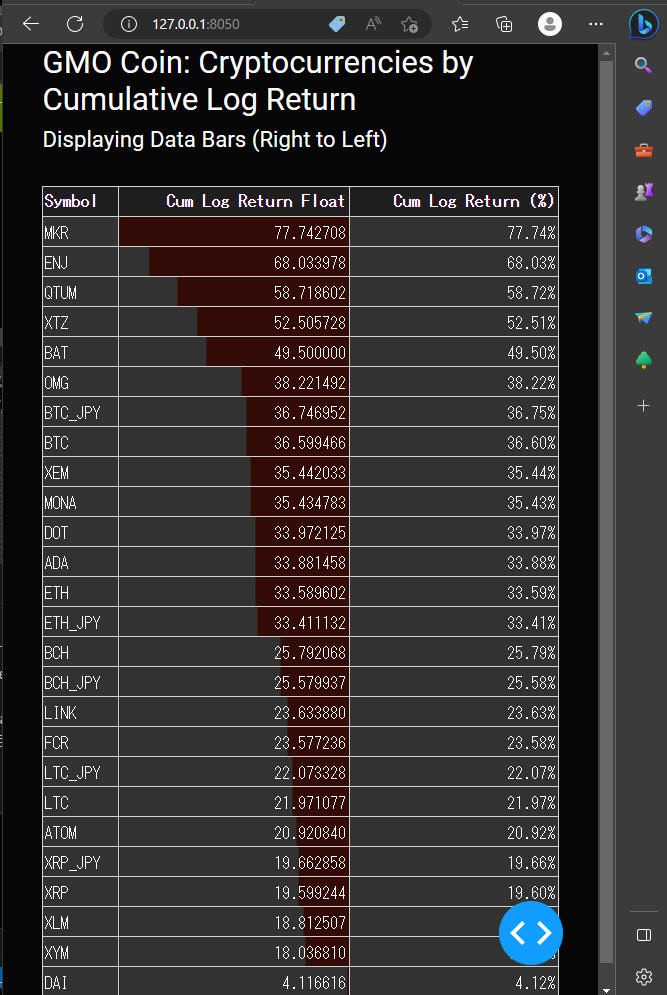 図10-2
図10-2では背景色に「rgba(230, 31, 7, 0.2) 0%」を使用しています。
図10-2
図10-2では背景色に「rgba(230, 31, 7, 0.2) 0%」を使用しています。
-
仮想通貨の収益率の「数値」と「棒グラフ(Left to Right)」を重ねて表示する
ここでは、CSSの「background: linear-gradient()」を使用して表のセルに数値と棒グラフを重ねて表示しています。
数値と棒グラフを重ねることにより、数値の大小が視覚化できるようになります。
linear-gradient()の引数には「direction or angle, color-stop1, color-stop2,...」を指定します。
引数1には、「direction」または「angle」を指定します。
ここでは「angle(90deg)」を指定して「Left to Right」の棒グラフを表示しています。
以下にソースコードの一部を掲載しています。
変更箇所を「オレンジ色」でハイライトさせています。
### Instantiate Dash Class
app = Dash(__name__, external_stylesheets=[dbc.themes.CYBORG])

data = df.to_dict('records')

log_return = FormatTemplate.Format(precision=6, scheme=Scheme.fixed)
log_return_pct = FormatTemplate.percentage(2)
log_return_float = FormatTemplate.Format(precision=6, scheme=Scheme.fixed)

columns = [
    dict(id='symbol', name='Symbol', type='text'),
    dict(id='cum_log_return_float', name='Cum Log Return Float', type='numeric', deletable=False, format=log_return_float),
    dict(id='cum_log_return_pct', name='Cum Log Return (%)', type='numeric', format=log_return_pct)
]

style_header = {
    'backgroundColor': 'rgb(30, 30, 30)',
    'color': 'white',
    'fontWeight': 'bold'
}

style_data = {
    'backgroundColor': 'rgb(50, 50, 50)',
    'color': 'white'
}

####################################################################################
def data_bars(df: pd.DataFrame, column: str, angle='90deg', direction=None) -> list:

    '''
    Linear Gradients (goes down/up/left/right/diagonally)
    Using Direction:
    background: linear-gradient(direction, color-stop1, color-stop2, ...);
    background: linear-gradient(to right, red , yellow);
    background: linear-gradient(to left, red , yellow);
    Using Angles:
    background: linear-gradient(angle, color-stop1, color-stop2);
    background: linear-gradient(0deg,   red, yellow); equivalent to "to top"
    background: linear-gradient(90deg,  red, yellow); equivalent to "to right"
    background: linear-gradient(180deg, red, yellow); equivalent to "to bottom"
    background: linear-gradient(270deg, red, yellow); equivalent to "to left"
    '''

    direction_or_angle = '90deg'
    if direction is None:
        direction_or_angle = angle      # 90deg, 270deg
    else:
        direction_or_angle = direction  # 'to right', 'to left'

    n_bins = 100

    bounds = [i * (1.0 / n_bins) for i in range(n_bins + 1)]

    ranges = [
        ((df[column].max() - df[column].min()) * i) + df[column].min()
        for i in bounds
    ]

    styles = []

    for i in range(1, len(bounds)):
        min_bound = ranges[i - 1]   # ranges[1-1] => ranges[0] : 4.0
        max_bound = ranges[i]       # ranges[1] : 4.73

        max_bound_percentage = bounds[i] * 100  # bounds[1] : 0.01

        styles.append({
            'if': {
                'filter_query': (
                    '{{{column}}} >= {min_bound}' +
                    (' && {{{column}}} < {max_bound}' if (i < len(bounds) - 1) else '')
                ).format(column=column, min_bound=min_bound, max_bound=max_bound),
                'column_id': column # 'cum_log_return_int'
            },
            # BAR: direction='to right', 'to left', angle='90deg', '270deg'
            'background': (
                """
                    linear-gradient({direction_or_angle},
                    #0074D9 0%,
                    #0074D9 {max_bound_percentage}%,
                    rgb(50, 50, 50) {max_bound_percentage}%,
                    rgb(50, 50, 50) 100%)
                """.format(direction_or_angle=direction_or_angle, max_bound_percentage=max_bound_percentage)
            ),
            'paddingBottom': 2,
            'paddingTop': 2
        })

    return styles


style_data_conditional = (data_bars(df, column='cum_log_return_float', angle='90deg'))

style_cell_conditional= [{
        'if': {'column_id': 'symbol'},
        'textAlign': 'left'
}]

### Layout a Web Page
app.layout = dbc.Container(
    [
        dbc.Row([
            html.H3('GMO Coin: Cryptocurrencies by Cumulative Log Return'),
            html.H5('Displaying Data Bars (Left to Right)'),
        ]),
        dbc.Row(html.Br()),

        dbc.Row(
            dash_table.DataTable(
                id='dt',
                data=data,
                columns=columns,
                style_header=style_header,
                style_data=style_data,
                style_cell_conditional=style_cell_conditional,
                style_data_conditional=style_data_conditional,
            ),
        ),
        dbc.Row(html.Br()),

    ], # fluid=False,
)

### Run the server
if __name__ == '__main__':
    app.run_server(debug=True)
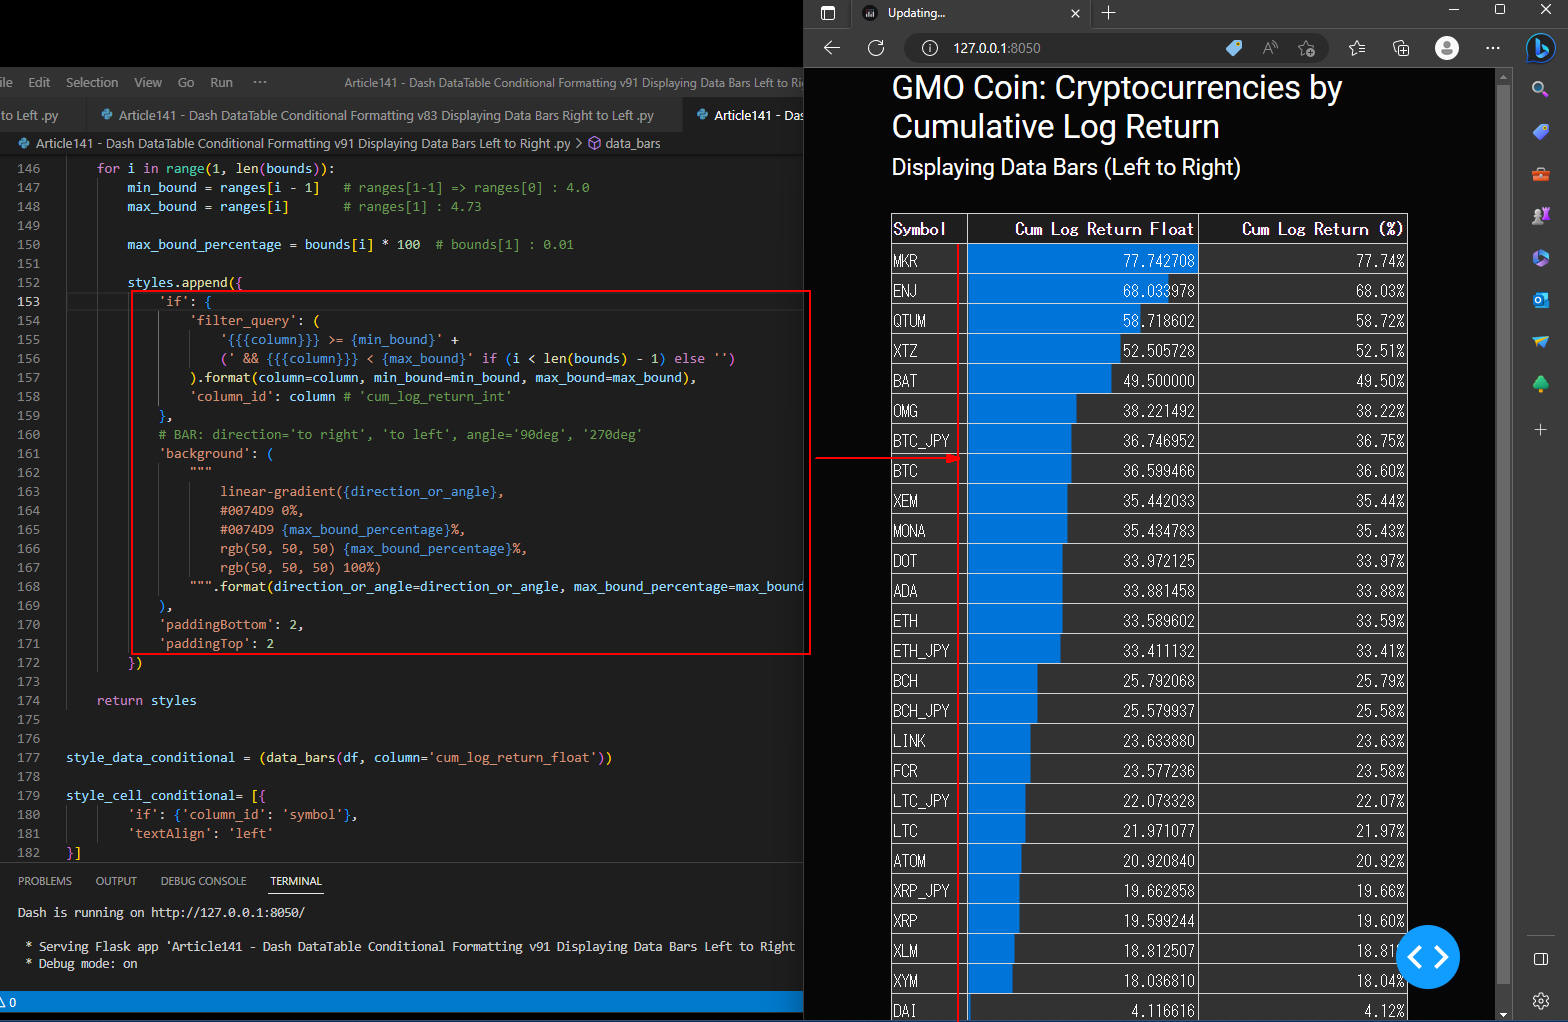 図11-1
図11-1には累積リターンの数値と棒グラフを同じセル内に表示しています。
棒グラフを表示することにより累積リターンの数値が視覚化されます。
ここでは、Angleに「90deg」を指定して「Left to Right」の棒グラフを表示しています。
図11-1
図11-1には累積リターンの数値と棒グラフを同じセル内に表示しています。
棒グラフを表示することにより累積リターンの数値が視覚化されます。
ここでは、Angleに「90deg」を指定して「Left to Right」の棒グラフを表示しています。
棒グラフの背景色には「rgba()」を使用しているので輝度(opaicty)で濃淡を調整できます。
数値と棒グラフが重なるのを可能な限り避けるには「Left to Right」を選択してください。
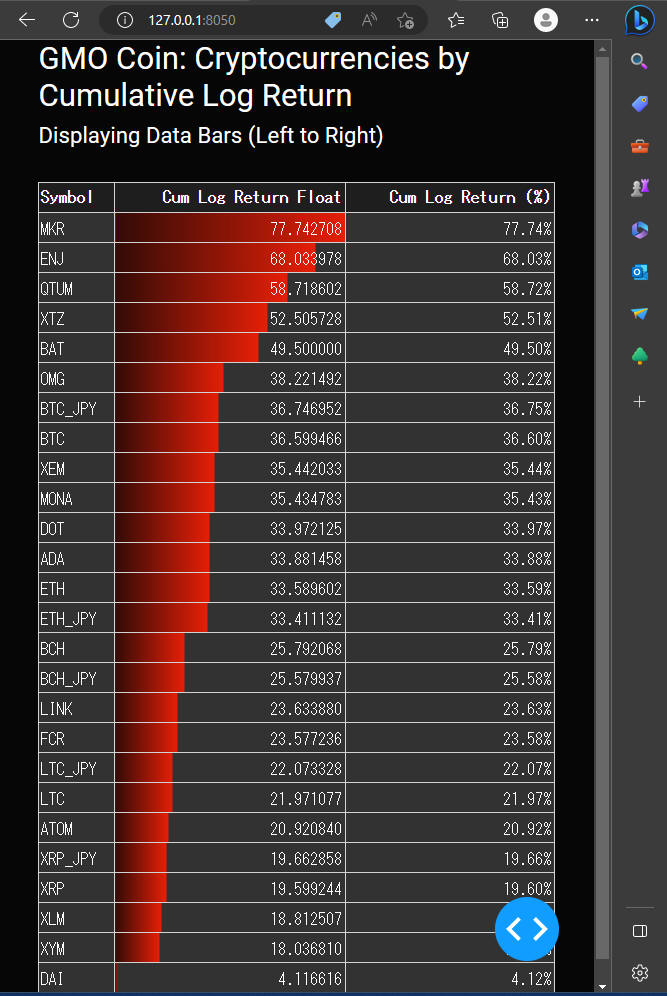 図11-2
図11-2では、背景色に「rgba(230, 31, 7, 0.2) 0%」を使用しています。
図11-2
図11-2では、背景色に「rgba(230, 31, 7, 0.2) 0%」を使用しています。
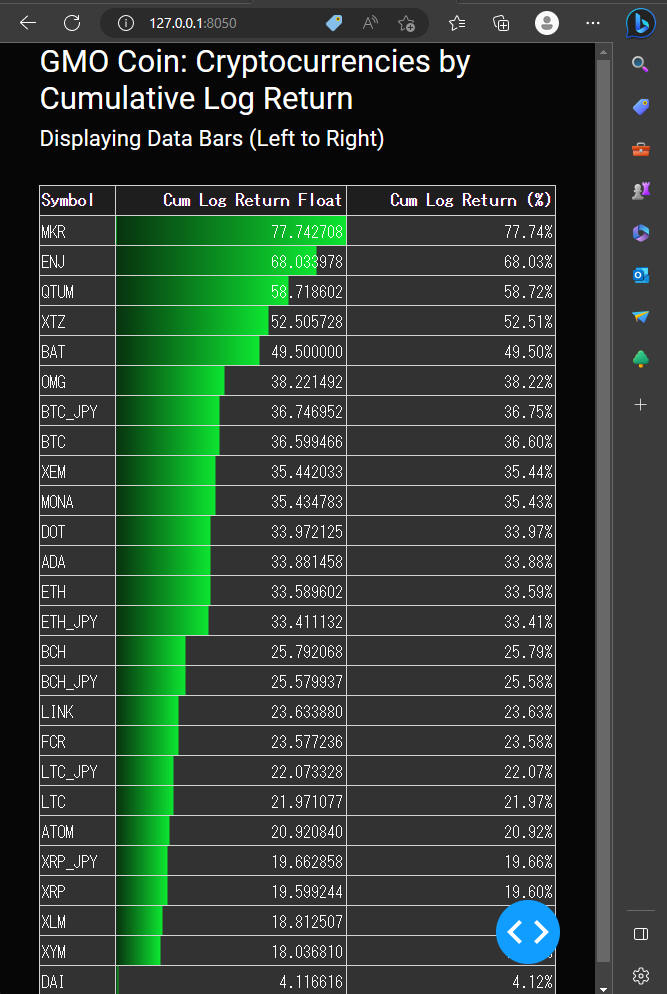 図11-3
図11-3では背景色に「rgba(13, 230, 49, 0.2) 0%」を使用しています。
図11-3
図11-3では背景色に「rgba(13, 230, 49, 0.2) 0%」を使用しています。
-
最終版の全てのコードを掲載
ここでは、最終版のプログラムのソースコードと、 ライブラリのソースコードを掲載しています。
リスト2: Article141.py
# Dash DataTable Conditional Formatting v91.py :
# Web Link: https://dash.plotly.com/datatable/conditional-formatting

### Import the libraries
import os
import math
import numpy as np
import pandas as pd
import requests

import datetime as dt
from datetime import timedelta
from time import sleep

from dash import Dash, dash_table, html, Output, Input, State, dcc, ctx
from dash.dash_table import DataTable, FormatTemplate
from dash.dash_table.Format import Format, Scheme, Align, Trim
import dash_bootstrap_components as dbc
import colorlover

from lib.com_lib import get_data, calculate_cum_log_return
from lib.gmo_api import get_crypto, get_crypto_symbols

import warnings
warnings.simplefilter('ignore')

#################################
# Main
#################################

### Load the data from gmo coin

# get all symbols from gmo coin
df = get_crypto_symbols()
symbols = df['symbol'].values.tolist()

interval = '1day'
date_list = ['2020','2021','2022','2023']

symbol_list = []
cum_log_return_list = []
cum_log_return_pct_list = []
for symbol in symbols:
    csv_file = f"datasets/csv/gmo_crypto_2020_2023({symbol})_{interval}.csv"
    isFile = os.path.isfile(csv_file)
    if not isFile:
        for date in date_list:  # '2020','2021','2022','2023'
            df = get_crypto(symbol, interval, date)    # get n rows from starting date
            if not df.empty:
                df.to_csv(csv_file, index=True)
    # end of if not isFile:
    isFile = os.path.isfile(csv_file)
    if isFile:
        df = get_data(csv_file)
        if not df.empty:
            df = calculate_cum_log_return(df)
            df.replace([np.inf, -np.inf], np.nan).dropna(axis=1, inplace=True)
            cum_log_return = df.iloc[-1]['cum_log_return']
            cum_log_return_pct = df.iloc[-1]['cum_log_return_pct']
            symbol_list.append(symbol)
            cum_log_return_list.append(cum_log_return)
            cum_log_return_pct_list.append(cum_log_return_pct)
# end of for symbol in symbols:

### Create DataFrame from dict
data = {
    'symbol': symbol_list,
    'cum_log_return': cum_log_return_list,
    'cum_log_return_pct': cum_log_return_pct_list
}

raw_df = pd.DataFrame(data)
if raw_df.empty:
    print(f"Quit the program due to raw_df is empty: {raw_df.empty=}")
    quit()

### Replace np.inf or -np.inf (positive or negative infinity) with np.nan(Not A Number)
df = raw_df.replace([np.inf, -np.inf], np.nan)
### Drop rows if np.nan (Not A Number)
df.dropna(axis=0, inplace=True)
df['cum_log_return_pct'] = df['cum_log_return']
df['cum_log_return_float'] = df['cum_log_return'].apply(lambda x: x * 100)
df = df.sort_values(by=['cum_log_return_float'], ascending=False).reset_index()
df['ranking'] = df.index + 1

### Instantiate Dash Class
app = Dash(__name__, external_stylesheets=[dbc.themes.CYBORG])

data = df.to_dict('records')

log_return = FormatTemplate.Format(precision=6, scheme=Scheme.fixed)
log_return_pct = FormatTemplate.percentage(2)
log_return_float = FormatTemplate.Format(precision=6, scheme=Scheme.fixed)

columns = [
    dict(id='symbol', name='Symbol', type='text'),
    dict(id='cum_log_return_float', name='Cum Log Return Float', type='numeric', deletable=False, format=log_return_float),
    dict(id='cum_log_return_pct', name='Cum Log Return (%)', type='numeric', format=log_return_pct)
]

style_header = {
    'backgroundColor': 'rgb(30, 30, 30)',
    'color': 'white',
    'fontWeight': 'bold'
}

style_data = {
    'backgroundColor': 'rgb(50, 50, 50)',
    'color': 'white'
}

####################################################################################
def data_bars(df: pd.DataFrame, column: str, angle='90deg', direction=None) -> list:

    '''
    Linear Gradients (goes down/up/left/right/diagonally)
    Using Direction:
    background: linear-gradient(direction, color-stop1, color-stop2, ...);
    background: linear-gradient(to right, red , yellow);
    background: linear-gradient(to left, red , yellow);
    Using Angles:
    background: linear-gradient(angle, color-stop1, color-stop2);
    background: linear-gradient(0deg,   red, yellow); equivalent to "to top"
    background: linear-gradient(90deg,  red, yellow); equivalent to "to right"
    background: linear-gradient(180deg, red, yellow); equivalent to "to bottom"
    background: linear-gradient(270deg, red, yellow); equivalent to "to left"
    '''

    direction_or_angle = '90deg'
    if direction is None:
        direction_or_angle = angle      # 90deg, 270deg
    else:
        direction_or_angle = direction  # 'to right', 'to left'

    n_bins = 100

    bounds = [i * (1.0 / n_bins) for i in range(n_bins + 1)]

    ranges = [
        ((df[column].max() - df[column].min()) * i) + df[column].min()
        for i in bounds
    ]

    styles = []

    for i in range(1, len(bounds)):
        min_bound = ranges[i - 1]   # ranges[1-1] => ranges[0] : 4.0
        max_bound = ranges[i]       # ranges[1] : 4.73

        max_bound_percentage = bounds[i] * 100  # bounds[1] : 0.01

        styles.append({
            'if': {
                'filter_query': (
                    '{{{column}}} >= {min_bound}' +
                    (' && {{{column}}} < {max_bound}' if (i < len(bounds) - 1) else '')
                ).format(column=column, min_bound=min_bound, max_bound=max_bound),
                'column_id': column # 'cum_log_return_int'
            },
            # BAR: direction='to right', 'to left', angle='90deg', '270deg'
            'background': (
                """
                    linear-gradient({direction_or_angle},
                    #0074D9 0%,
                    #0074D9 {max_bound_percentage}%,
                    rgb(50, 50, 50) {max_bound_percentage}%,
                    rgb(50, 50, 50) 100%)
                """.format(direction_or_angle=direction_or_angle, max_bound_percentage=max_bound_percentage)
            ),
            'paddingBottom': 2,
            'paddingTop': 2
        })

    return styles


style_data_conditional = (data_bars(df, column='cum_log_return_float'))

style_cell_conditional= [{
        'if': {'column_id': 'symbol'},
        'textAlign': 'left'
}]

css = [{
    'selector': '.dash-table-tooltip',
    'rule': 'background-color: dodgerblue ; color: white'
}]

### Layout the Web Page#
app.layout = dbc.Container(
    [
        dbc.Row([
            html.H3('GMO Coin: Cryptocurrencies by Cumulative Log Return'),
            html.H5('Displaying Data Bars (Left to Right)'),
        ]),
        dbc.Row(html.Br()),

        dbc.Row(
            dash_table.DataTable(
                id='dt',
                data=data,
                columns=columns,
                style_header=style_header,
                style_data=style_data,
                style_cell_conditional=style_cell_conditional,
                style_data_conditional=style_data_conditional,
                css=css,
            ),
        ),
        dbc.Row(html.Br()),

    ], # fluid=False,
)

### Run the server
if __name__ == '__main__':
    app.run_server(debug=True)
リスト3: lib/gmo_api.py
# gmo_api.py

import math
import numpy as np
import pandas as pd
import requests

import datetime as dt
from datetime import timedelta
from time import sleep

import warnings
warnings.simplefilter('ignore')

####################################################
def get_crypto_symbols(symbol=None) -> pd.DataFrame:
    # Define GMO Coin API endpoint
    endpoint = 'https://api.coin.z.com/public/v1/ticker'
    params = {}
    if symbol is not None:
        # add a new element(symbol) to the params dictionary
        params['symbol'] = symbol

    res_dict  = requests.get(endpoint, params=params)
    dict = res_dict.json()
    status = dict.get('status')
    # no error ?
    if status == 0:
        data_list = dict.get('data')
        df = pd.DataFrame(data_list)    # ask, bid, high, last, low, symbol, timestamp, volume
        return df
    else:
        print(f"get_crypto_symbols() error => {status=}")
        return pd.DataFrame()

############################################################ Load data from GMO Coin
def get_crypto(symbol='BTC', interval='1day', start='2018'):
    '''
    interval=1min 5min 10min 15min 30min 1hour for YYYYMMDD
    interval=4hour 8hour 12hour 1day 1week 1month  YYYY
    start='2018'
    '''
    url = 'https://api.coin.z.com/public/v1/klines'

    params = {
        'symbol': symbol,
        'interval': interval,
        'date': start
    }

    try:
        res_dict  = requests.get(url, params=params)
        dict = res_dict.json()
        status = dict.get('status')
        # no error ?
        if status == 0:
            data_list = dict.get('data')
            df = pd.DataFrame(data_list)
            df.columns = ['date', 'open', 'high', 'low', 'close', 'volume']
            df['date'] = pd.to_datetime(df['date'], unit='ms')
            df.set_index('date', inplace=True)
            df = df.astype(float)
            df['symbol'] = symbol
            # df.reset_index(inplace=True)
            # print(f"get_crypto({symbol=}, {interval=}, {start=}) => {df.shape[0]=}")
            return df
        else:
            print(f"get_crypto({symbol=}, {interval=}, {start=}) error => {status=}")
            return pd.DataFrame()
    except requests.exceptions.HTTPError as e:
        print(f"get_crypto({symbol=}, {interval=}, {start=}) HTTP error: {e}")
    except Exception as e:
        print(f"get_crypto({symbol=}, {interval=}, {start=}) exception error: {e}")

    return pd.DataFrame()
リスト4: lib/com_lib.py
# com_lib.py

import math
import numpy as np
import pandas as pd
import requests

import datetime as dt
from datetime import timedelta
from time import sleep

import warnings
warnings.simplefilter('ignore')

############################################
def get_data(csv_file: str) -> pd.DataFrame:
    # print(f"Loading data: {csv_file} ")
    df = pd.read_csv(csv_file)
    # date,open,high,low,close,adj close,volume,symbol
    df['date'] = pd.to_datetime(df['date'])
    df.set_index(['date'], inplace=True)
    return df

###############################################################
def calculate_cum_log_return(df: pd.DataFrame) -> pd.DataFrame:
    # Calculate log return
    df['log_return'] = np.log(df['close'] / df['close'].shift(1))

    # Calculate cumulative log return
    df['cum_log_return'] = np.exp(df['log_return'].cumsum()) - 1
    df['cum_log_return_pct'] = df['cum_log_return'] * 100

    # Preview the resulting dataframe
    # print(f"Cumulative Log Return for {df.iloc[-1]['symbol']} = {df.iloc[-1]['cum_log_return_pct']:.2%}")
    return df

############################################
def add_coin_name(df: pd.DataFrame) -> None:
    csv_symbol = 'datasets/csv/gmo_coin_symbols.csv'
    symbol_df = pd.read_csv(csv_symbol)
    # Rename Pandas columns to lower case
    symbol_df.columns = symbol_df.columns.str.lower()
    # symbol, description, release_date
    symbol_df['release_date'] = pd.to_datetime(symbol_df['release_date'])

    #  #   Column        Non-Null Count  Dtype
    # ---  ------        --------------  -----
    #  0   symbol        26 non-null     object
    #  1   description   26 non-null     object
    #  2   release_date  26 non-null     datetime64[ns]

    for _, row in symbol_df.iterrows():
        symbol = row['symbol']
        description = row['description']
        find_mask = df['symbol'] == symbol
        dfx = df[find_mask]
        if not dfx.empty:
            ix = dfx.index.values[0]
            df.loc[ix, 'coin_name'] = description   # add a new column
    # end of for _, row in symbol_df.iterrows():

    return