GMO Coinから仮想通貨の板情報を取得してWebページに表示する
ここでは、GMO Coinから仮想通貨の板情報(Orderbook)を取得してWebページに表示します。
GMO Coinから板情報を取得するには、APIを使用します。
GMO CoinのAPIの使い方については、
「記事(Article116)」で詳しく解説しています。
ここでは、ライブラリファイル「gmo_api.py」の「get_orderbooks_try()」関数を使用して取得しています。
この関数からは「Ask(売)」と「Bid(買)」の板情報がPandasのDataFrameに格納されて返されます。
DataFrameは「price, quantity」のカラムから構成されています。
DataFrameに格納されている板情報をWebページに表示するには、
DashのDataTableを使用します。
板情報を一定の間隔で更新するには、
dcc(Dash Core Components)のInterval()を使用します。
このコンポーネントの引数に時間をミリセカンド(ms)の単位で指定します。
たとえば、3秒間隔で板情報を更新するときは「dcc.Interval(interval=3000)」のように指定します。
この場合、3秒間隔でコールバックにコントロールが渡ります。
コールバック機能の使い方については、
「記事(Article137)」で詳しく解説しているので省略します。
リスト2:Article142.py
# Article142.py
# https://dash.plotly.com/layout
# https://dash.plotly.com/datatable
# https://dash.plotly.com/dash-core-components
# https://bootstrap-cheatsheet.themeselection.com/
# https://www.w3schools.com/css/css_colors.asp

# Import python libraries
from dash import Dash, html, Output, Input, State, dash_table, dcc, ctx
import dash_bootstrap_components as dbc
import plotly.graph_objects as go
from decimal import Decimal
import pandas as pd
import requests
import numpy as np
import math
from time import sleep

from lib.com_lib import get_datatable_style_data
from lib.gmo_api import get_orderbooks_try, get_orderbooks

####################
# Main
####################

### Define Stlye Sheets (CSS)
DATATABLE_HEADER_CSS = {
    'display': 'none'
}

DATATABLE_ASK_CELL_CSS = {
    'minWidth': '140px',
    'maxWidth': '140px',
    'width': '140px',
    'text-align': 'right',
    'background-color': 'black',
    'color': 'DodgerBlue',
    'border': '1px solid rgba(30,30,30)'
}

DATATABLE_BID_CELL_CSS = {
    'minWidth': '140px',
    'maxWidth': '140px',
    'width': '140px',
    'text-align': 'right',
    'background-color': 'black',
    'color': 'Red',
    'border': '1px solid rgba(30,30,30)'
}

DROPDOWN_DIV_CSS = {
    'display': 'flex',
    'justify-content': 'center',
    'align-items': 'center',
    'height': '100vh'
}

ROW_BORDER = {
    # 'border-color': 'red',      # border-color: red
    # 'border-style': 'solid',    # border-style: dotted, solid, double
    # 'border-width': 'thin',     # border-width: thin, thick
    # 'text-align': 'center'
}

COL_BORDER = {
    # 'border-color': 'green',    # border-color: green
    # 'border-style': 'dotted',   # border-style: dotted, solid, double
    # 'border-width': 'thin',     # border-width: thin, thick
    # 'text-align': 'center',
}

### Define price, qty precisions
price_precision_dict = {'BTC_JPY': 0, 'ETH_JPY': 0, 'LTC_JPY': 0, 'BCH_JPY': 0, 'XRP_JPY': 3}
qty_precision_dict = {'BTC_JPY': 2, 'ETH_JPY': 1, 'LTC_JPY': 0, 'BCH_JPY': 1, 'XRP_JPY': 0}

### Layout Top Column
top = html.Div(
    [
        dash_table.DataTable(
            id='ask-dt',
            style_header=DATATABLE_HEADER_CSS,
            style_cell=DATATABLE_ASK_CELL_CSS,
            style_as_list_view=True,
        ),
        html.Br() ,

        html.H2(id='price-h2', style={'text-align': 'center'}),

        dash_table.DataTable(
            id='bid-dt',
            style_header=DATATABLE_HEADER_CSS,
            style_cell=DATATABLE_BID_CELL_CSS,
            style_as_list_view=True,
        ),

        html.Br(),
        dcc.Slider(3, 15, 3, value=10, id='slider'),
    ], style={'background-color': 'black', 'color': 'white'}
)

### Layout Bottom Column
bottom = html.Div(
    [
        html.H5('GMO Coin Orderbook Dashbord!'),
        html.Hr(),
        html.Label('Coin Symbol:', style={'text-align': 'left'}),
        dcc.Dropdown(
                ['BTC_JPY', 'ETH_JPY', 'LTC_JPY', 'XRP_JPY', 'BCH_JPY'],
                'LTC_JPY',
                placeholder='Select a coin',
                id='coin-dl',
            ),
    ], style={'background-color': 'black', 'color': 'white'}
)

app = Dash(__name__, external_stylesheets=[dbc.themes.CYBORG],
            meta_tags=[
                {'name': 'viewport', 'content': 'width=device-width, initial-scale=1.0'},
                {'name': 'description', 'content': 'GMO Coin Orderbook Dashbord!'}
            ])

app.title = 'GMO Coin Orderbook Dashbord!'

app.layout = dbc.Container([
    dbc.Row([
        dbc.Col(
            top,
            xs=dict(order=2, size=12),  # mobile
            sm=dict(order=1, size=6),   # desktop
            style=COL_BORDER
        ),
        dbc.Col(
            bottom,
            xs=dict(order=1, size=12),  # mobile
            sm=dict(order=2, size=6),   # desktop
            style=COL_BORDER
        ),
    ], style=ROW_BORDER),

    dcc.Interval(id='timer', interval=1000*30) # 30 seconds
])

####################
# Dash Callback
####################
@app.callback(
    Output('ask-dt', 'data'),
    Output('bid-dt', 'data'),
    Output('price-h2', 'children'),
    Input('coin-dl', 'value'),      # symbol
    Input('slider', 'value'),       # n_rows
    Input('timer', 'n_intervals'),  # n_intervals
)
##################################################
def update_orderbook(symbol, n_rows, n_intervals):
    if symbol is None:
        df = pd.DataFrame()
        mid_price = None
        return (df.to_dict('records'),
                df.to_dict('records'),
                mid_price)

    levels_to_show = n_rows

    price_precision = price_precision_dict[symbol]

    quantity_precison = qty_precision_dict[symbol]

    # Get orderbooks (ask, bid)
    ask_df, bid_df = get_orderbooks_try(symbol) # sell, buy

    mid_price = (bid_df.price.iloc[0] + ask_df.price.iloc[0]) / 2
    mid_price_str = f'{mid_price:,.{price_precision}f}'

    bid_df = bid_df.sort_values('price', ascending=False)
    ask_df = ask_df.sort_values('price', ascending=False)

    bid2_df = bid_df.iloc[:levels_to_show]
    ask2_df = ask_df.iloc[-levels_to_show:]

    bid3_df = bid2_df.copy()
    ask3_df = ask2_df.copy()

    bid3_df['price'] = bid2_df['price'].apply(lambda x: f'{x:,.{price_precision}f}')
    bid3_df['quantity'] = bid2_df['quantity'].apply(lambda x: f'{x:,.{quantity_precison}f}')

    ask3_df['price'] = ask2_df['price'].apply(lambda x: f'{x:,.{price_precision}f}')
    ask3_df['quantity'] = ask2_df['quantity'].apply(lambda x: f'{x:,.{quantity_precison}f}')

    return (ask3_df.to_dict('records'),
            bid3_df.to_dict('records'),
            mid_price_str)

### Run the server
if __name__ == '__main__':
    app.run_server(debug=True)
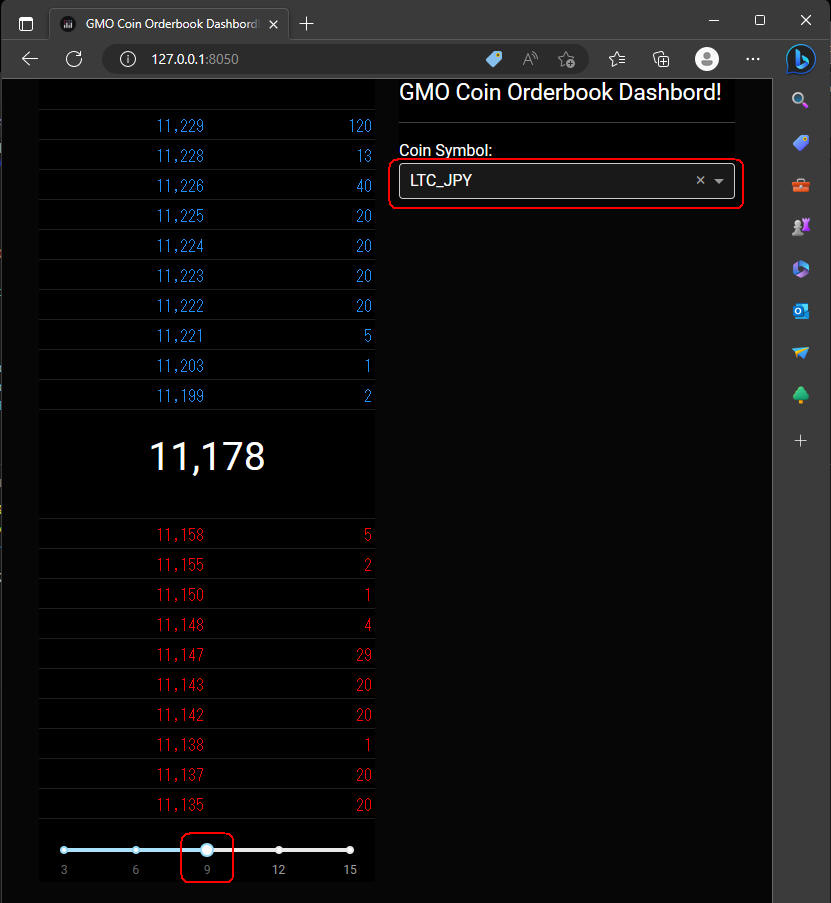 図5-1
図5-1は、Webページをディスクトップパソコンに表示したときの画面です。
「top」と「bottom」が左右に表示されています。
板に表示する仮想通貨は、ドロップダウンリストからシンボルを選択して変えることができます。
ここでは「LTC_JPY」を選択しています。
板に表示する「売」と「買」の注文件数はスライダーから選択することができます。
件数の範囲は「3, 6, 9, 12, 15」になっています。
ここでは「9」を選択しています。
図5-1
図5-1は、Webページをディスクトップパソコンに表示したときの画面です。
「top」と「bottom」が左右に表示されています。
板に表示する仮想通貨は、ドロップダウンリストからシンボルを選択して変えることができます。
ここでは「LTC_JPY」を選択しています。
板に表示する「売」と「買」の注文件数はスライダーから選択することができます。
件数の範囲は「3, 6, 9, 12, 15」になっています。
ここでは「9」を選択しています。
DataTableには「style_as_list_view=True」のプロパティを追加して表から縦線を消して横線だけにしています。
ちなみに、ドロップダウンリストを「Dark」モードで表示するときは、
カスタムスタイルシートを適用させる必要があります。
カスタムスタイルシートは、後述する「リスト7」に掲載しています。
なお、CSSファイル「article142.css」は、「assets」フォルダに格納しておくと自動的に取り込まれます。
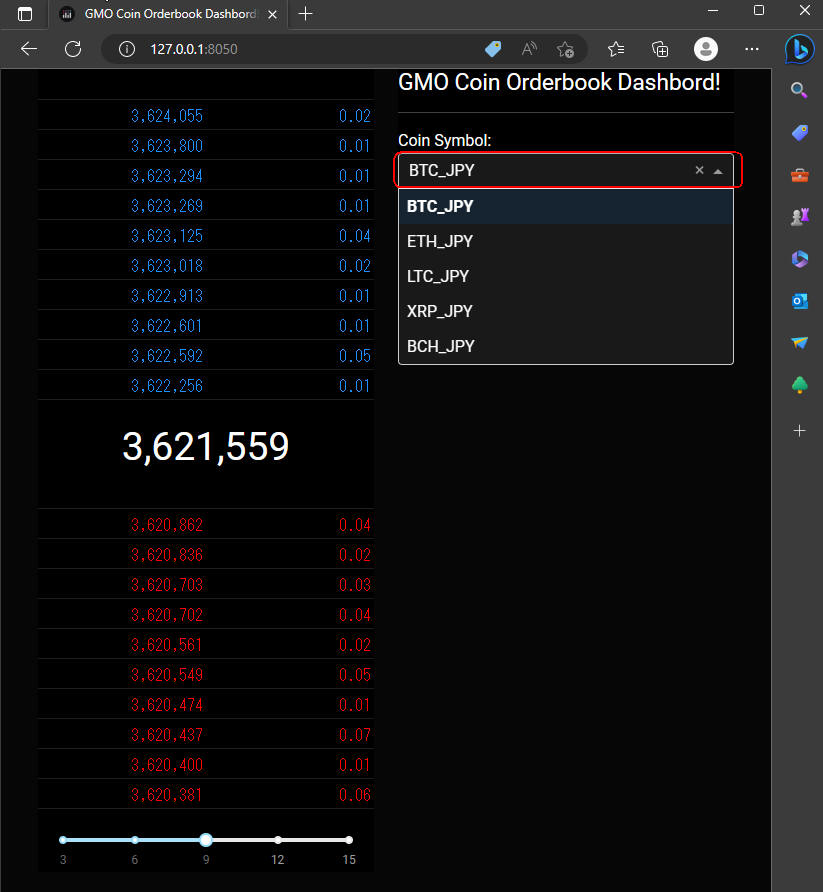 図5-2
図5-2では、ドロップダウンリストからビットコイン「BTC_JPY」を選択しています。
板にはビットコインの注文情報がそれぞれ9件表示されています。
図5-2
図5-2では、ドロップダウンリストからビットコイン「BTC_JPY」を選択しています。
板にはビットコインの注文情報がそれぞれ9件表示されています。
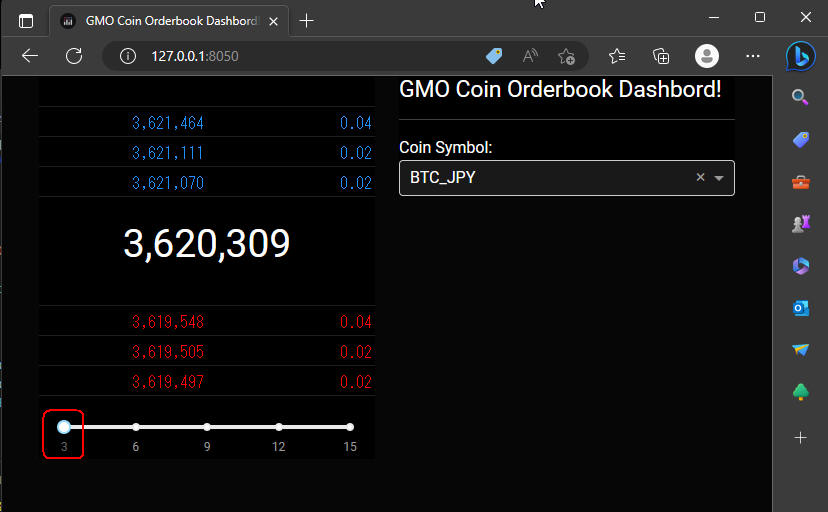 図5-3
図5-3では、スライダーから「3」を選択して板に表示する注文件数を3件に減らしています。
図5-3
図5-3では、スライダーから「3」を選択して板に表示する注文件数を3件に減らしています。
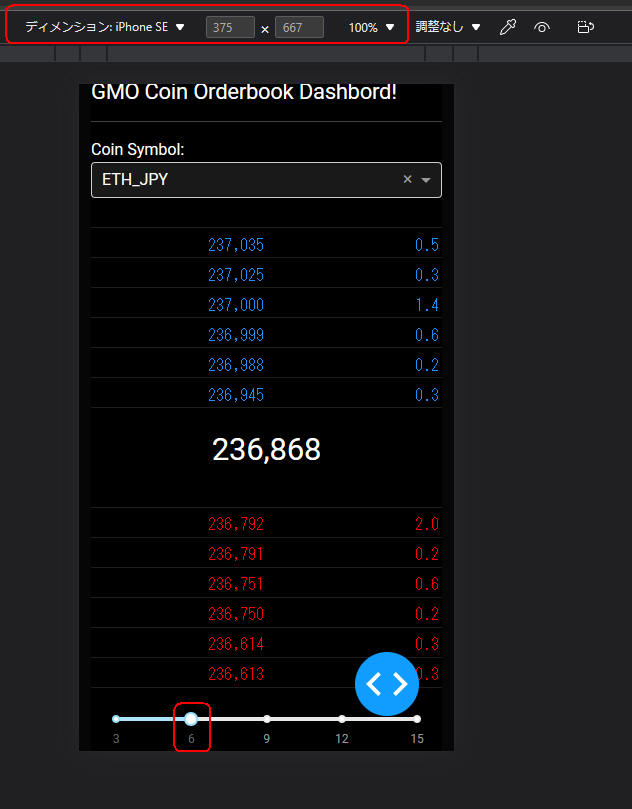 図5-4
図5-4では、Webページを「iPhone SE」に表示しています。
「bottom, top」の順に上下に表示されています。
ここでは、ドロップダウンリストからイーサリアム(ETH_JPY)を選択しています。
さらに、スライダーから「6」を選択しています。
図5-4
図5-4では、Webページを「iPhone SE」に表示しています。
「bottom, top」の順に上下に表示されています。
ここでは、ドロップダウンリストからイーサリアム(ETH_JPY)を選択しています。
さらに、スライダーから「6」を選択しています。
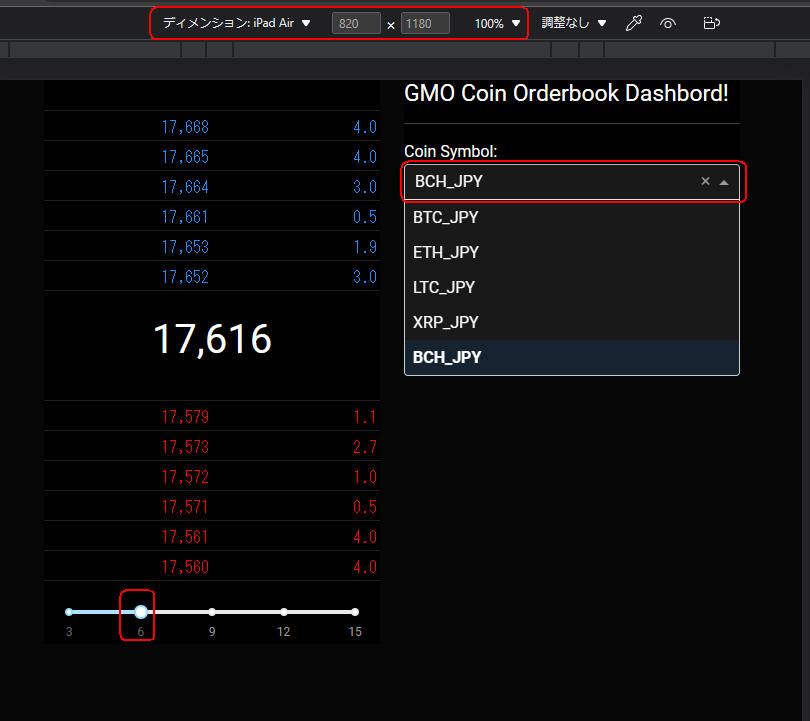 図5-5
図5-5では、Webページを「iPad Air」に表示しています。
この場合、「top, bottom」は左右に表示されます。
ここでは、ビットコインキャッシュ(BCH_JPY)を選択しています。
図5-5
図5-5では、Webページを「iPad Air」に表示しています。
この場合、「top, bottom」は左右に表示されます。
ここでは、ビットコインキャッシュ(BCH_JPY)を選択しています。
板情報の「数量」に棒グラフを重ねて表示させる
ここでは、Webページに表示する板情報の「数量」に重ねて「棒グラフ」も表示しています。
数量の数値と棒グラフを表示することにより、数値の大小が視覚化できます。
棒グラフを使用するには、DashのDataTableに「style_data_conditional」プロパティを追加します。
このスタイルシートには、CSSの「linear-gradient」を追加して棒グラフを描画させます。
ここでは、外部ファイル「com_lib.py」に格納されている「get_datatable_style_data()」関数を使用しています。
なお、DataTableに棒グラフを表示する処理は、
「記事(Article141)」で詳しく解説していますのでここでは省略します。
リスト3にソースコードの一部を掲載しています。変更箇所は「オレンジ色」でハイライトしています。
リスト3:Article142.py
# Article142.py

# Import python libraries
from dash import Dash, html, Output, Input, State, dash_table, dcc, ctx
import dash_bootstrap_components as dbc
import plotly.graph_objects as go
from decimal import Decimal
import pandas as pd
import requests
import numpy as np
import math
from time import sleep

from lib.com_lib import get_datatable_style_data
from lib.gmo_api import get_orderbooks_try, get_orderbooks

####################
# Main
####################

app = Dash(__name__, external_stylesheets=[dbc.themes.CYBORG],
            meta_tags=[
                {'name': 'viewport', 'content': 'width=device-width, initial-scale=1.0'},
                {'name': 'description', 'content': 'GMO Coin Orderbook Dashbord!'}
            ])

app.title = 'GMO Coin Orderbook Dashbord!'

app.layout = dbc.Container([
    dbc.Row([
        dbc.Col(
            top,
            xs=dict(order=2, size=12),  # mobile
            sm=dict(order=1, size=6),   # desktop
            style=COL_BORDER
        ),
        dbc.Col(
            bottom,
            xs=dict(order=1, size=12),  # mobile
            sm=dict(order=2, size=6),   # desktop
            style=COL_BORDER
        ),
    ], style=ROW_BORDER),

    dcc.Interval(id='timer', interval=1000*3) # 3 seconds
])

####################
# Dash Callback
####################
@app.callback(
    Output('ask-dt', 'data'),
    Output('ask-dt', 'style_data_conditional'),
    Output('bid-dt', 'data'),
    Output('bid-dt', 'style_data_conditional'),
    Output('price-h2', 'children'),
    Input('coin-dl', 'value'),
    Input('slider', 'value'),
    Input('timer', 'n_intervals'),
)
##################################################
def update_orderbook(symbol, n_rows, n_intervals):
    # print(f"pdate_orderbook({symbol=}, {n_rows=}, {n_intervals=})")

    if symbol is None:
        df = pd.DataFrame()
        return (df.to_dict('records'), [],
                df.to_dict('records'), [],
                None)

    levels_to_show = n_rows

    price_precision = price_precision_dict[symbol]

    quantity_precison = qty_precision_dict[symbol]

    # Get orderbooks (ask, bid)
    ask_df, bid_df = get_orderbooks_try(symbol) # sell, buy

    mid_price = (bid_df.price.iloc[0] + ask_df.price.iloc[0]) / 2
    mid_price_str = f'{mid_price:,.{price_precision}f}'

    bid_df = bid_df.sort_values('price', ascending=False)
    ask_df = ask_df.sort_values('price', ascending=False)

    bid2_df = bid_df.iloc[:levels_to_show]
    ask2_df = ask_df.iloc[-levels_to_show:]

    bid3_df = bid2_df.copy()
    ask3_df = ask2_df.copy()

    bid3_df['price'] = bid2_df['price'].apply(lambda x: f'{x:,.{price_precision}f}')
    bid3_df['quantity'] = bid2_df['quantity'].apply(lambda x: f'{x:,.{quantity_precison}f}')

    ask3_df['price'] = ask2_df['price'].apply(lambda x: f'{x:,.{price_precision}f}')
    ask3_df['quantity'] = ask2_df['quantity'].apply(lambda x: f'{x:,.{quantity_precison}f}')

    return (ask3_df.to_dict('records'), get_datatable_style_data(ask2_df, 'ask', symbol),
            bid3_df.to_dict('records'), get_datatable_style_data(bid2_df, 'bid', symbol),
            mid_price_str)

### Run the server
if __name__ == '__main__':
    app.run_server(debug=True)
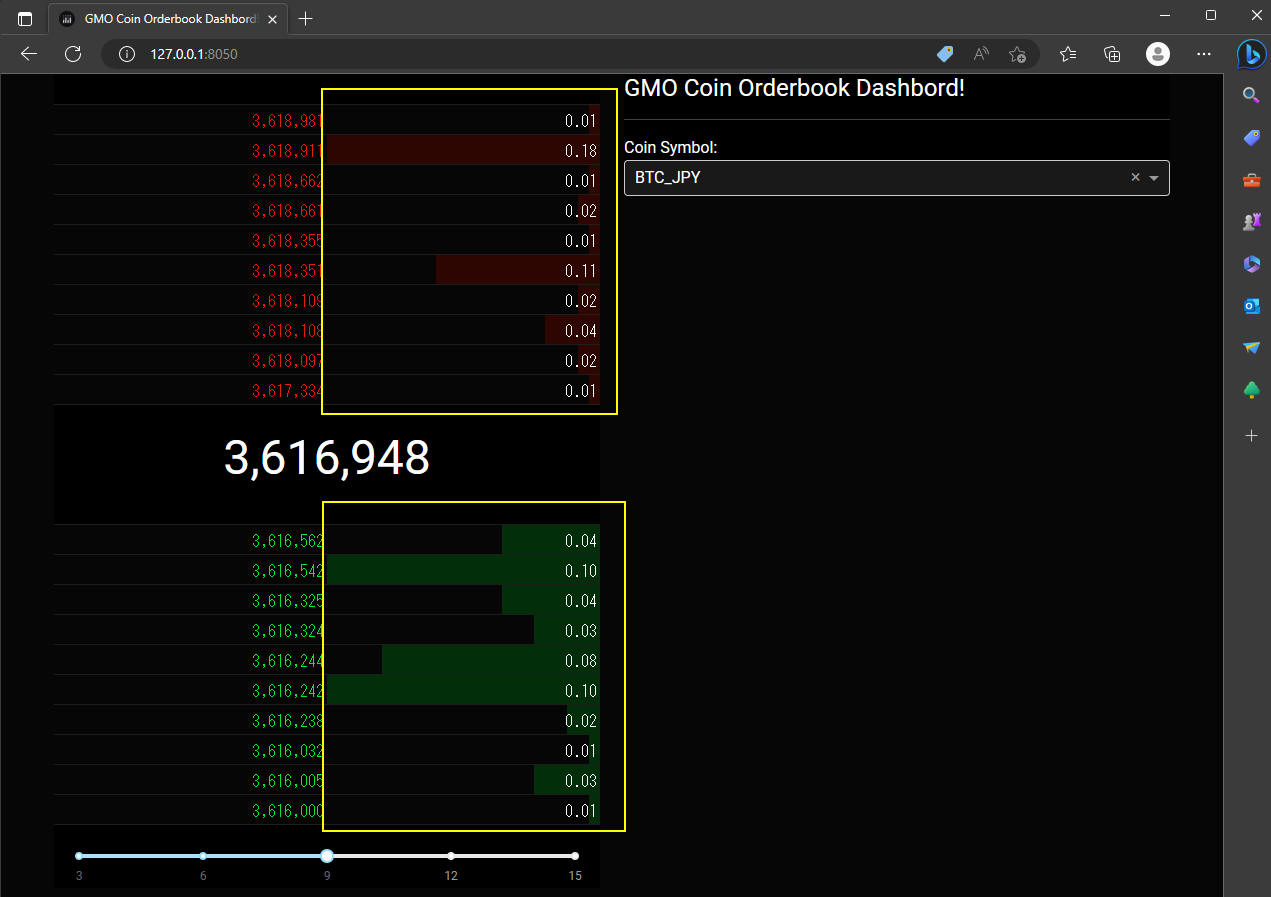 図6-1
図6-1では、Webページをディスクトップパソコンに表示しています。
板情報の「数量」に「棒グラフ」も重ねて表示されています。
図6-1
図6-1では、Webページをディスクトップパソコンに表示しています。
板情報の「数量」に「棒グラフ」も重ねて表示されています。
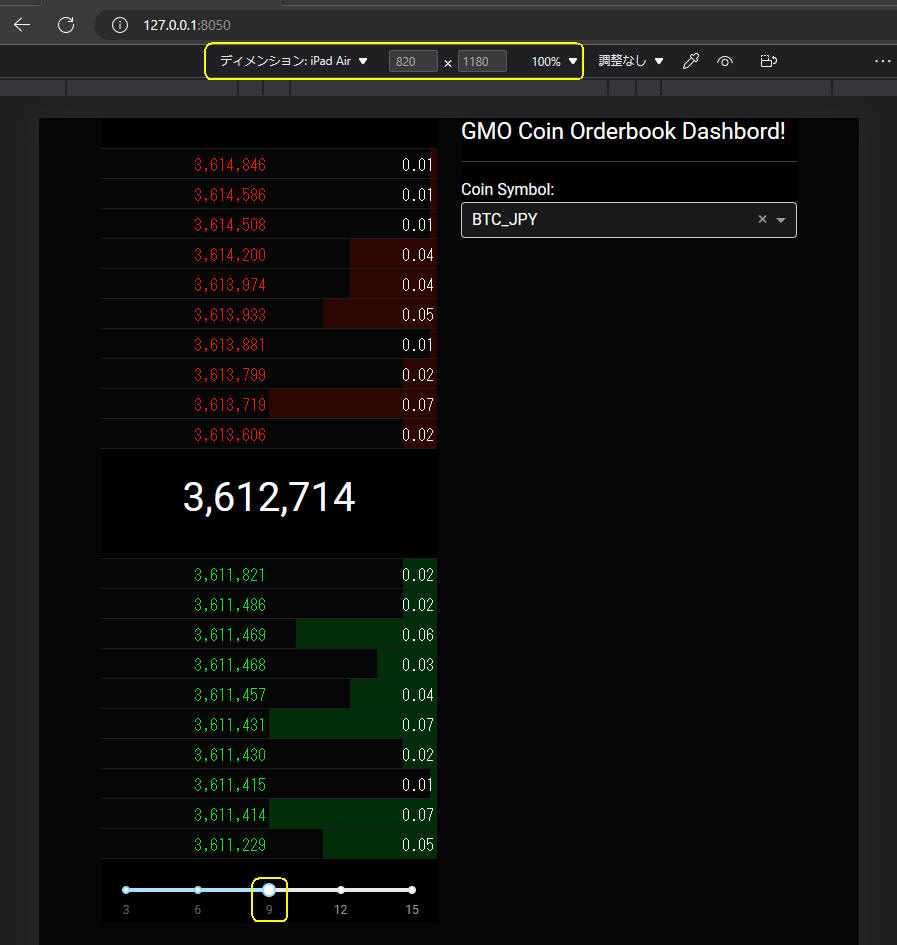 図6-2
図6-2では、Webページを「iPad Air」に表示しています。
図6-2
図6-2では、Webページを「iPad Air」に表示しています。
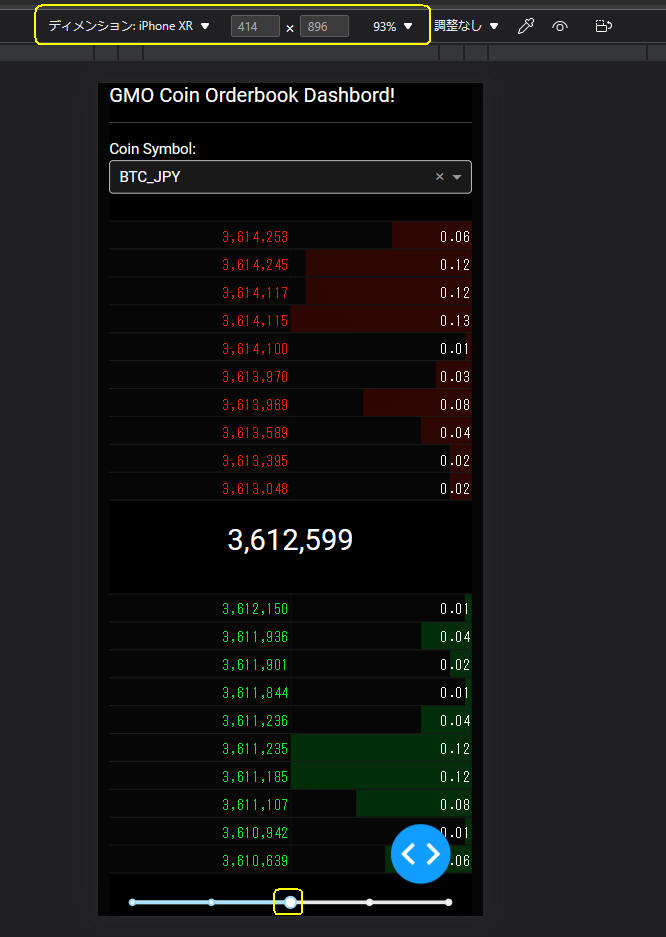 図6-3
図6-3では、Webページを「iPhone XR」に表示しています。
図6-3
図6-3では、Webページを「iPhone XR」に表示しています。
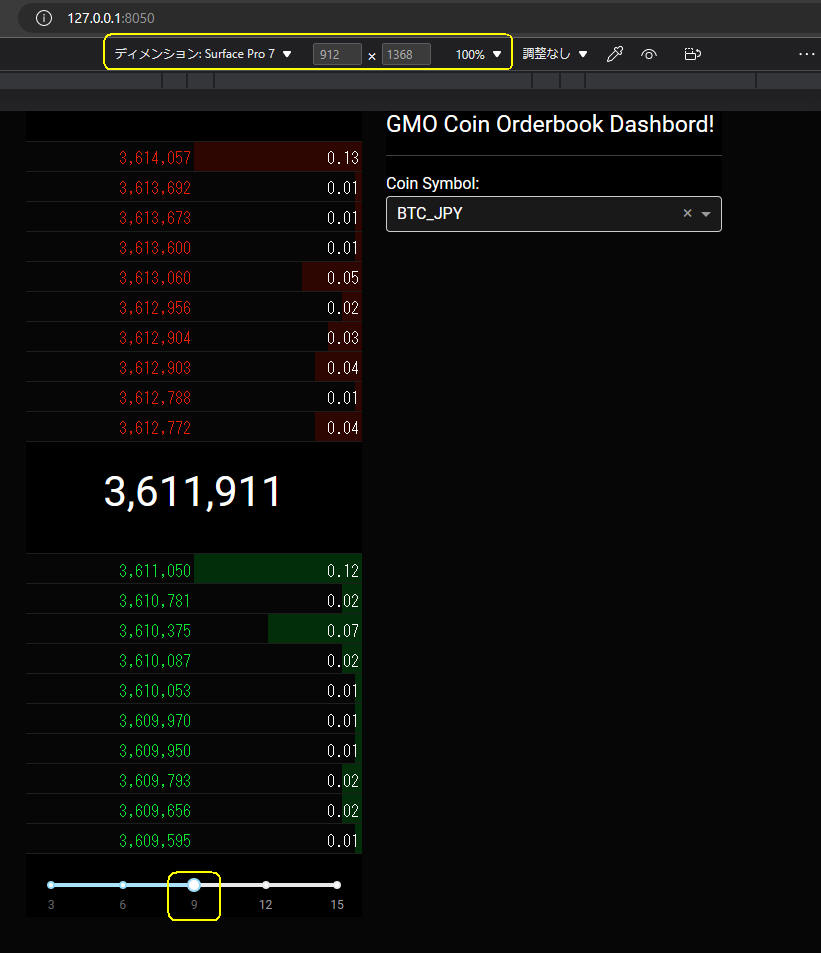 図6-4
図6-4では、Webページを「Surface Pro 7」に表示しています。
図6-4
図6-4では、Webページを「Surface Pro 7」に表示しています。
最終版の全てのコードを掲載
ここでは、最終版のプログラムのソースコードと、 ライブラリのソースコード、スタイルシートを掲載しています。
CSSファイル(article142.css)は「assets」フォルダに格納しておくと自動的に取り込まれます。
リスト4: Article142.py
# Article142.py
# https://dash.plotly.com/layout
# https://dash.plotly.com/datatable
# https://dash.plotly.com/dash-core-components
# https://bootstrap-cheatsheet.themeselection.com/
# https://www.w3schools.com/css/css_colors.asp

# Import python libraries
from dash import Dash, html, Output, Input, State, dash_table, dcc, ctx
import dash_bootstrap_components as dbc
import plotly.graph_objects as go
from decimal import Decimal
import pandas as pd
import requests
import numpy as np
import math
from time import sleep

from lib.com_lib import get_datatable_style_data
from lib.gmo_api import get_orderbooks_try, get_orderbooks

'''
  mobile
  +--------+
  | bottom |
  |--------|
  | top    |
  +--------+

  desktop
  +--------+--------+
  | top | bottom    |
  +--------+--------+

'''

####################
# Main
####################

### Define Stlye Sheets (CSS)
DATATABLE_HEADER_CSS = {
    'display': 'none'
}

DATATABLE_ASK_CELL_CSS = {
    'minWidth': '140px',
    'maxWidth': '140px',
    'width': '140px',
    'text-align': 'right',
    # 'background-color': 'black',
    # 'color': 'DodgerBlue',  # 'color': 'white', 'cyan'
    'border': '1px solid rgba(30,30,30)'
}

DATATABLE_BID_CELL_CSS = {
    'minWidth': '140px',
    'maxWidth': '140px',
    'width': '140px',
    'text-align': 'right',
    # 'background-color': 'black',
    # 'color': 'Red',  # 'color': 'white',
    'border': '1px solid rgba(30,30,30)'
}

DROPDOWN_DIV_CSS = {
    'display': 'flex',
    'justify-content': 'center',
    'align-items': 'center',
    'height': '100vh'
}

ROW_BORDER = {
    # 'border-color': 'red',      # border-color: red
    # 'border-style': 'solid',    # border-style: dotted, solid, double
    # 'border-width': 'thin',     # border-width: thin, thick
    # 'text-align': 'center'
}

COL_BORDER = {
    # 'border-color': 'green',    # border-color: green
    # 'border-style': 'dotted',   # border-style: dotted, solid, double
    # 'border-width': 'thin',     # border-width: thin, thick
    # 'text-align': 'center',
}

### Define price, qty precisions
price_precision_dict = {'BTC_JPY': 0, 'ETH_JPY': 0, 'LTC_JPY': 0, 'BCH_JPY': 0, 'XRP_JPY': 3}
qty_precision_dict = {'BTC_JPY': 2, 'ETH_JPY': 1, 'LTC_JPY': 0, 'BCH_JPY': 1, 'XRP_JPY': 0}

### Layout Top Column
top = html.Div(
    [
        dash_table.DataTable(
            id='ask-dt',
            style_header=DATATABLE_HEADER_CSS,
            style_cell=DATATABLE_ASK_CELL_CSS,
            style_as_list_view=True,
        ),
        html.Br() ,

        html.H2(
            id='price-h2', style={'text-align': 'center'}
        ),

        dash_table.DataTable(
            id='bid-dt',
            style_header=DATATABLE_HEADER_CSS,
            style_cell=DATATABLE_BID_CELL_CSS,
            style_as_list_view=True,
        ),

        html.Br(),
        dcc.Slider(3, 15, 3, value=10, id='slider'),
    ], style={'background-color': 'black', 'color': 'white'})

    # style={'height': '10em', 'background-color': 'black', 'color': 'white'}

### Layout Bottom Column
bottom = html.Div(
    [
        html.H5('GMO Coin Orderbook Dashbord!'),
        html.Hr(),
        html.Label('Coin Symbol:', style={'text-align': 'left'}),
        dcc.Dropdown(
                ['BTC_JPY', 'ETH_JPY', 'LTC_JPY', 'XRP_JPY', 'BCH_JPY'],
                'BTC_JPY',
                placeholder='Select a coin',
                id='coin-dl',
            ),
    ], style={'background-color': 'black', 'color': 'white'})

app = Dash(__name__, external_stylesheets=[dbc.themes.CYBORG],
            meta_tags=[
                {'name': 'viewport', 'content': 'width=device-width, initial-scale=1.0'},
                {'name': 'description', 'content': 'GMO Coin Orderbook Dashbord!'}
            ])

app.title = 'GMO Coin Orderbook Dashbord!'

app.layout = dbc.Container([
    dbc.Row([
        dbc.Col(
            top,
            xs=dict(order=2, size=12),  # mobile
            sm=dict(order=1, size=6),   # desktop
            style=COL_BORDER
        ),
        dbc.Col(
            bottom,
            xs=dict(order=1, size=12),  # mobile
            sm=dict(order=2, size=6),   # desktop
            style=COL_BORDER
        ),
    ], style=ROW_BORDER),

    dcc.Interval(id='timer', interval=1000*3) # 3 seconds
])

####################
# Dash Callback
####################
@app.callback(
    Output('ask-dt', 'data'),
    Output('ask-dt', 'style_data_conditional'),
    Output('bid-dt', 'data'),
    Output('bid-dt', 'style_data_conditional'),
    Output('price-h2', 'children'),
    Input('coin-dl', 'value'),
    Input('slider', 'value'),
    Input('timer', 'n_intervals'),
)
##################################################
def update_orderbook(symbol, n_rows, n_intervals):
    # print(f"pdate_orderbook({symbol=}, {n_rows=}, {n_intervals=})")

    if symbol is None:
        df = pd.DataFrame()
        return (df.to_dict('records'), [],
                df.to_dict('records'), [],
                None)

    levels_to_show = n_rows

    price_precision = price_precision_dict[symbol]

    quantity_precison = qty_precision_dict[symbol]

    # Get orderbooks (ask, bid)
    ask_df, bid_df = get_orderbooks_try(symbol) # sell, buy

    mid_price = (bid_df.price.iloc[0] + ask_df.price.iloc[0]) / 2
    mid_price_str = f'{mid_price:,.{price_precision}f}'

    bid_df = bid_df.sort_values('price', ascending=False)
    ask_df = ask_df.sort_values('price', ascending=False)

    bid2_df = bid_df.iloc[:levels_to_show]
    ask2_df = ask_df.iloc[-levels_to_show:]

    bid3_df = bid2_df.copy()
    ask3_df = ask2_df.copy()

    bid3_df['price'] = bid2_df['price'].apply(lambda x: f'{x:,.{price_precision}f}')
    bid3_df['quantity'] = bid2_df['quantity'].apply(lambda x: f'{x:,.{quantity_precison}f}')

    ask3_df['price'] = ask2_df['price'].apply(lambda x: f'{x:,.{price_precision}f}')
    ask3_df['quantity'] = ask2_df['quantity'].apply(lambda x: f'{x:,.{quantity_precison}f}')

    return (ask3_df.to_dict('records'), get_datatable_style_data(ask2_df, 'ask', symbol),
            bid3_df.to_dict('records'), get_datatable_style_data(bid2_df, 'bid', symbol),
            mid_price_str)

### Run the server
if __name__ == '__main__':
    app.run_server(debug=True)
リスト5: lib/gmo_api.py
#############################################
def get_orderbooks_try(symbol: str) -> tuple:  # return (sell_df, buy_df)
    # print(f"get_orderbooks_try({symbol=})")
    retry_count = 0
    api_retry_limit_count = 5
    # retry N times if invalid or connection or time out errors
    while True:
        status, sell_df, buy_df =  get_orderbooks(symbol)  # => return (status, sell_df, buy_df)
        # 4:invalid request (requests are too many), 7:connection error, 8:time out error ?
        if status == 4 or status == 8:
            if retry_count < api_retry_limit_count:
                retry_count += 1
                sec = np.random.randint(low=3, high=61, size=(1))[0]  # get random number between 3~60 seconds
                print(f"Due to get_orderbooks({status=}) error sleeping {sec} seconds ▶ {retry_count=} ")
                sleep(sec)    # sleep 3~60 seconds
                continue
        elif status == 7:   # connection error
            retry_count += 1
            sec = np.random.randint(low=3, high=61, size=(1))[0]  # get random number between 3~60 seconds
            print(f"Due to get_orderbooks({status=}) error sleeping {sec} seconds ▶ {retry_count=} ")
            sleep(sec)    # sleep 3~60 seconds
            continue
        break   # exit while loop
    # end of while True:
    # print(f"get_orderbooks_try({symbol=}) ▶ {sell_df.shape=}, {buy_df.shape=}")

    return (sell_df, buy_df)    # ask, bid

#########################################
def get_orderbooks(symbol: str) -> tuple:  # return (status, sell_df, buy_df)
    # symbol = self.coin.symbol

    # print(f"get_orderbooks({symbol=})")

    endPoint = 'https://api.coin.z.com/public'
    path = f'/v1/orderbooks?symbol={symbol}'
    url = endPoint + path

    status = 999    # misc error

    while True:
        try:
            res_dict = requests.get(url) # 3 seconds  # timeout=0.001  sec
            dict = res_dict.json()      # requests.exceptions.JSONDecodeError:

        except requests.exceptions.HTTPError as errh:
            print(f"HTTP ERROR: get_orderbooks() ▶ request.get() {errh}")
            status = 999                # misc error
            sell_df = pd.DataFrame()    # return empty dataframe
            buy_df = pd.DataFrame()     # return empty dataframe
            break   # return with empty dataframe

        except requests.exceptions.ConnectionError as errc:
            print(f"CONNECTION ERROR: get_orderbooks() ▶ request.get() {errc}")
            status = 7                  # retry error
            sell_df = pd.DataFrame()    # return empty dataframe
            buy_df = pd.DataFrame()     # return empty dataframe
            break   # return with empty dataframe

        except requests.exceptions.Timeout as errt:
            print(f"TIMEOUT ERROR: get_orderbooks() ▶ request.get() {errt}")
            status = 8                  # retry error
            sell_df = pd.DataFrame()    # return empty dataframe
            buy_df = pd.DataFrame()     # return empty dataframe
            break   # return with empty dataframe

        except requests.exceptions.JSONDecodeError as errd:
            print(f"JSON DECODE ERROR: get_orderbooks() ▶ res_dict.json() {errd}" )
            df = pd.DataFrame()     # return empty dataframe
            status = 999            # json decode error
            break   # error return

        except requests.exceptions.RequestException as err:
            print(f"EXCEPTION ERROR: get_orderbooks() ▶ request.get() {err}" )
            status = 999                # misc error
            sell_df = pd.DataFrame()    # return empty dataframe
            buy_df = pd.DataFrame()     # return empty dataframe
            break   # return with empty dataframe

        except:     #  block lets you handle the error
            print(f"MISC EXCEPTION ERROR: get_orderbooks() ▶ return...")
            status = 999                # misc error
            sell_df = pd.DataFrame()    # return empty dataframe
            buy_df = pd.DataFrame()     # return empty dataframe
            break   # return with empty dataframe

        # end of try except else finally

        # # dict = res_dict.json()  # ★ RequestJSONDecodeError() => moved to try...except

        # # {'status': 0,
        # #  'data': {
        # #   'asks': [{'price': '4042000', 'size': '0.0005'},
        # #    {'price': '4045000', 'size': '0.0028'},
        # #    {'price': '4045018', 'size': '0.0001'},
        # #    {'price': '4049000', 'size': '0.001'},
        # #    {'price': '4049310', 'size': '0.0329'},
        # #    {'price': '4049520', 'size': '0.0125'},
        # #    {'price': 5381822.0, 'size': '0.001'}],
        # #   'bids': [{'price': 5013050.0, 'size': '0.0749'},
        # #    {'price': 5013000.0, 'size': '0.0015'},
        # #    {'price': 5012425.0, 'size': '0.05'},
        # #    {'price': 5012420.0, 'size': '0.05'},
        # #    {'price': 4740000.0, 'size': '0.2135'}],
        # #   'symbol': 'BTC'},

        ### Normal Case

        ####################################################### debug info
        # print('-'*100, 'dump response from get_orderbooks()')
        # print(dict)
        # print('-'*100, 'dump response from get_orderbooks()')
        ####################################################### debug info

        status = dict.get('status')

        if status == 0:
            data_dict = dict.get('data')

            asks = data_dict.get('asks') # sell order info (ascending order)
            bids = data_dict.get('bids') # buy order info (descending order)

            sell_df = pd.DataFrame(asks)
            buy_df = pd.DataFrame(bids)

            # {'asks': [{'price': '4064331', 'size': '0.0001'},
            #   {'price': '4069888', 'size': '0.0309'},
            #   {'price': '4070000', 'size': '0.0073'},
            #   {'price': '4070620', 'size': '0.001'},
            #   {'price': 5381822.0, 'size': '0.001'}],

            #  'bids': [{'price': 5013050.0, 'size': '0.0749'},
            #    {'price': 5013000.0, 'size': '0.0015'},
            #    {'price': 5012425.0, 'size': '0.05'},
            #    {'price': 5012420.0, 'size': '0.05'},
            #    {'price': 4740000.0, 'size': '0.2135'}],

            # Data columns (total 2 columns):
            #  #   Column    Non-Null Count  Dtype
            # ---  ------    --------------  -----
            #  0   price     1000 non-null   float64
            #  1   quantity  1000 non-null   float64
            # dtypes: float64(2)


            if sell_df.shape[0] > 0:
                # convert data types
                sell_df = sell_df.astype({'price': 'float', 'size': 'float'})
                # rename column name
                sell_df.rename(columns={'size': 'quantity'}, inplace=True)

            if buy_df.shape[0] > 0:
                # convert data types
                buy_df = buy_df.astype({'price': 'float', 'size': 'float'})
                # rename column name
                buy_df.rename(columns={'size': 'quantity'}, inplace=True)

        else:   # error return
            msg_list = dict.get('messages')
            msg_code = msg_list[0].get('message_code')
            msg_str = msg_list[0].get('message_string')

            if status == 5:   # Maintenance
                print(f"GMO Maintenance: get_orderbooks({symbol}) ▶ {status=}, {msg_code} - {msg_str} quit python...")
                quit()

            else:   # status == ?
                print(f"Invalid Request: get_orderbooks({symbol}) ▶ {status=}, {msg_code} - {msg_str} error return with empty dataframe...")
                ###################################################### debug info
                print('-'*100, 'dump response from get_orderbooks()')
                print(dict)
                print('-'*100, 'dump response from get_orderbooks()')
                ##################################################### debug info
                sell_df = pd.DataFrame()    # return empty dataframe
                buy_df = pd.DataFrame()     # return empty dataframe

        # end if if status == 0:
        break
    # end of while true:

    # print(f"get_orderbooks({symbol=}) ▶ {status=}, {sell_df.shape=}, {buy_df.shape=}")

    return (status, sell_df, buy_df)    # status, sell_df(ascending order), buy_df(descending order)
リスト6: lib/com_lib.py
################################################################################
def get_datatable_style_data(df: pd.DataFrame , side: str, symbol: str) -> list:
    if side == 'ask':
        bar_color = 'rgba(230, 31, 7, 0.2)'
        font_color = 'rgba(230, 31, 7)'
    else:
        bar_color = 'rgba(13, 230, 49, 0.2)'
        font_color = 'rgba(13, 230, 49)'

    cell_bg_color = '#060606'

    if symbol == 'XRP_JPY':
        styles = []
        styles.append({
            'if': {'column_id': 'price'},
            'color': font_color,
            'background-color': cell_bg_color
        })
        styles.append({
            'if': {'column_id': 'quantity'},
            'color': 'white',
            'background-color': 'black'
        })
        return styles

    n_bins = 25

    bounds = [i * (1.0 / n_bins) for i in range(n_bins + 1)]
    quantity = df['quantity']
    ranges = [((quantity.max() - quantity.min()) * i) + quantity.min() for i in bounds]

    styles = []

    for i in range(1, len(bounds)):
        min_bound = ranges[i-1]
        max_bound = ranges[i]
        max_bound_percentage = math.floor(bounds[i] * 100)

        # linear-gradient(red 0%, orange 25%, yellow 50%, green 75%, blue 100%);
        # linear-gradient(red 10%, 30%, blue 90%);

        styles.append({
            'if': {
                'filter_query': ('{{quantity}} >= {min_bound}' +
                    (' && {{quantity}} < {max_bound}' if (i < (len(bounds)-1)) else '')
                    ).format(min_bound=min_bound, max_bound=max_bound),
                'column_id': 'quantity'
            },
            'background': (
                '''
                    linear-gradient(270deg,
                    {bar_color} 0% ,
                    {bar_color} {max_bound_percentage}%,
                    {cell_bg_color} {max_bound_percentage}%,
                    {cell_bg_color} 100%)
                '''.format(bar_color=bar_color, cell_bg_color=cell_bg_color,
                           max_bound_percentage=max_bound_percentage),
            ),
            'paddingBottom': 2,
            'paddingTop': 2,
        })
    # for i in range(1, len(bounds)):

    styles.append({
        'if': {'column_id': 'price'},
        'color': font_color,
        'background-color': cell_bg_color
    })

    return styles
リスト7: assets/article142.css
#coin-dl .Select-control {
    background-color: rgb(25, 25, 25) !important;
    color:white;
  }

#coin-dl .Select-value-label {
    color: white !important;
}

#coin-dl .Select-menu-outer {
    background-color: rgb(25, 25, 25);
    color: white;
}