-
まずは、Pythonの開発環境を準備する
まずは、
「記事(Article137)」を参照して、
Pythonの開発環境を準備してください。
ここでは、Pythonのプロジェクトフォルダとして「Plotly」を使用しています。
 図1
図1は、Visual Studio Code(VS Code)の「Terminal」メニューから「New Terminal」を選択して、
「Terminal」ウィンドウを開いたときの画面です。
緑色の「(venv)」が表示されていれば、 Pythonの仮想環境が正常に作成されていることになります。
図1
図1は、Visual Studio Code(VS Code)の「Terminal」メニューから「New Terminal」を選択して、
「Terminal」ウィンドウを開いたときの画面です。
緑色の「(venv)」が表示されていれば、 Pythonの仮想環境が正常に作成されていることになります。
-
Visual Studio Codeを起動してプログラムファイルを作成する
Pythonの開発環境の準備が完了したら、 VS Codeを起動して新規のPythonファイル(*.py)を作成します。
ここで作成したPythonのファイルには「リスト11-1」のコードをコピペします。
 図2
図2は、VS Codeの画面です。
図2
図2は、VS Codeの画面です。
-
Plotly ExpressのgapminderデータをPandasのDataFrameに取り込む
ここでは、
Plotly Expressが用意している「gapminder」データを
PandasのDataFrameに取り込んで後述するステップで利用します。
# 1: load data from plotly express gapminder()
raw_df = px.data.gapminder()
# raw_df.info()
# raw_df['continent].value_counts()
# raw_df['continent'].unique()
# raw_df['year'].unique()
# len(raw_df['country'].unique().tolist())
asia_df = raw_df.query("continent=='Asia'")
# asia_df['country'].unique()
japan_df = raw_df.query("country=='Japan'")
# japan_df
# df = raw_df.copy()
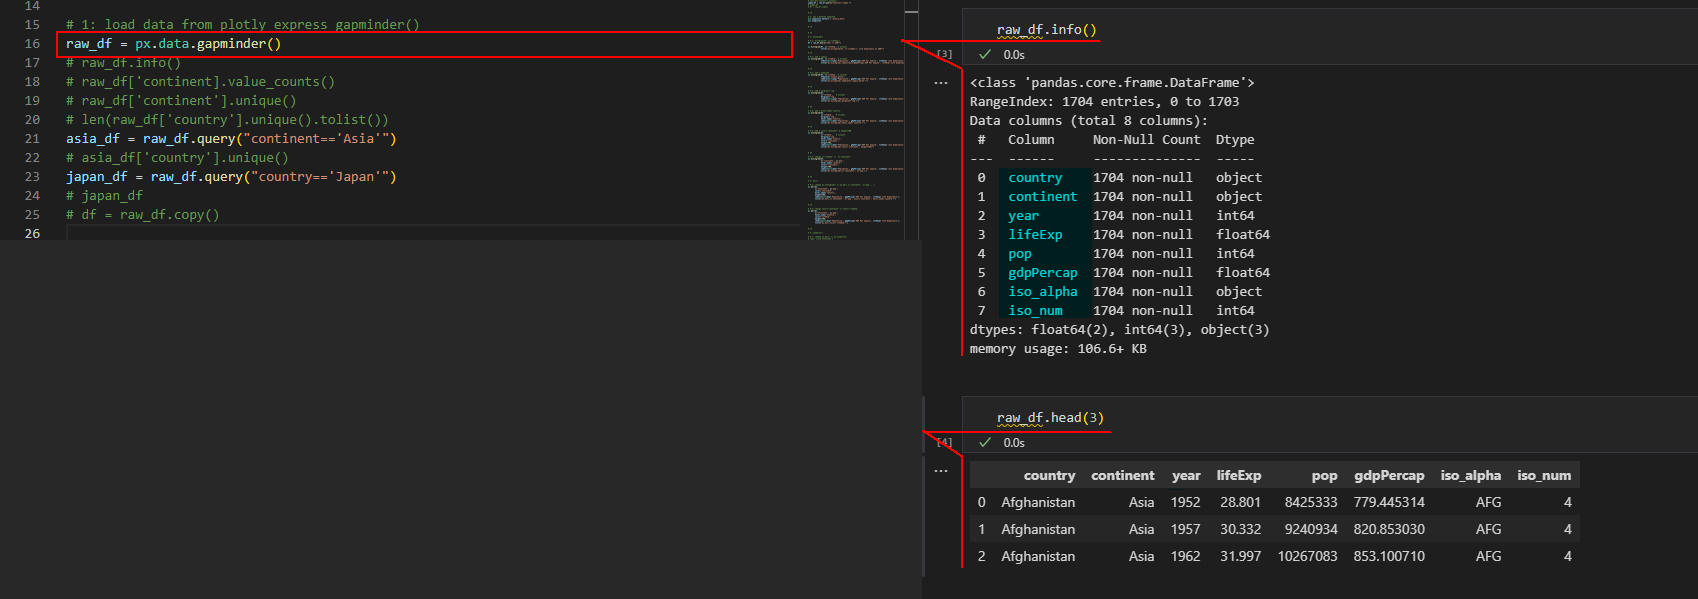 図3-1
図3-1では、「px.data.gapminder()」メソッドで
世界の各種データをPandasのDataFrameに取り込んでいます。
DataFrameは「country, continent, year, lifeExp, pop, gdpPercap,...」
などのカラムから構成されています。
「country」には「国名」、 「continent」には「大陸名」、
「year」には「年度」、 「lefeExp」には「平均寿命」、「pop」には「人口」、
「gdpPercap」には「一人当たりの国内総生産]が格納されています。
「raw_df.head(3)」では、DataFrameの先頭から3件のデータを表示しています。
図3-1
図3-1では、「px.data.gapminder()」メソッドで
世界の各種データをPandasのDataFrameに取り込んでいます。
DataFrameは「country, continent, year, lifeExp, pop, gdpPercap,...」
などのカラムから構成されています。
「country」には「国名」、 「continent」には「大陸名」、
「year」には「年度」、 「lefeExp」には「平均寿命」、「pop」には「人口」、
「gdpPercap」には「一人当たりの国内総生産]が格納されています。
「raw_df.head(3)」では、DataFrameの先頭から3件のデータを表示しています。
 図3-2
図3-2では、DataFrameのカラム「continent, year」の内容を表示しています。
「continent」には「Asia, Europe, Africa, Americas, Oceania」が格納されています。
「year」には、「1952,1957,...2007」のように年度が5年間隔で格納されています。
「country」には、世界142カ国の国名が格納されています。
図3-2
図3-2では、DataFrameのカラム「continent, year」の内容を表示しています。
「continent」には「Asia, Europe, Africa, Americas, Oceania」が格納されています。
「year」には、「1952,1957,...2007」のように年度が5年間隔で格納されています。
「country」には、世界142カ国の国名が格納されています。
-
Plotlyのデフォルトのテーマをダークモードに設定する
ここでは、pioクラスの「templates.defulat」に
デフォルトのテーマ「plotly_dark」を設定してダークモードにしています。
# 2: set a defulat template
pio.templates.default = 'plotly_dark'
pio.templates
 図4
図4では、pioクラスの「templates」に格納されている、Plotlyのテーマの一覧を表示しています。
図4
図4では、pioクラスの「templates」に格納されている、Plotlyのテーマの一覧を表示しています。
-
Plotly ExpressのHistogram(ヒストグラム)でデータを可視化して見る
ここでは、Plotly Expressのヒストグラムでデータを可視化します。
# 3: histogram()

# 3-1: histogram(df, x='lifeExp')
df = raw_df.query("year == 2007")

px.histogram(df, x='lifeExp',
             title="px.histogram(df, x='lifeExp'): Life Expectancy in 2007")


# %%

# 3-2: add a lables
px.histogram(df, x='lifeExp',
             labels=dict(pop='Population', gdpPercap='GDP Per Capita', lifeExp='Life Expectancy'),
             title="px.histogram(,labels=dict(gdpPercap='GDP Per Capita', lifeExp='Life Expectancy', continent='Continent'))")


# %%

# 3-3: add a template
px.histogram(df, x='lifeExp',
             template='simple_white',
             labels=dict(pop='Population', gdpPercap='GDP Per Capita', lifeExp='Life Expectancy'),
             title="px.histogram(,template='simple_white')")


# %%

# 3-4: add a bargap=0.02
px.histogram(df, x='lifeExp',
             title="px.histogram(df, x='lifeExp') + update_layout(bargap=0.02)") \
             .update_layout(bargap=0.02)


# %%

# 3-5: add a marginal='rug'
px.histogram(df,
             x='lifeExp',
             marginal='rug',
             labels=dict(pop='Population', gdpPercap='GDP Per Capita', lifeExp='Life Expectancy'),
             title="px.histogram(,marginal='rug')") \
             .update_layout(bargap=0.02)


# %%

# 3-5: add a hover_name='country'
px.histogram(df,
             x='lifeExp',
             marginal='rug',
             hover_name='country',
             labels=dict(pop='Population', gdpPercap='GDP Per Capita', lifeExp='Life Expectancy'),
             title="px.histogram(,hover_name='country')") \
             .update_layout(bargap=0.02)


# %%

# 3-6: add a color='continent' & height=700
px.histogram(df,
             x='lifeExp',
             marginal='rug',
             hover_name='country',
             color='continent',
             height=700,
             labels=dict(pop='Population', gdpPercap='GDP Per Capita', lifeExp='Life Expectancy'),
             title="px.histogram(,color='continent', height=700)") \
             .update_layout(bargap=0.02)


# %%

# 3-7: change x='lifeExp' =>  x='continent'
px.histogram(df,
             x='continent', y='pop',
             hover_name='country',
             color='continent',
             height=700,
             labels=dict(pop='Population', gdpPercap='GDP Per Capita', lifeExp='Life Expectancy'),
             title="px.histogram(,x='continent', y='pop')") \
             .update_layout(bargap=0.02)
 図5-1
図5-1では、Plotly Expressのhistogram()メソッドに引数「df, x」を指定してヒストグラムを作成しています。
ここでは、引数「x」に「lifeExp」を指定しています。
ヒストグラムには、平均寿命が5歳間隔で表示されています。
図5-1
図5-1では、Plotly Expressのhistogram()メソッドに引数「df, x」を指定してヒストグラムを作成しています。
ここでは、引数「x」に「lifeExp」を指定しています。
ヒストグラムには、平均寿命が5歳間隔で表示されています。
 図5-2
図5-2では、histogram()メソッドの引数に「labels=」を追加して
X軸のラベルを「lifeExp」から「Life Expectancy」にしています。
図5-2
図5-2では、histogram()メソッドの引数に「labels=」を追加して
X軸のラベルを「lifeExp」から「Life Expectancy」にしています。
 図5-3
図5-3では、histogram()メソッドの引数に「template=」を追加して
デフォルトのテーマを「simple_white」に切り替えています。
図5-3
図5-3では、histogram()メソッドの引数に「template=」を追加して
デフォルトのテーマを「simple_white」に切り替えています。
 図5-4
図5-4では、「update_layout()」メソッドに引数「bargap=0.02」を追加して、
棒グラフの間に隙間(ギャップ)をつくっています。
図5-4
図5-4では、「update_layout()」メソッドに引数「bargap=0.02」を追加して、
棒グラフの間に隙間(ギャップ)をつくっています。
 図5-5
図5-5では、histogram()メソッドの引数に「marginal='rug'」を追加して、
x軸にラグ(マーカー)を表示させています。
ラグを追加するとデータの分布を視覚的に理解するのに役立ちます。
ここでは、ラグにマウスを移動してホバーテキストを表示しています。
ホバーテキストに「Life Expenctancy=39.613」が表示されています。
これは、平均寿命が約39歳の国が存在することを意味します。
図5-5
図5-5では、histogram()メソッドの引数に「marginal='rug'」を追加して、
x軸にラグ(マーカー)を表示させています。
ラグを追加するとデータの分布を視覚的に理解するのに役立ちます。
ここでは、ラグにマウスを移動してホバーテキストを表示しています。
ホバーテキストに「Life Expenctancy=39.613」が表示されています。
これは、平均寿命が約39歳の国が存在することを意味します。
 図5-6
図5-6では、histogram()メソッドの引数に「hover_name='country'」を追加して、
ホバーテキストに「国名」が表示されるようにしています。
ここでは、
ホバーテキストに国名「Swaziland」が表示されています。
図5-6
図5-6では、histogram()メソッドの引数に「hover_name='country'」を追加して、
ホバーテキストに「国名」が表示されるようにしています。
ここでは、
ホバーテキストに国名「Swaziland」が表示されています。
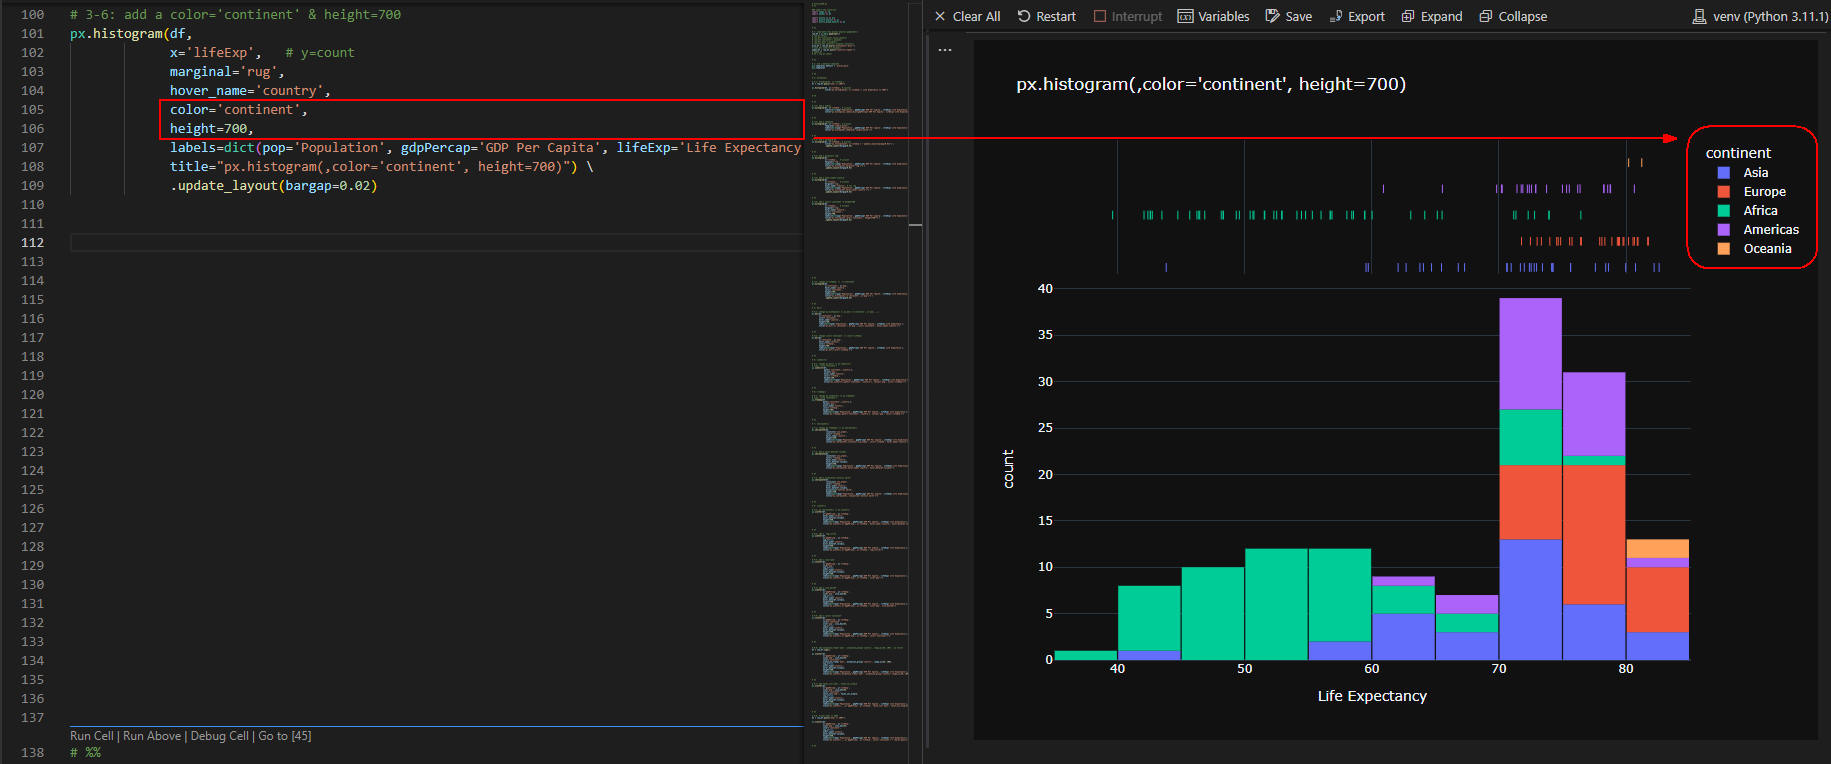 図5-7
図5-7では、histogram()メソッドの引数に「color='continent'」を追加して
各大陸ごとに色分けされたヒストグラムを作成しています。
このグラフからは、
アフリカ大陸が平均寿命が低く、
アジア、ヨーロッパ大陸が平均寿命が高いことが分かります。
図5-7
図5-7では、histogram()メソッドの引数に「color='continent'」を追加して
各大陸ごとに色分けされたヒストグラムを作成しています。
このグラフからは、
アフリカ大陸が平均寿命が低く、
アジア、ヨーロッパ大陸が平均寿命が高いことが分かります。
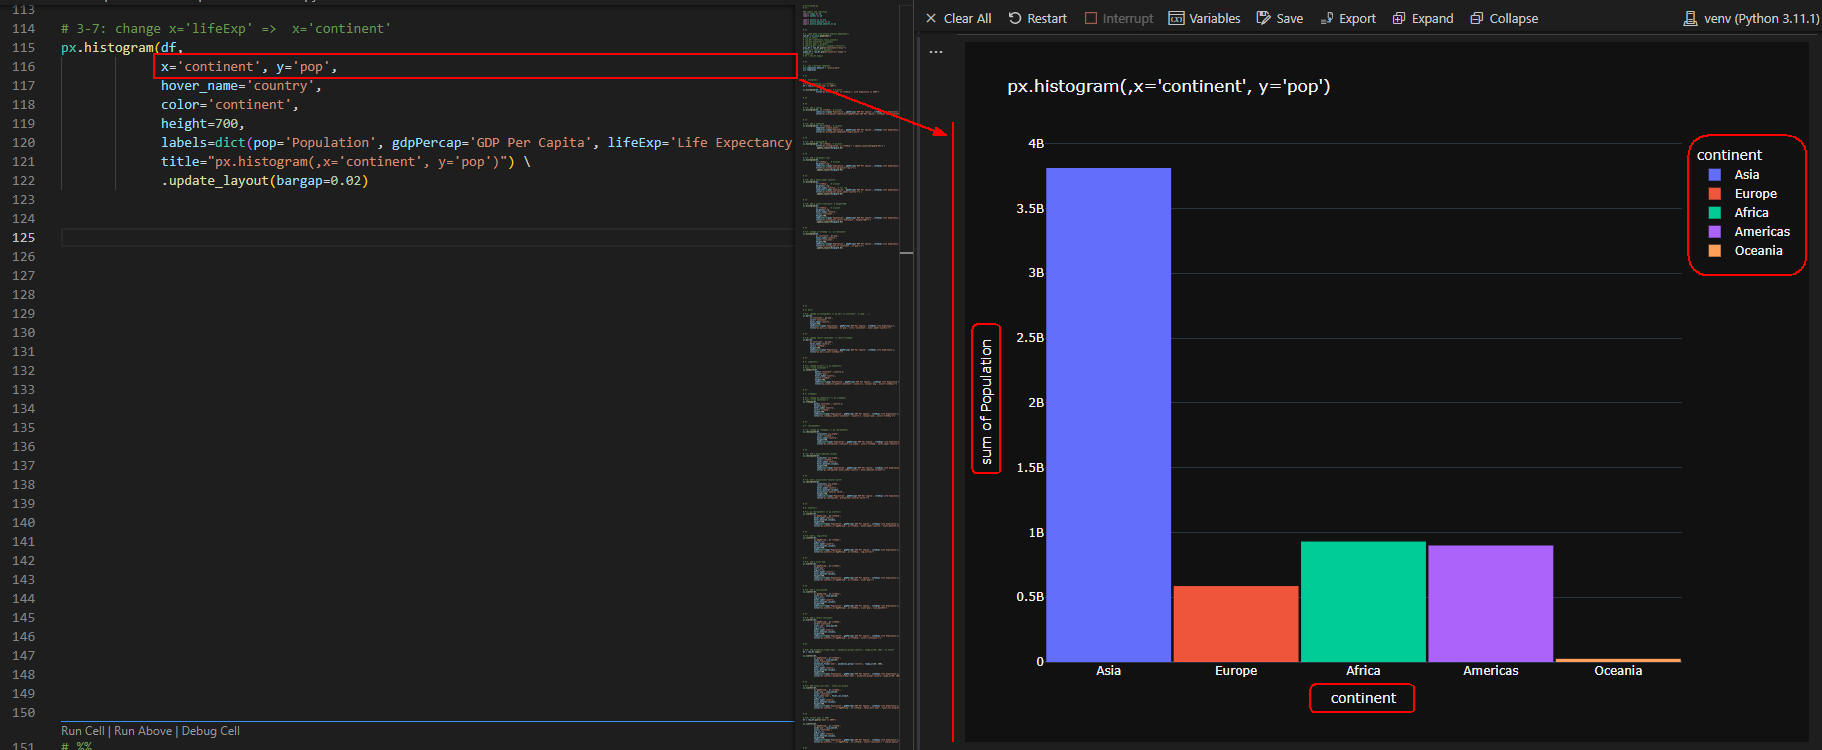 図5-8
図5-8では、histgram()メソッドの引数に「x='continent', y='pop'」を指定して、
大陸ごとの人口のヒストグラムを作成しています。
このグラフからは、アジア大陸が人口が圧倒的に多いことが分かります。
図5-8
図5-8では、histgram()メソッドの引数に「x='continent', y='pop'」を指定して、
大陸ごとの人口のヒストグラムを作成しています。
このグラフからは、アジア大陸が人口が圧倒的に多いことが分かります。
-
Plotly ExpressのBar Chart(棒グラフ)でデータを可視化して見る
ここでは、Plotly Expressの棒グラフでデータを可視化します。
# 4: bar()

# 4-1: change px.histogram() => px.bar( x='continent', y='pop',...)
px.bar(df,
       x='continent', y='pop',
       color='continent',
       hover_name='country',
       height=700,
       labels=dict(pop='Population', gdpPercap='GDP Per Capita', lifeExp='Life Expectancy'),
       title="px.bar(,x='continent', y='pop', color='continent', hover_name='country')")


# %%

# 4-2: change color='continent' => color='lifeExp'
px.bar(df,
       x='continent', y='pop',
       hover_name='country',
       color='lifeExp',
       height=700,
       labels=dict(pop='Population', gdpPercap='GDP Per Capita', lifeExp='Life Expectancy'),
       title="px.bar(,color='lifeExp')")
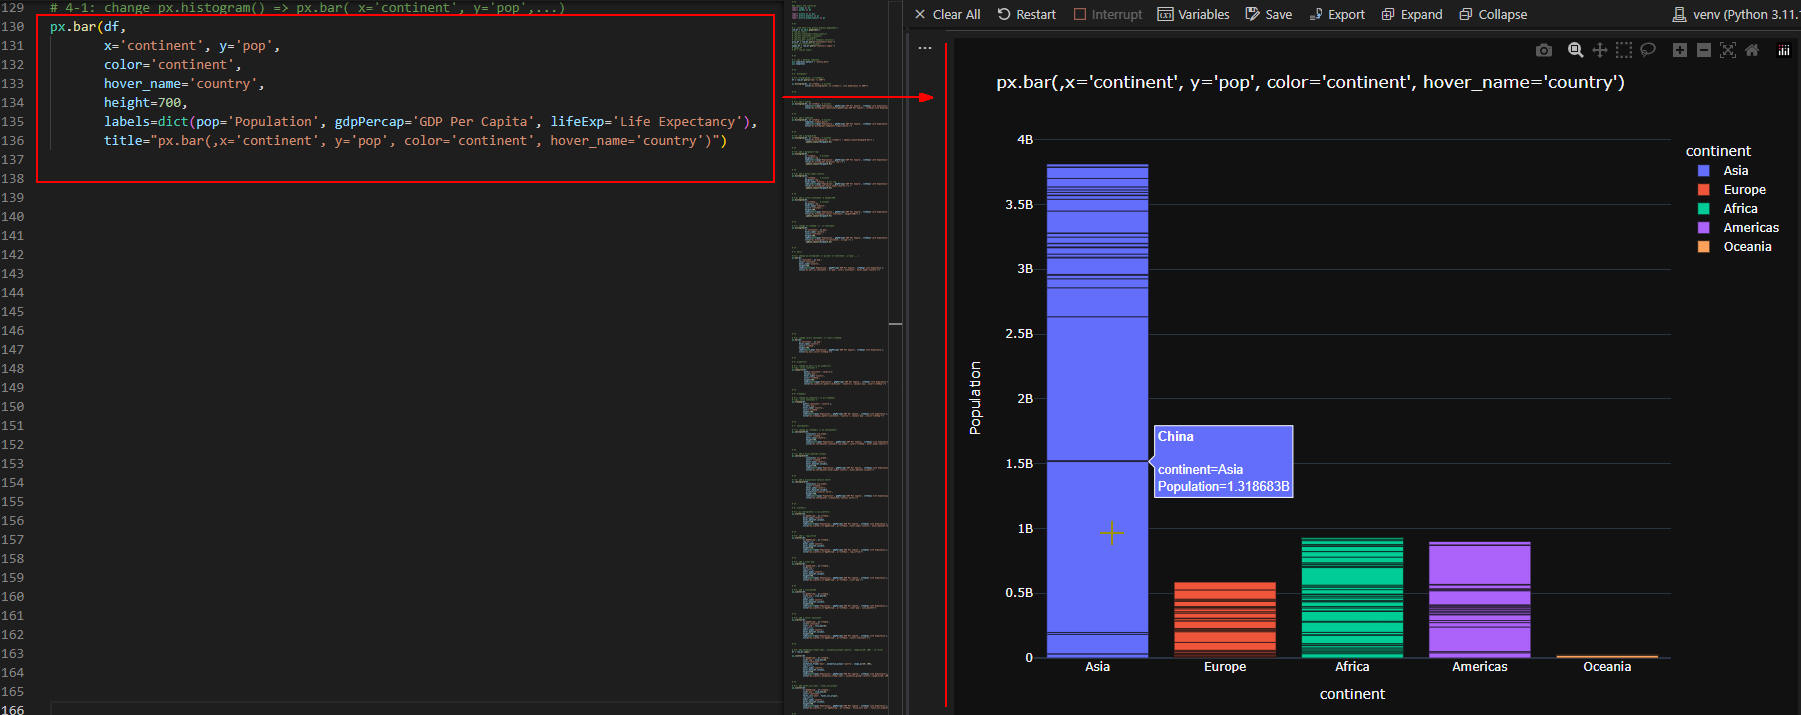 図6-1
図6-1では、大陸ごとの人口を棒グラフで可視化しています。
このグラフからは、アジア大陸の人口が圧倒的に多いことが分かります。
図6-1
図6-1では、大陸ごとの人口を棒グラフで可視化しています。
このグラフからは、アジア大陸の人口が圧倒的に多いことが分かります。
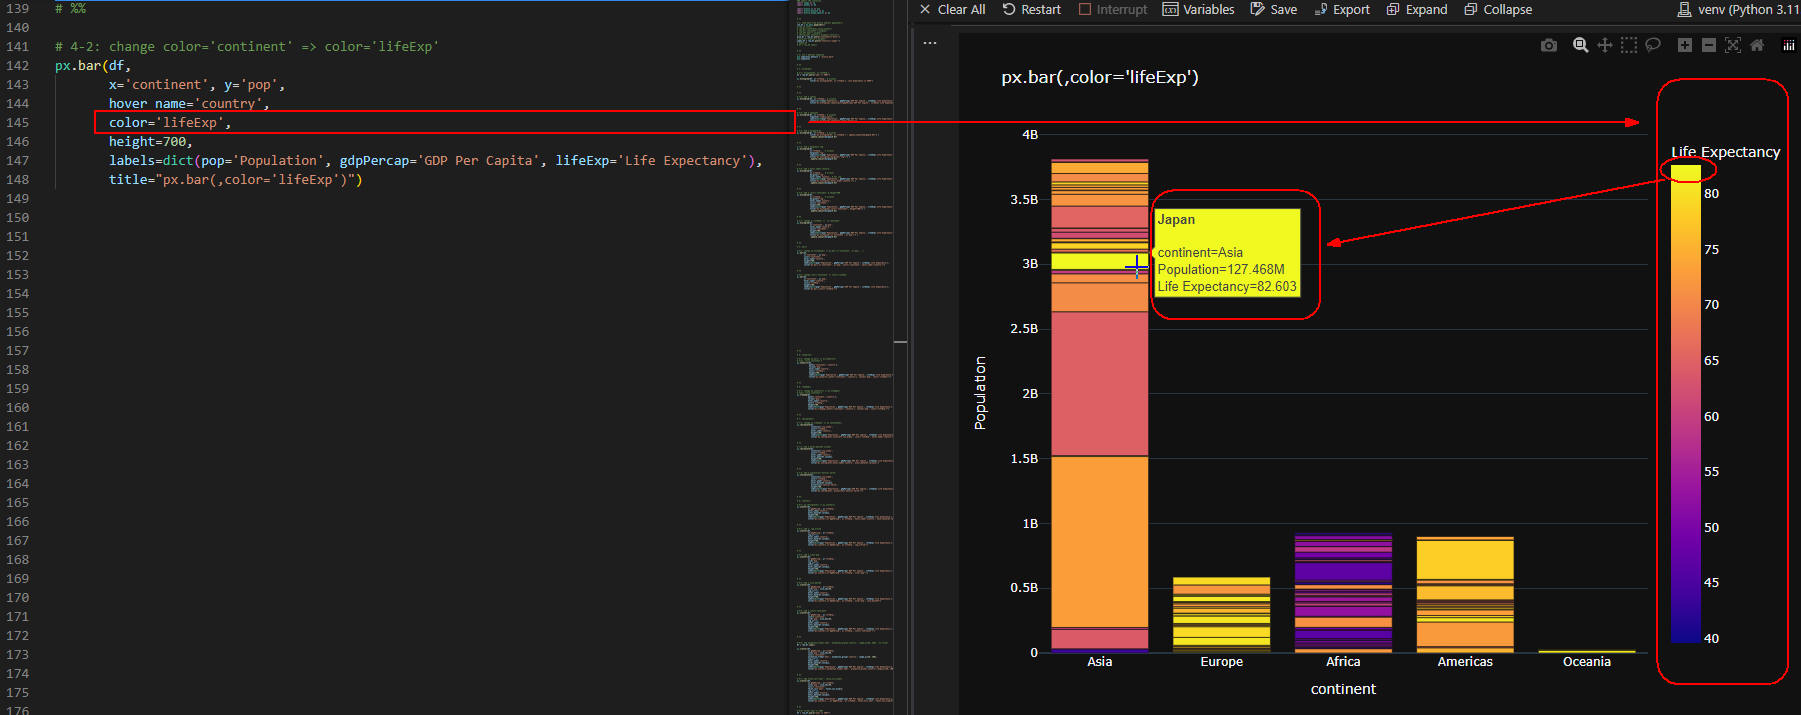 図6-2
図6-2では、bar()メソッドの引数に「color='lifeExp'」を追加して
グラフにカラーマップを適用させています。
このグラフからは、平均寿命が高い国が各大陸にどのように分布しているかが分かります。
図6-2
図6-2では、bar()メソッドの引数に「color='lifeExp'」を追加して
グラフにカラーマップを適用させています。
このグラフからは、平均寿命が高い国が各大陸にどのように分布しているかが分かります。
-
Plotly ExpressのSunburst(サンバーストチャート)でデータを可視化して見る
ここでは、Plotly Expressのサンバーストチャートでデータを可視化します。
# 5: sunburst()

# 5-1: change px.bar() => px.sunburst()
px.sunburst(df,
            path=['continent','country'],
            values='pop',
            hover_name='country',
            color='lifeExp',
            height=700,
            labels=dict(pop='Population', gdpPercap='GDP Per Capita', lifeExp='Life Expectancy'),
            title="px.sunburst(,path=['continent','country'], values='pop', color='lifeExp')")
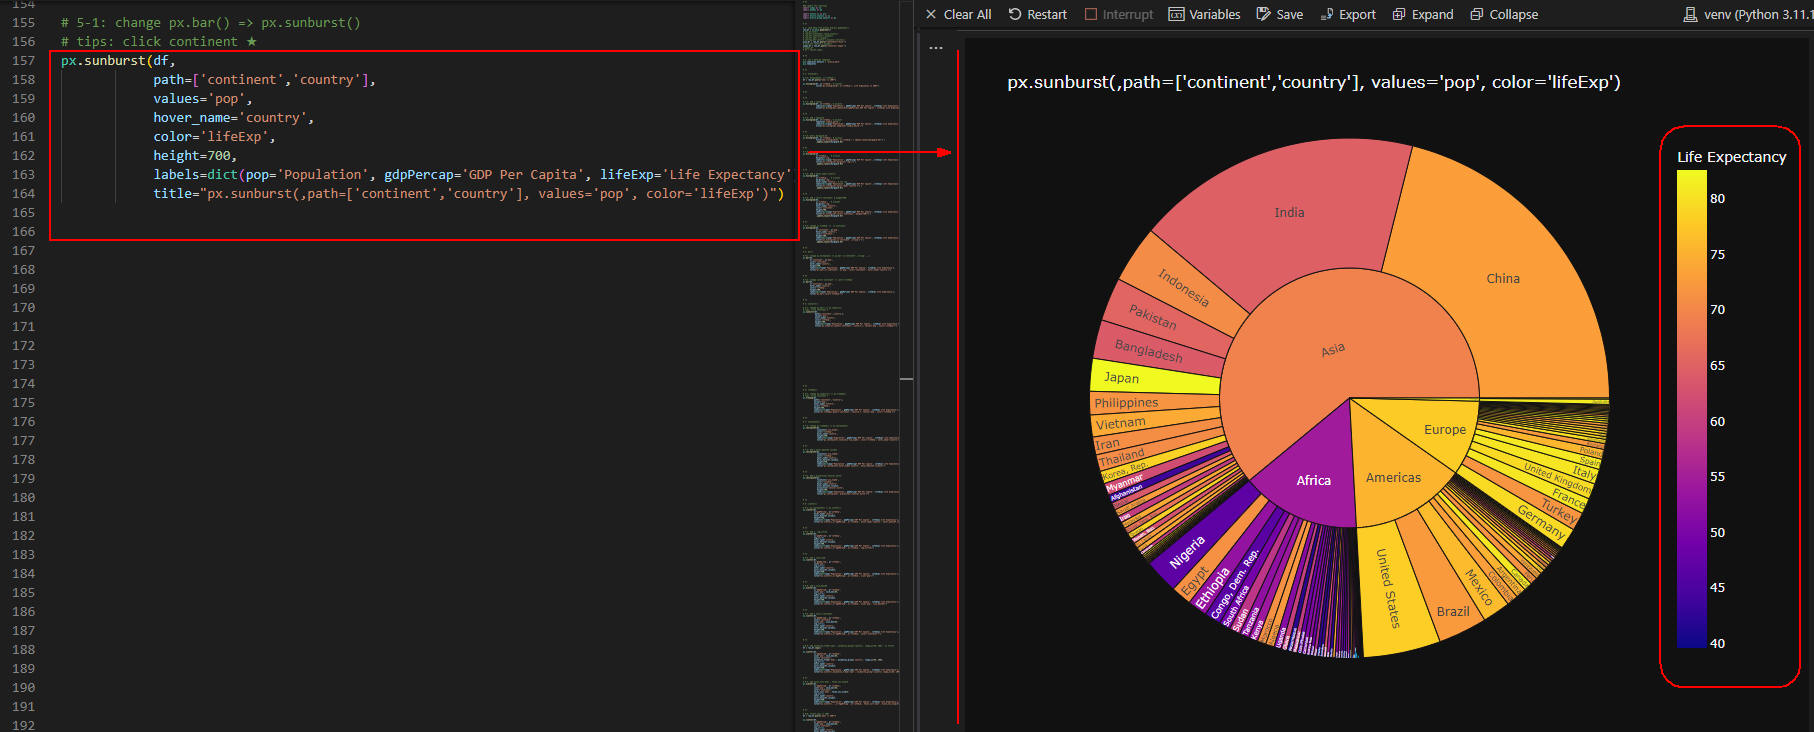 図7-1
図7-1では、大陸、国ごとの比率を円グラフで表示しています。
内側の円には、大陸の人口の比率が表示されています。
外側の円には、国ごとの人口の比率が表示されています。
このグラフからは、大陸と国ごとの人口の比率が同時に可視化できます。
図7-1
図7-1では、大陸、国ごとの比率を円グラフで表示しています。
内側の円には、大陸の人口の比率が表示されています。
外側の円には、国ごとの人口の比率が表示されています。
このグラフからは、大陸と国ごとの人口の比率が同時に可視化できます。
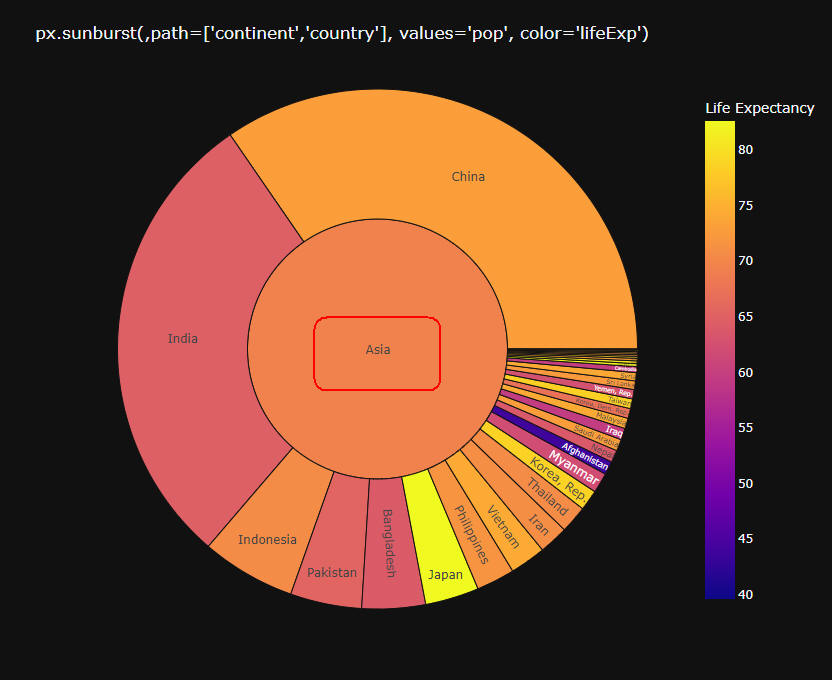 図7-2
図7-2では、グラフから「Asia」をクリックしてアジア大陸のみ拡大表示しています。
図7-2
図7-2では、グラフから「Asia」をクリックしてアジア大陸のみ拡大表示しています。
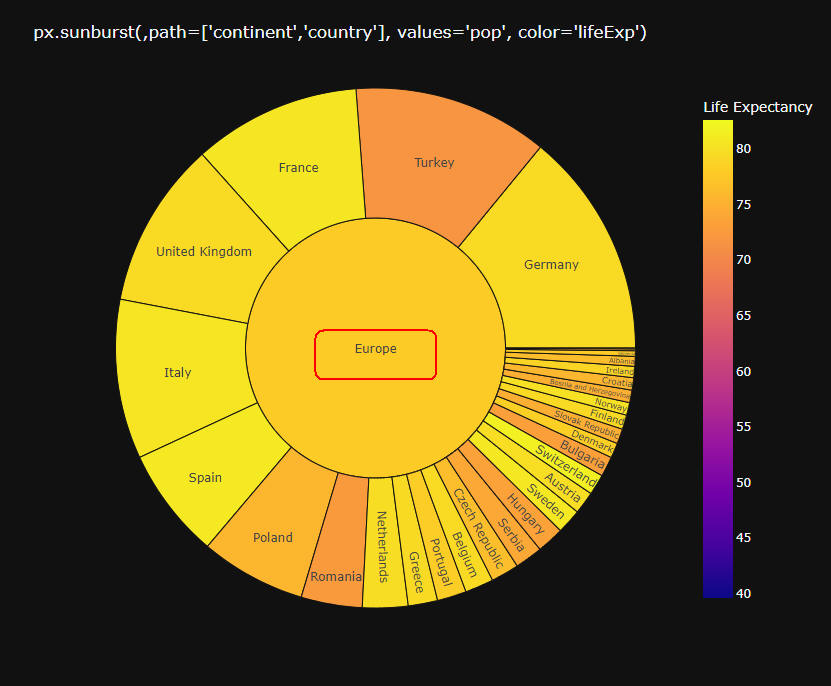 図7-3
図7-3では、グラフから「Europe」をクリックしてヨーロッパ大陸のみ拡大表示しています。
図7-3
図7-3では、グラフから「Europe」をクリックしてヨーロッパ大陸のみ拡大表示しています。
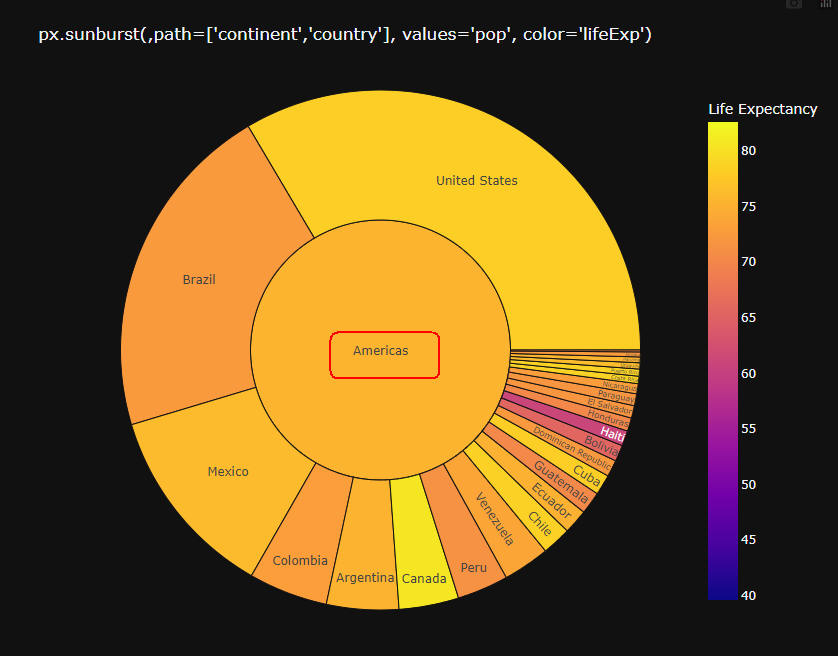 図7-4
図7-3では、グラフから「Americas」をクリックしてアメリカ大陸のみ拡大表示しています。
-
Plotly ExpressのTreemap(ツリーマップ)でデータを可視化して見る
ここでは、Plotly Expressのツリーマップでデータを可視化します。
# 6: treemap()

# 6-1: change px.sunburst() => px.treemap()
px.treemap(df,
           path=['continent','country'],
           values='pop',
           hover_name='country',
           color='lifeExp',
           height=700,
           labels=dict(pop='Population', gdpPercap='GDP Per Capita', lifeExp='Life Expectancy'),
           title="px.treemap(,path=['continent','country'], values='pop', color='lifeExp')")
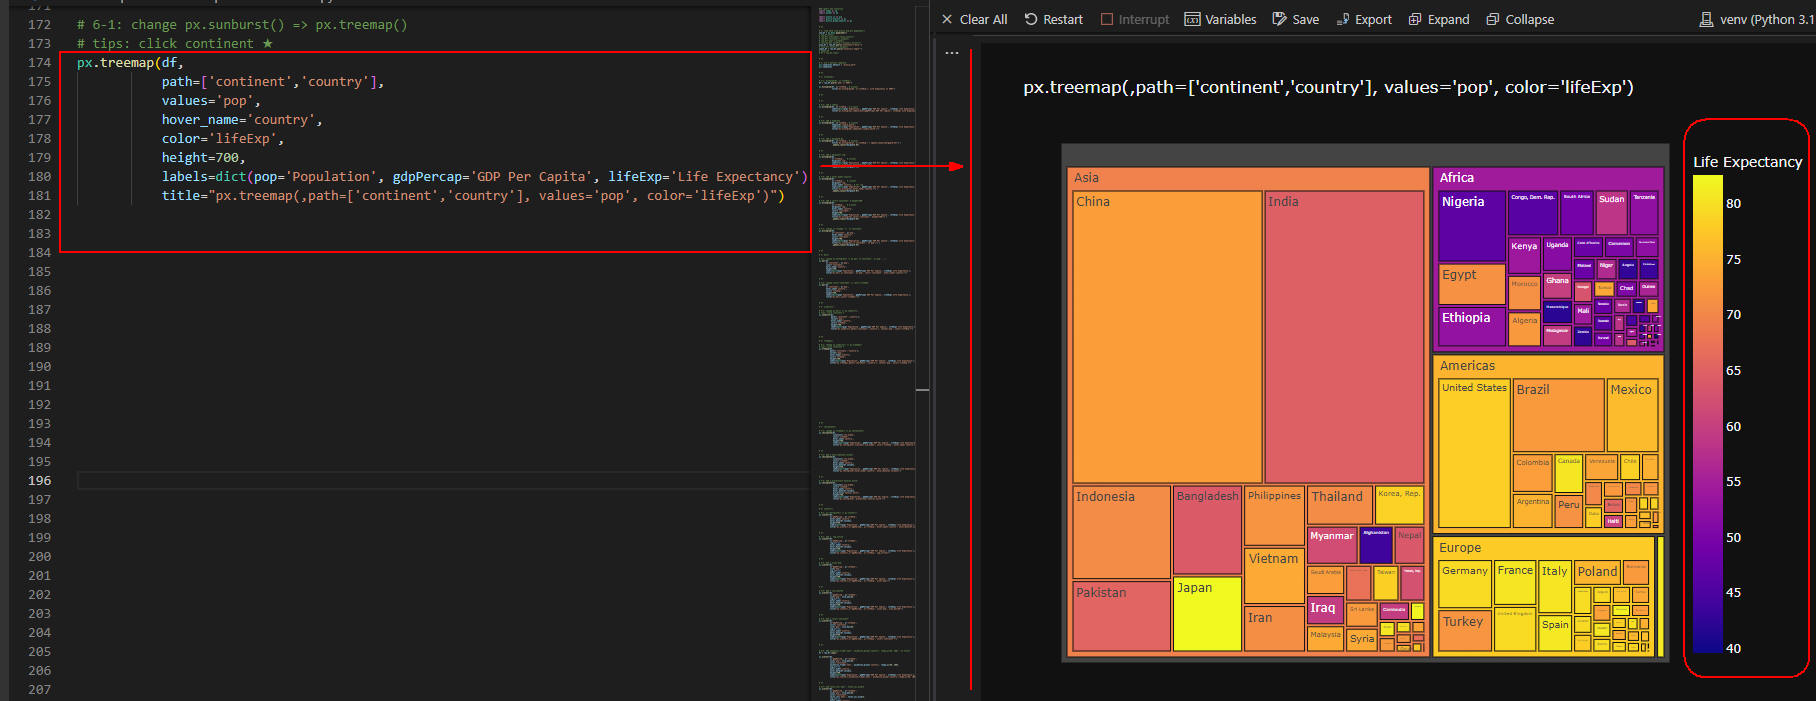 図8-1
図8-1では、大陸、国ごとの人口の比率をツリーマップで表示しています。
図8-1
図8-1では、大陸、国ごとの人口の比率をツリーマップで表示しています。
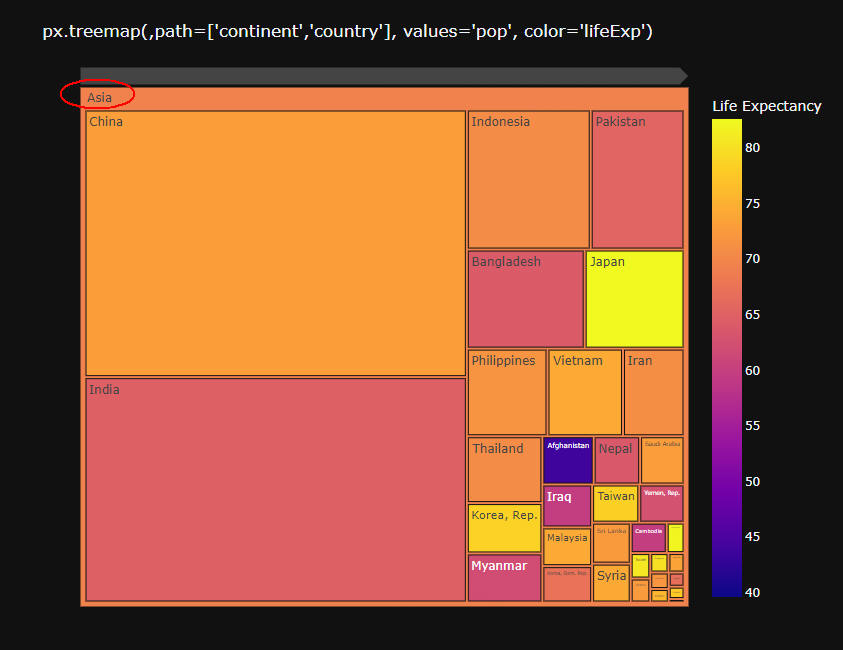 図8-2
図8-2では、ツリーマップから「Asia」をクリックしてアジア大陸のみ拡大表示しています。
図8-2
図8-2では、ツリーマップから「Asia」をクリックしてアジア大陸のみ拡大表示しています。
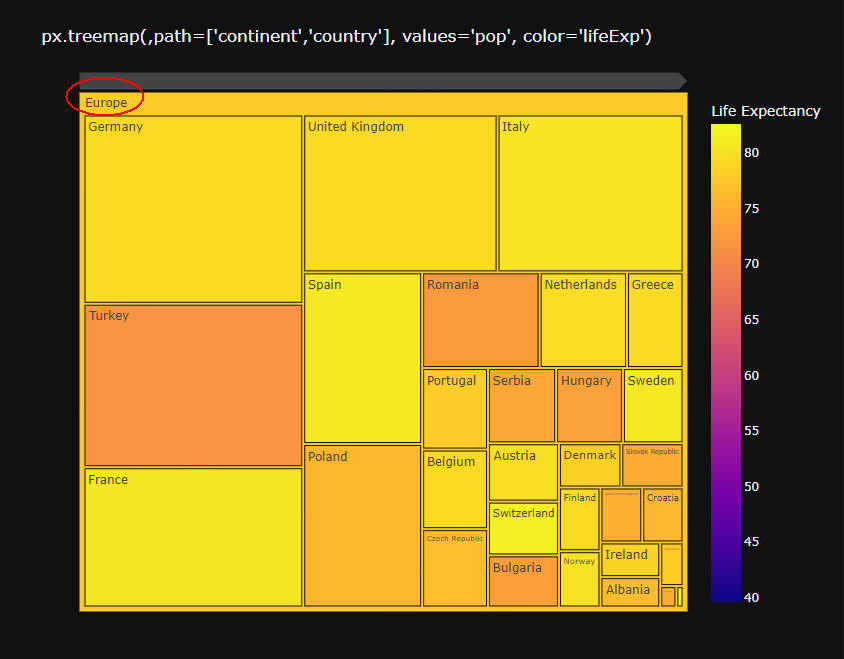 図8-3
図8-3では、ツリーマップから「Europe」をクリックしてヨーロッパ大陸のみ拡大表示しています。
図8-3
図8-3では、ツリーマップから「Europe」をクリックしてヨーロッパ大陸のみ拡大表示しています。
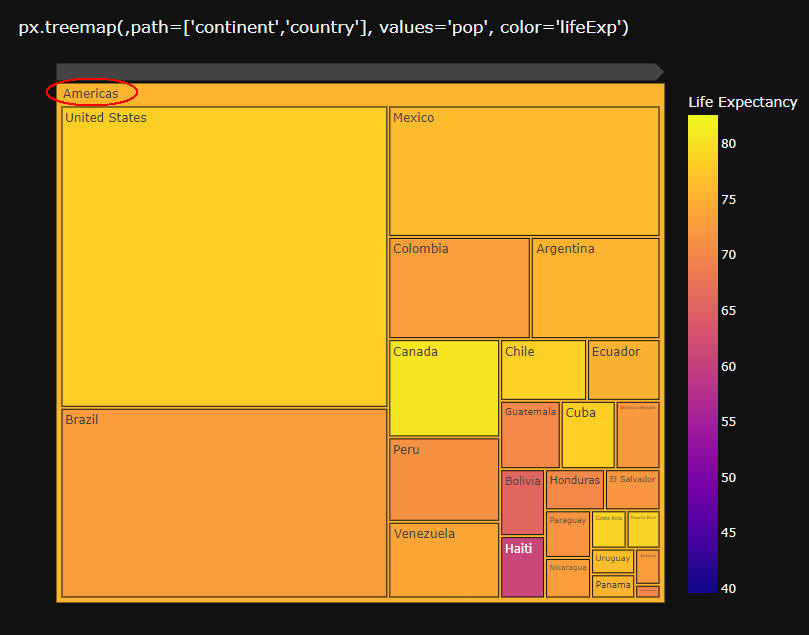 図8-4
図8-4では、ツリーマップから「Americas」をクリックしてアメリカ大陸のみ拡大表示しています
図8-4
図8-4では、ツリーマップから「Americas」をクリックしてアメリカ大陸のみ拡大表示しています
-
Plotly ExpressのChoropleth(コロプレス図)でデータを可視化して見る
ここでは、Plotly Expressのコロプレス図でデータを可視化します。
# 7: choropleth()

# 7-1: change px.treemap() => px.choropleth()
px.choropleth(df,
              locations='iso_alpha',
              color='lifeExp',
              hover_name='country',
              height=700,
              labels=dict(pop='Population', gdpPercap='GDP Per Capita', lifeExp='Life Expectancy'),
              title="px.choropleth(,lcations='iso_alpha', color='lifeExp', hover_name='country')")


# %%

# 7-2: add a hover_data=df.columns
px.choropleth(df,
              locations='iso_alpha',
              color='lifeExp',
              hover_name='country',
              hover_data=df.columns,
              height=700,
              labels=dict(pop='Population', gdpPercap='GDP Per Capita', lifeExp='Life Expectancy'),
              title="px.choropleth(,hover_name='country', hover_data=df.columns)")


# %%

# 7-3: add a projection='natural earth'
px.choropleth(df,
              locations='iso_alpha',
              color='lifeExp',
              hover_name='country',
              hover_data=df.columns,
              projection='natural earth',
              height=700,
              labels=dict(pop='Population', gdpPercap='GDP Per Capita', lifeExp='Life Expectancy'),
              title="px.choropleth(, projection='natural earth')")
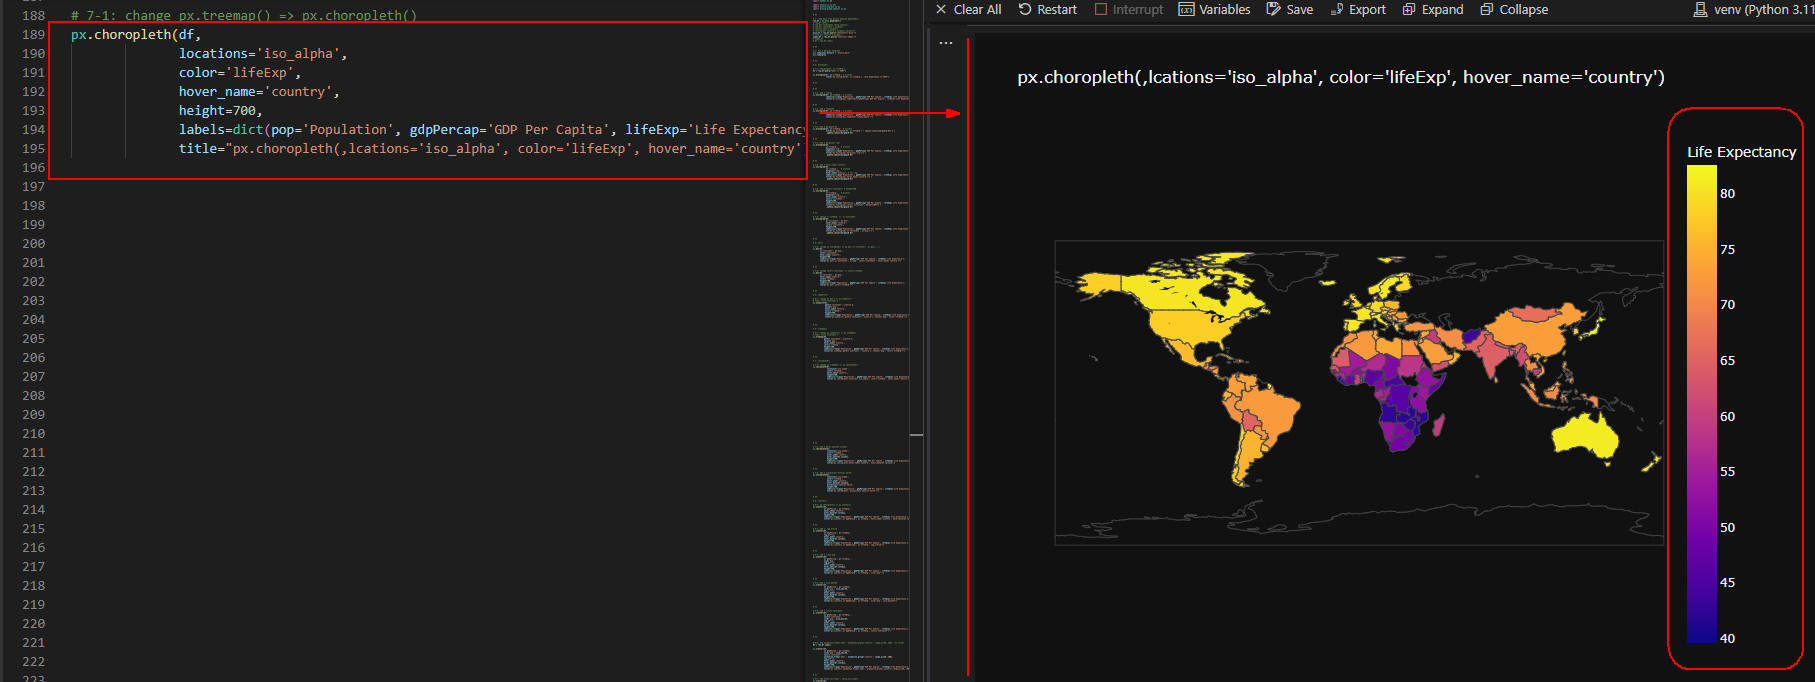 図9-1
図9-1では、世界地図にカラーマップを適用させて平均寿命の分布を表示させています。
このマップからアフリカ大陸の平均寿命が低いことが分かります。
図9-1
図9-1では、世界地図にカラーマップを適用させて平均寿命の分布を表示させています。
このマップからアフリカ大陸の平均寿命が低いことが分かります。
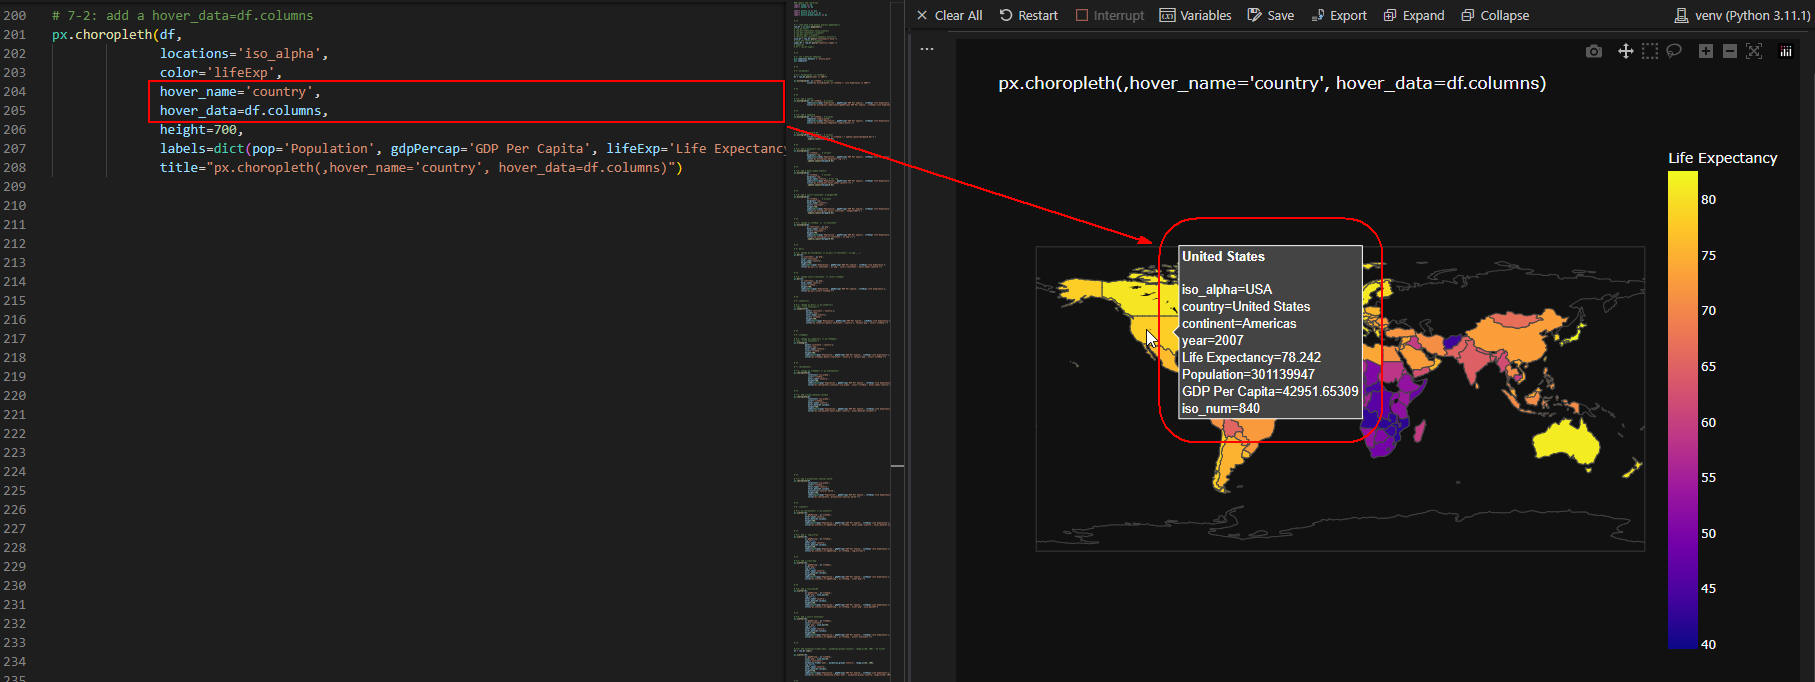 図9-2
図9-2では、choropleth()メソッドの引数に「hover_data=df.columns」を追加して、
ホバーテキストにDataFrameの全てのカラムを表示させています。
図9-2
図9-2では、choropleth()メソッドの引数に「hover_data=df.columns」を追加して、
ホバーテキストにDataFrameの全てのカラムを表示させています。
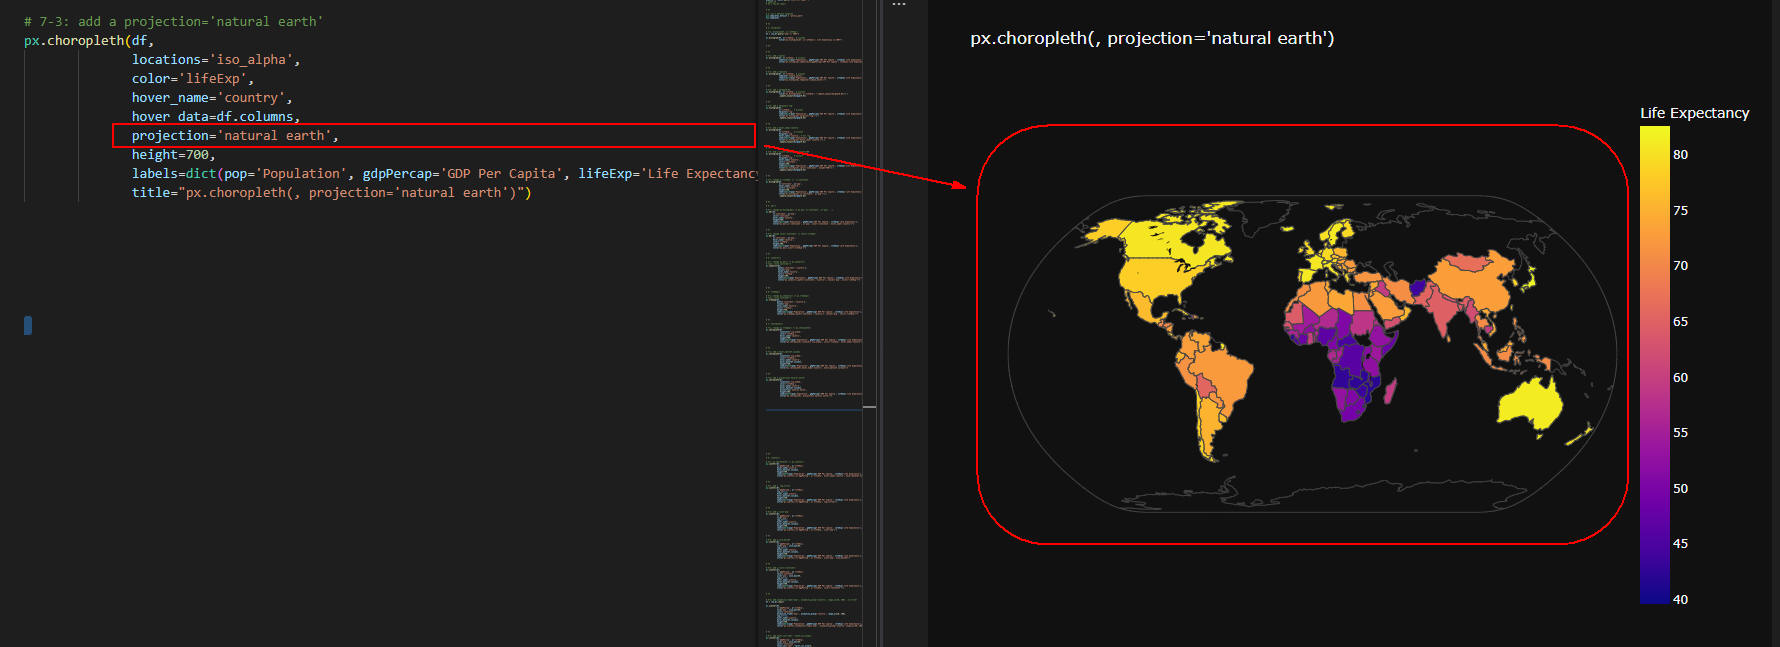 図9-3
図9-3では、choropleth()メソッドの引数に「projection='natural earth'」を追加して、
マップを地球儀のような形状で表示させています。
図9-3
図9-3では、choropleth()メソッドの引数に「projection='natural earth'」を追加して、
マップを地球儀のような形状で表示させています。
-
Plotly ExpressのScatter Plot(散布図)でデータを可視化して見る
ここでは、Plotly Expressの散布図でデータを可視化します。
# 8: scatter()

# 8-1: px.choropleth() => px.scatter()
px.scatter(df,
           x='gdpPercap', y='lifeExp',
           hover_name='country',
           hover_data=df.columns,
           height=700,
           labels=dict(pop='Population', gdpPercap='GDP Per Capita', lifeExp='Life Expectancy'),
           title="px.scatter(,x='dgpPercap', y='lifeExp', hover_name='country', hover_data=df.columns)")


# %%

# 8-2: add a  log_x=True
px.scatter(df,
           x='gdpPercap', y='lifeExp',
           log_x=True,
           hover_name='country',
           hover_data=df.columns,
           height=700,
           labels=dict(pop='Population', gdpPercap='GDP Per Capita', lifeExp='Life Expectancy'),
           title="px.scatter(,x='dgpPercap', y='lifeExp', log_x=True)")


# %%

# 8-3: add a size='pop'
px.scatter(df,
           x='gdpPercap', y='lifeExp',
           size='pop',
           log_x=True,
           hover_name='country',
           hover_data=df.columns,
           height=700,
           labels=dict(pop='Population', gdpPercap='GDP Per Capita', lifeExp='Life Expectancy'),
           title="px.scatter(,x='dgpPercap', y='lifeExp', size='pop')")


# %%

# 8-4: add a size_max=65
px.scatter(df,
           x='gdpPercap', y='lifeExp',
           size='pop', size_max=65,
           log_x=True,
           hover_name='country',
           hover_data=df.columns,
           height=700,
           labels=dict(pop='Population', gdpPercap='GDP Per Capita', lifeExp='Life Expectancy'),
           title="px.scatter(,x='dgpPercap', y='lifeExp', size='pop', size_max=65)")


# %%

# 8-5: add a color='continent'
px.scatter(df,
           x='gdpPercap', y='lifeExp',
           color='continent',
           size='pop', size_max=65,
           log_x=True,
           hover_name='country',
           hover_data=df.columns,
           height=700,
           labels=dict(pop='Population', gdpPercap='GDP Per Capita', lifeExp='Life Expectancy'),
           title="px.scatter(,x='dgpPercap', y='lifeExp', color='continent')")


# %%


# 8-6: add animation_frame='year', animation_group='country', range_y=[20, 100] : no filter
df = raw_df.copy()

px.scatter(df,
           x='gdpPercap', y='lifeExp',
           size='pop', size_max=65,
           color='continent',
           animation_frame='year', animation_group='country', range_y=[20, 100],
           log_x=True,
           hover_name='country',
           hover_data=df.columns,
           height=700,
           labels=dict(pop='Population', gdpPercap='GDP Per Capita', lifeExp='Life Expectancy'),
           title="px.scatter(,animation_frame='year', animation_group='country',range_y=[20, 100]) ")


# %%

# 8-7: add facet_col='year', facet_col_wrap=5
px.scatter(df,
           x='gdpPercap', y='lifeExp',
           size='pop', size_max=65,
           color='continent',
           facet_col='year', facet_col_wrap=5,
           log_x=True,
           hover_name='country',
           hover_data=df.columns,
           height=700,
           labels=dict(pop='Population', gdpPercap='GDP Per Capita', lifeExp='Life Expectancy'),
           title="px.scatter(...,x='dgpPercap', y='lifeExp', facet_col='year', facet_col_wrap=5) ")


# %%

# 8-8: filter year == 2007
df = raw_df.query("year == 2007")

px.scatter(df,
           x='gdpPercap', y='lifeExp',
           size='pop', size_max=65,
           color='continent',
           log_x=True,
           hover_name='country',
           hover_data=df.columns,
           height=700,
           labels=dict(pop='Population', gdpPercap='GDP Per Capita', lifeExp='Life Expectancy'),
           title="px.scatter(...,x='dgpPercap', y='lifeExp', color='continent') + raw_df.query('year == 2007') ")
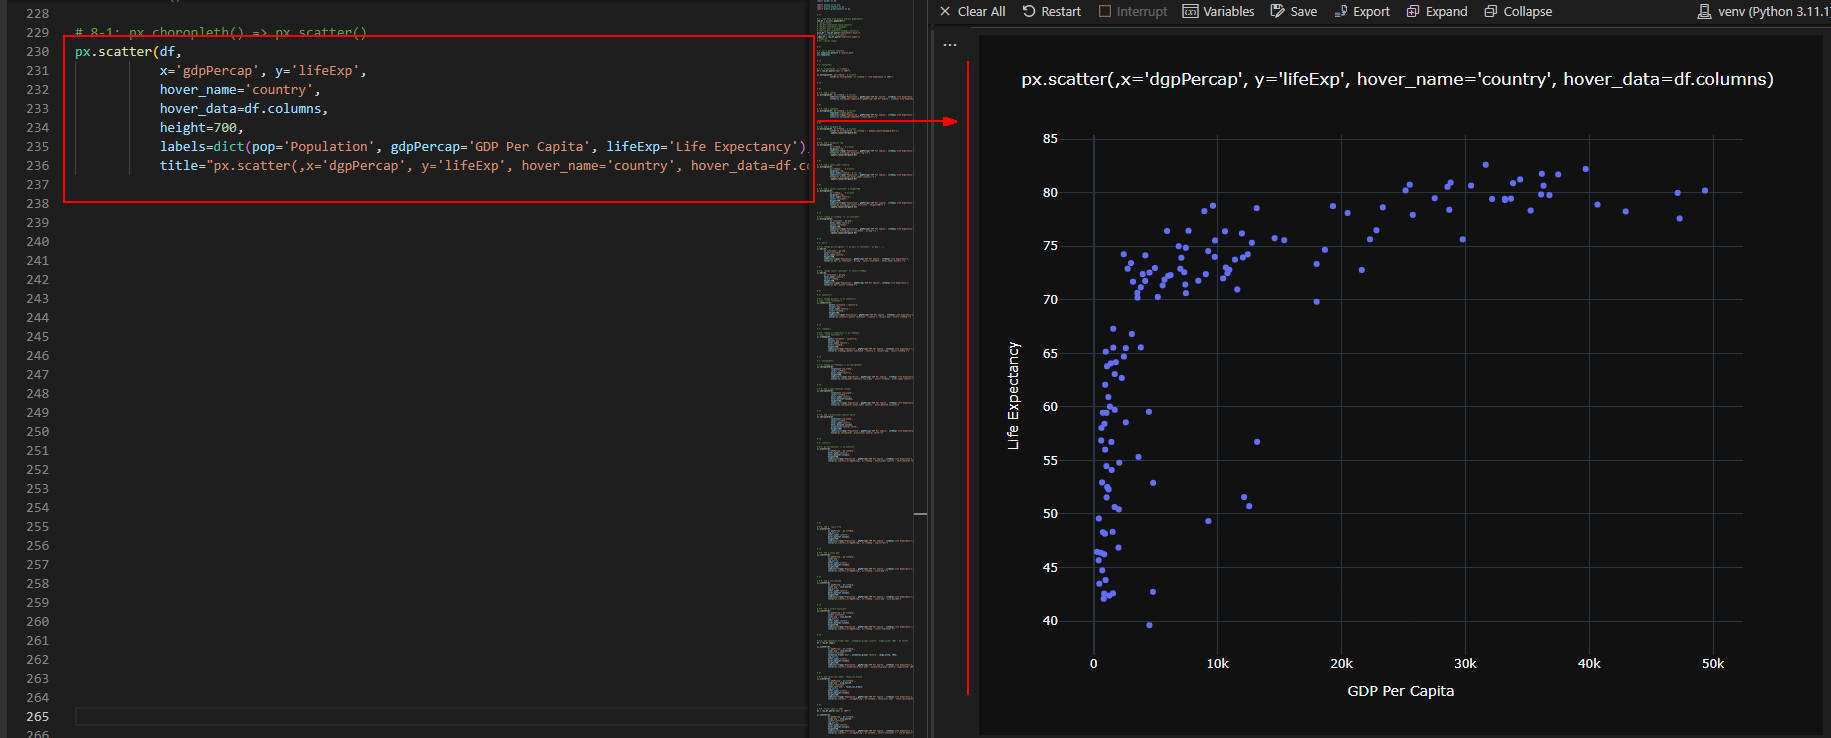 図10-1
図10-1では、国民一人当たりのGDPと平均寿命の散布図を表示しています。
図10-1
図10-1では、国民一人当たりのGDPと平均寿命の散布図を表示しています。
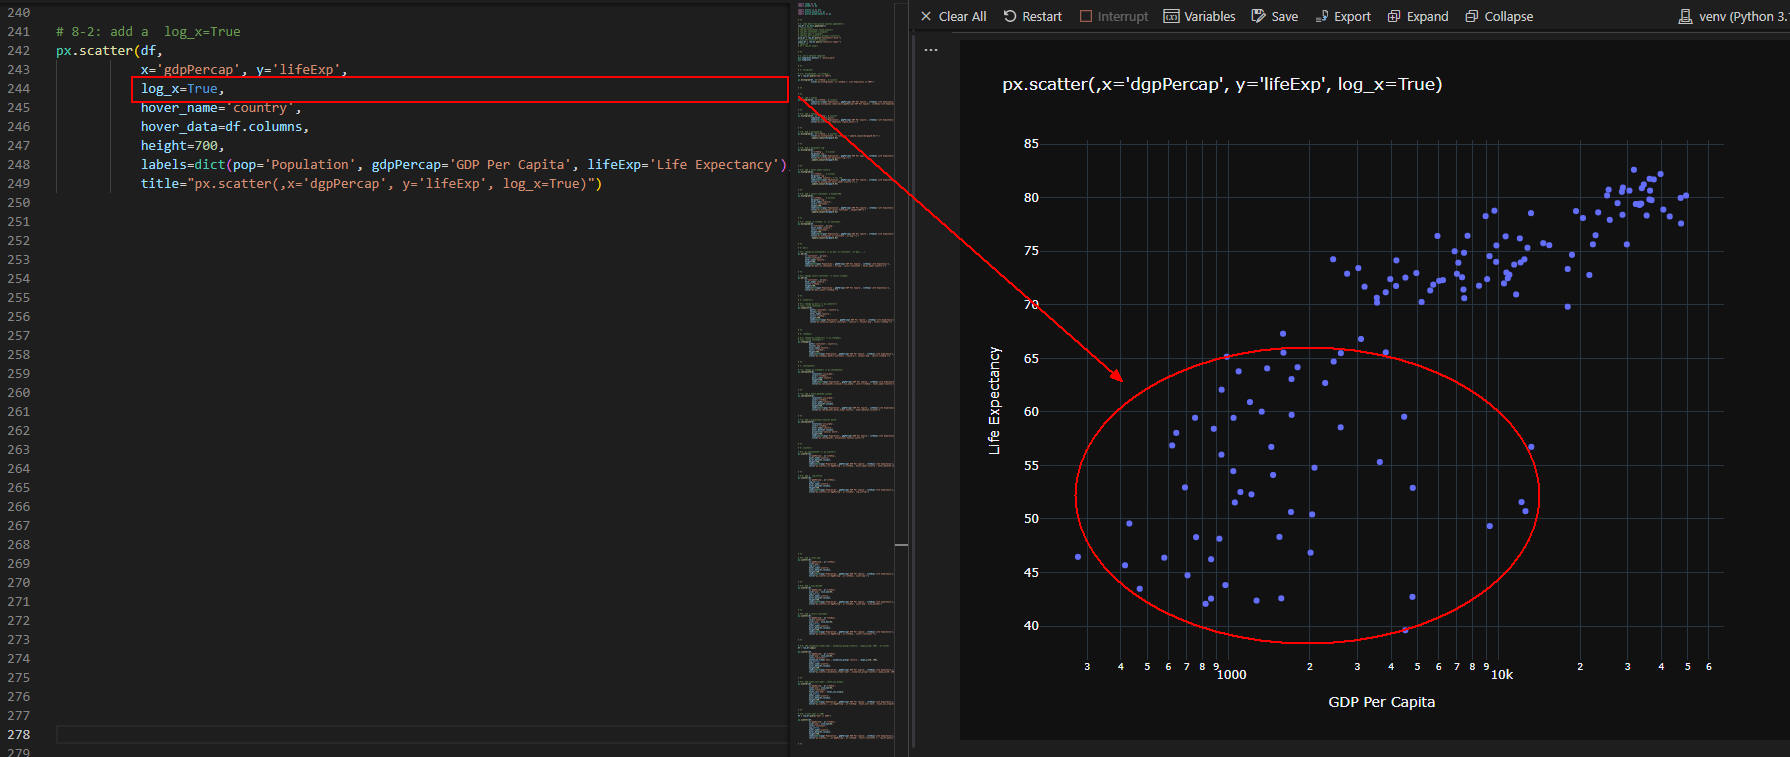 図10-2
図10-2では、scatter()メソッドに引数「log_x=True」を追加して
GDPが低い国を拡大表示させています。
図10-2
図10-2では、scatter()メソッドに引数「log_x=True」を追加して
GDPが低い国を拡大表示させています。
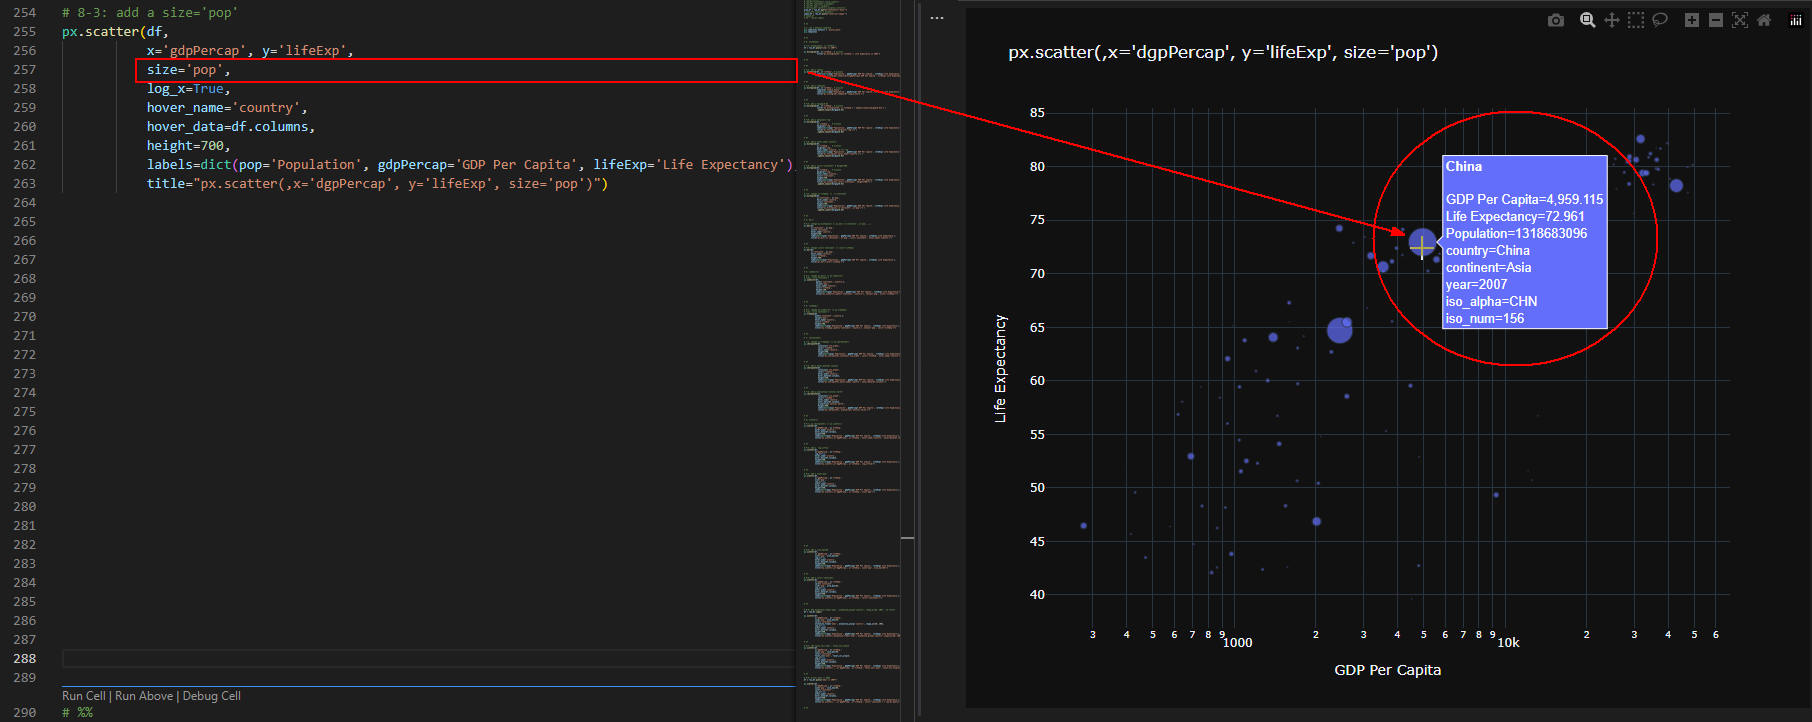 図10-3
図10-3では、scatter()メソッドに引数「size='pop'」を追加して
人口の多い国を大きく表示させています。
図10-3
図10-3では、scatter()メソッドに引数「size='pop'」を追加して
人口の多い国を大きく表示させています。
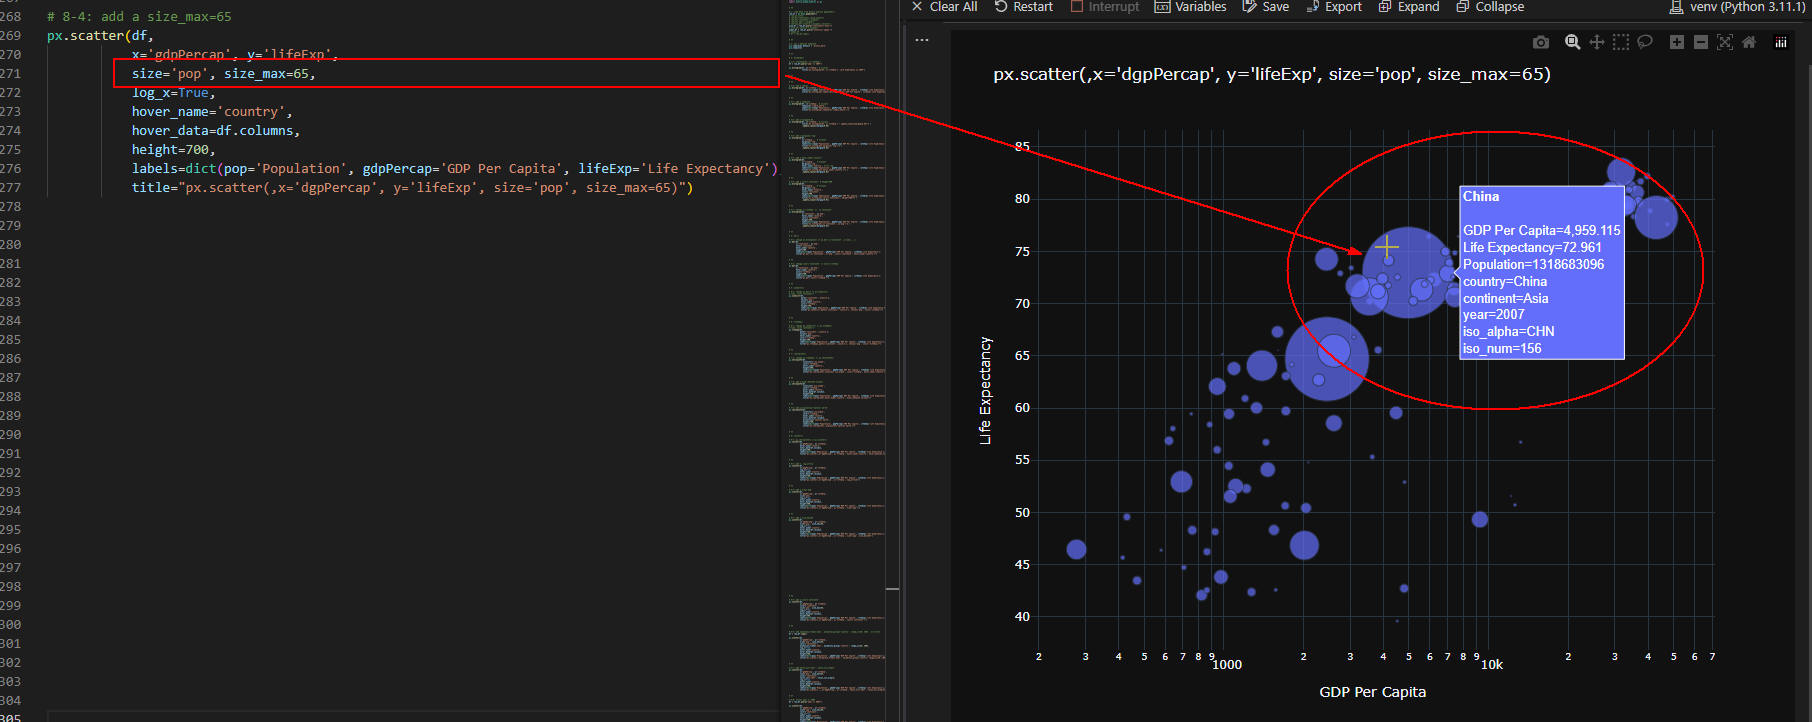 図10-4
図10-4では、scatter()メソッドに引数「size_max=65」を追加して
円がさらに大きくなるようにしています。
このパラメータの目的は、視覚的な強調を設定することです。
散布図上の点のサイズを変えることで、
ポイントの重要度や比較する値の大小を視覚的に強調することができます。
図10-4
図10-4では、scatter()メソッドに引数「size_max=65」を追加して
円がさらに大きくなるようにしています。
このパラメータの目的は、視覚的な強調を設定することです。
散布図上の点のサイズを変えることで、
ポイントの重要度や比較する値の大小を視覚的に強調することができます。
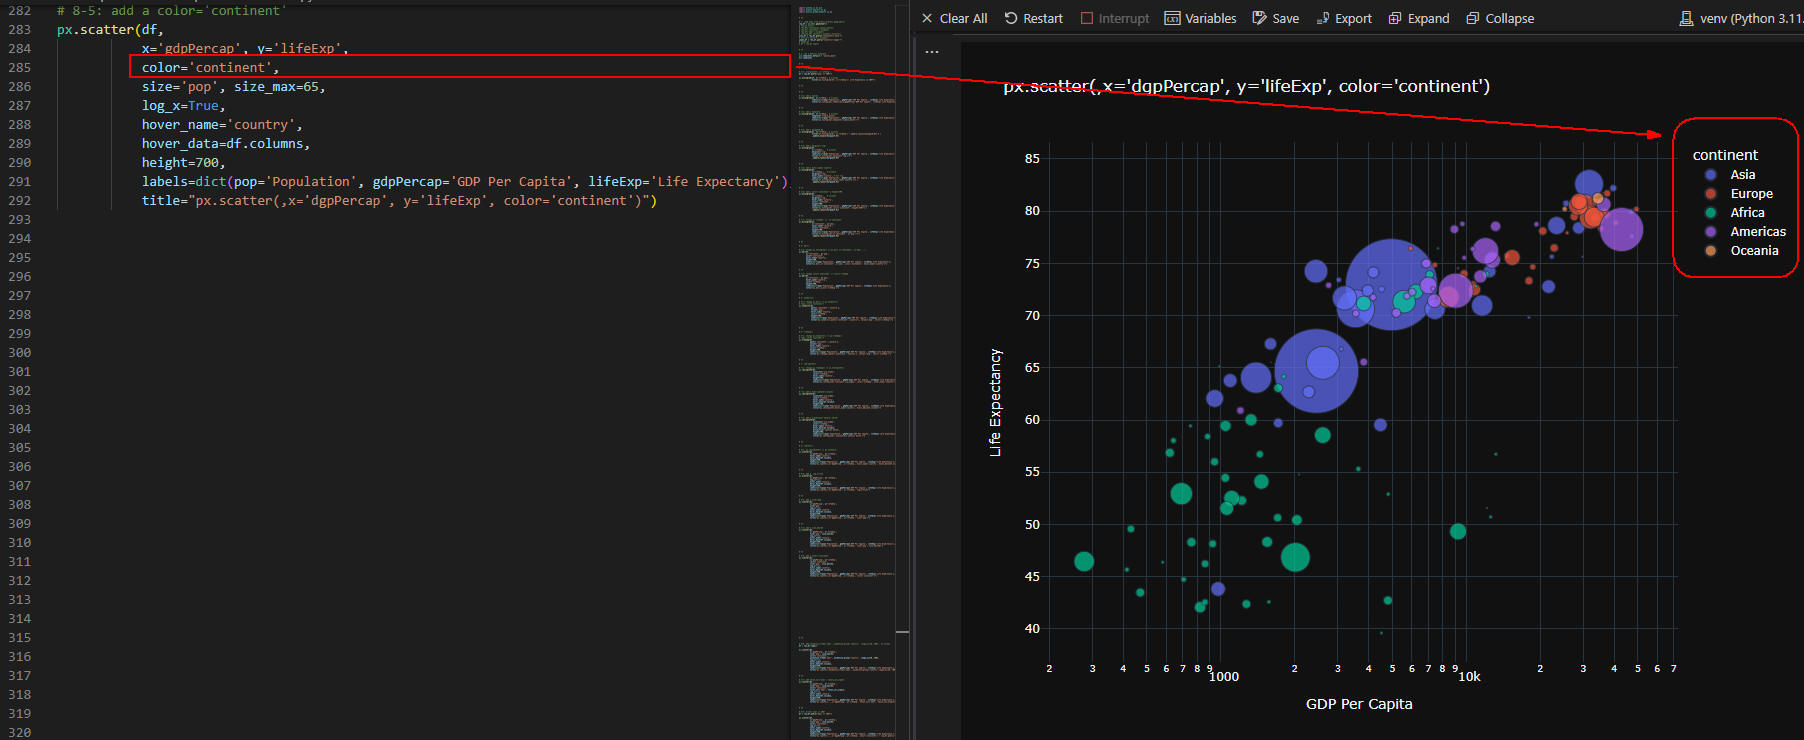 図10-5
図10-5では、scatter()メソッドの引数に「color='continent'」を追加して
散布図にカラーマップを適用させています。
図10-5
図10-5では、scatter()メソッドの引数に「color='continent'」を追加して
散布図にカラーマップを適用させています。
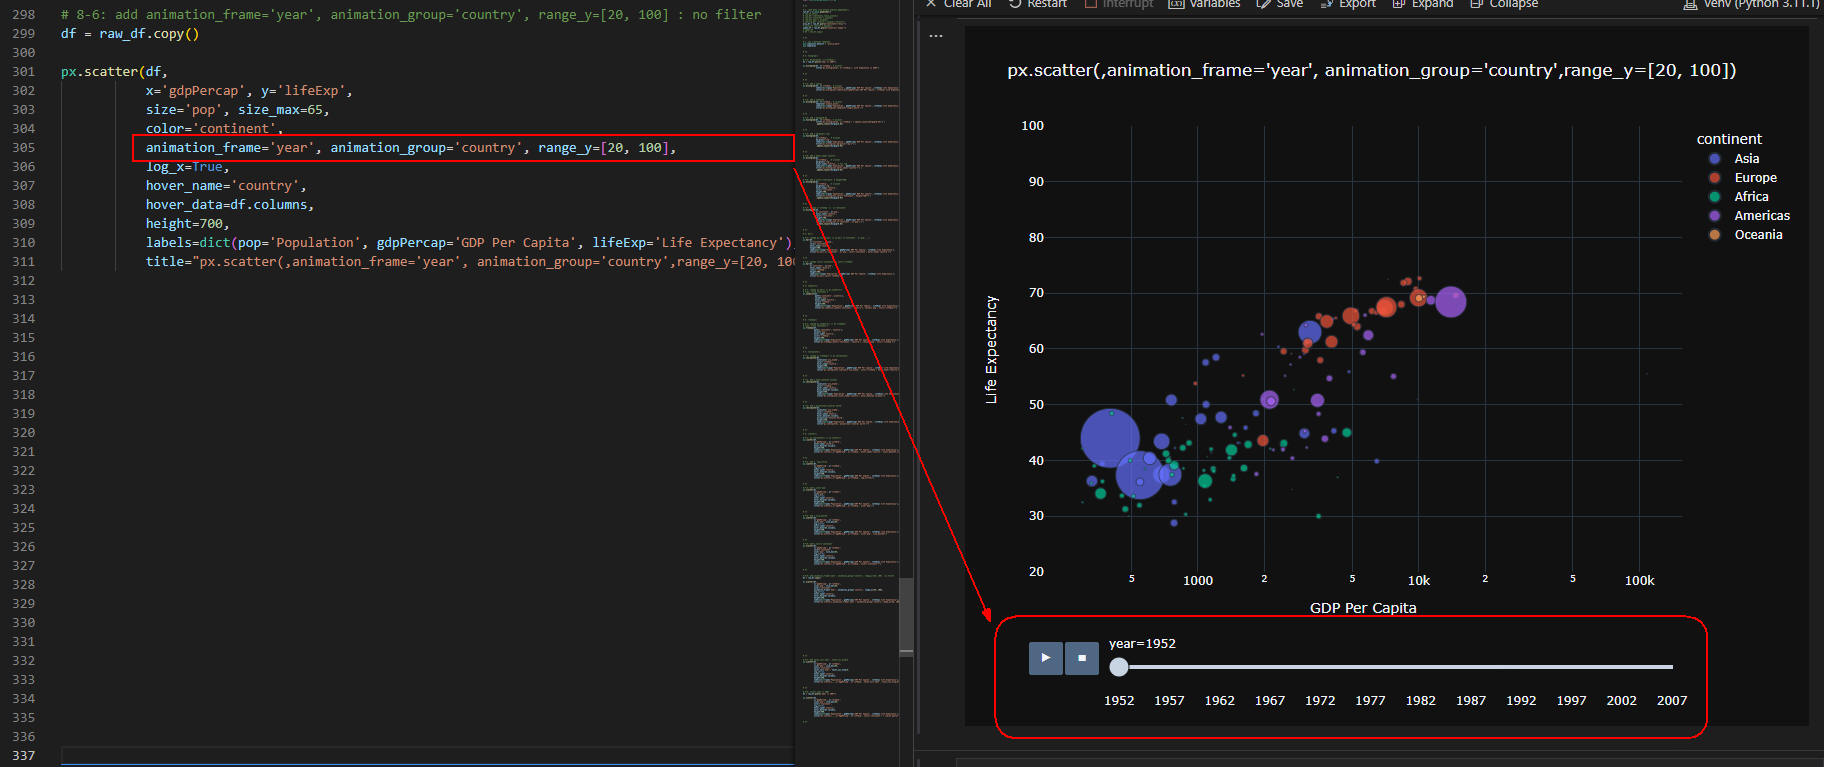 図10-6
図10-6では、scatter()メソッドの引数に「animation_frame='year', animation_group='country', range_y=[20, 100]」
を追加して散布図にアニメーション機能を追加しています。
再生ボタン[▶]をクリックすると散布図がアニメーション化して変化します。
この場合、年度が「1952から2007」に一定間隔で変わって各年度の散布図が表示されます。
図10-6
図10-6では、scatter()メソッドの引数に「animation_frame='year', animation_group='country', range_y=[20, 100]」
を追加して散布図にアニメーション機能を追加しています。
再生ボタン[▶]をクリックすると散布図がアニメーション化して変化します。
この場合、年度が「1952から2007」に一定間隔で変わって各年度の散布図が表示されます。
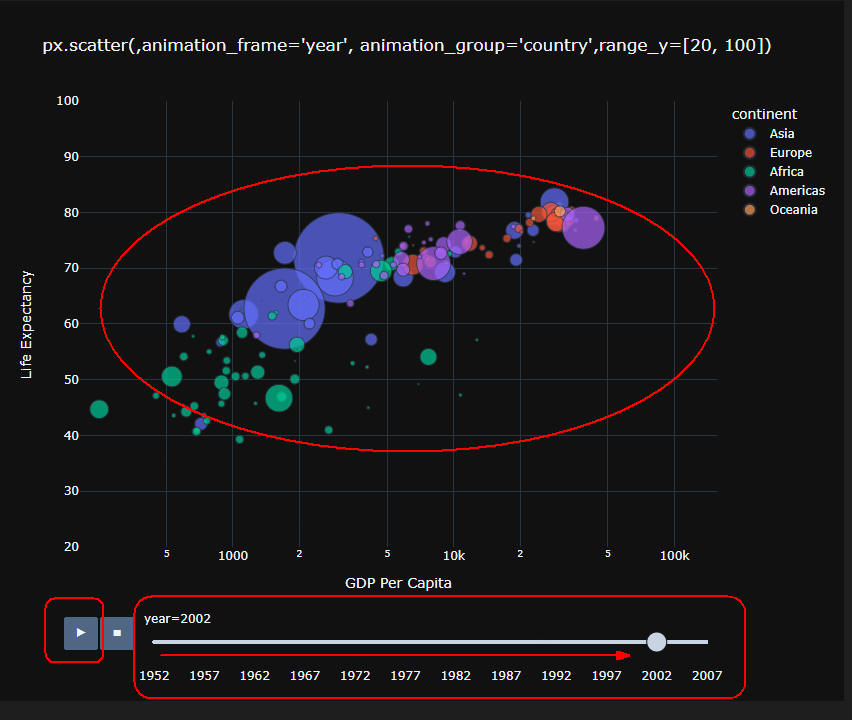 図10-7
図10-7には、再生ボタン[▶]をクリックして年度(year)が「2002」のときの散布図が表示されています。
図10-7
図10-7には、再生ボタン[▶]をクリックして年度(year)が「2002」のときの散布図が表示されています。
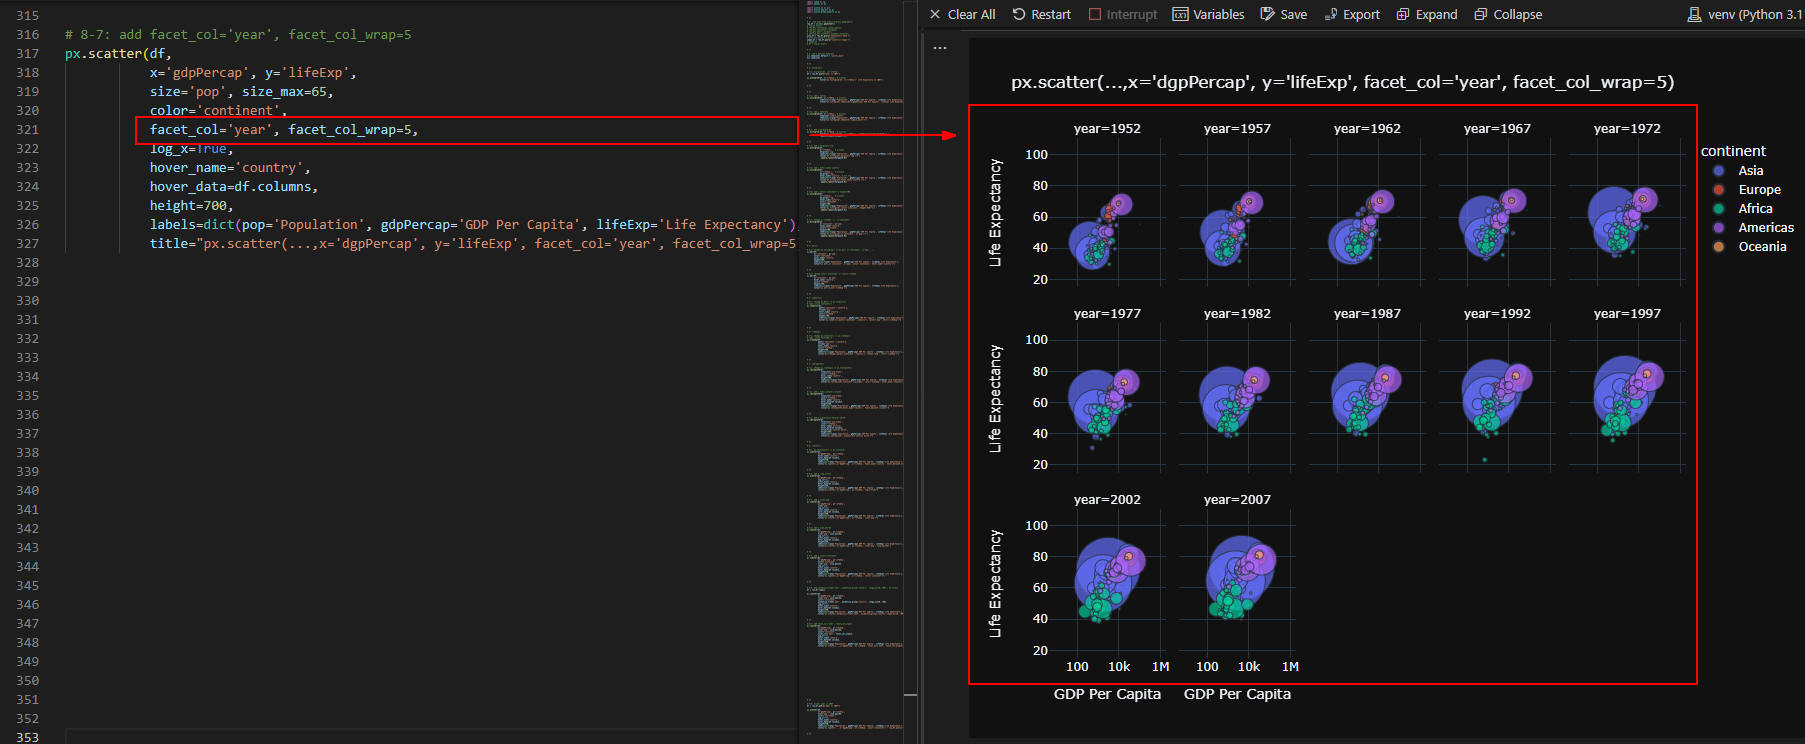 図10-8
図10-8では、scatter()メソッドの引数に「facet_col='year', facet_col_wrap=5」を追加して
各年度ごとの散布図を表示させています。
図10-8
図10-8では、scatter()メソッドの引数に「facet_col='year', facet_col_wrap=5」を追加して
各年度ごとの散布図を表示させています。
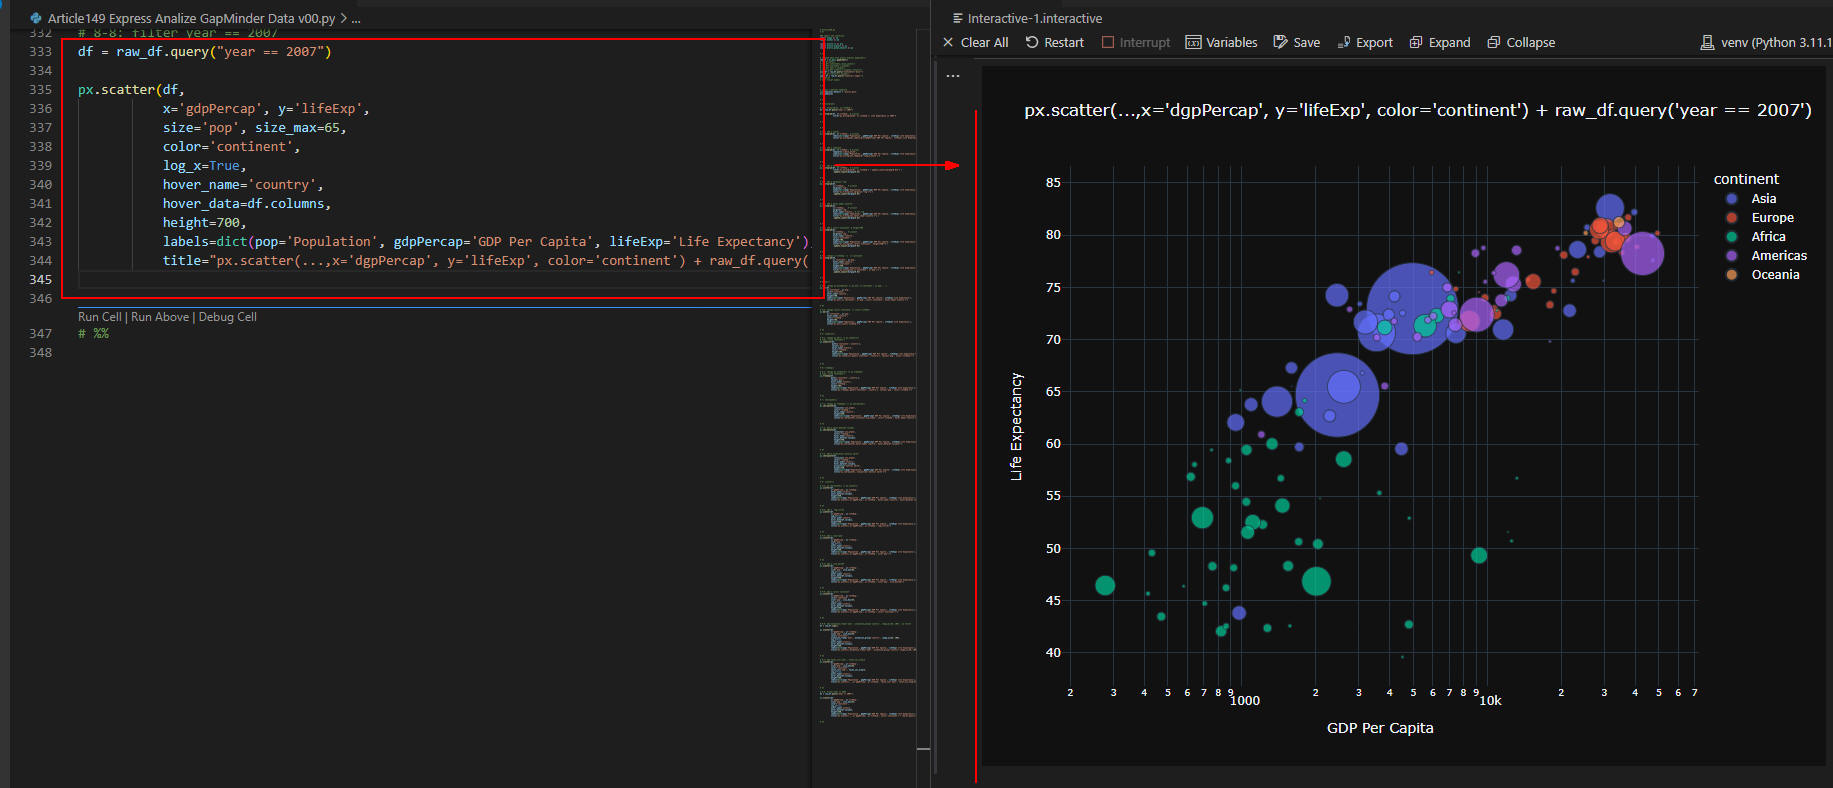 図10-9
図10-9には、2007年の散布図を表示させています。
図10-9
図10-9には、2007年の散布図を表示させています。
-
全てのコードを掲載
ここでは、本記事で解説している全てのコードを掲載しています。
リスト11-1: Article149.py
# Article149.py
# %%

### import the libraries
import numpy as np
import pandas as pd

import plotly.io as pio
import plotly.express as px
import plotly.graph_objects as go

# %%

# 1: load data from plotly express gapminder()
raw_df = px.data.gapminder()
# raw_df.info()
# raw_df['continent].value_counts()
# raw_df['continent'].unique()
# raw_df['year'].unique()
# len(raw_df['country'].unique().tolist())
asia_df = raw_df.query("continent=='Asia'")
# asia_df['country'].unique()
japan_df = raw_df.query("country=='Japan'")
# japan_df
# df = raw_df.copy()

# %%

# 2: set a defulat template
pio.templates.default = 'plotly_dark'
pio.templates

# %%

# 3: histogram()

# 3-1: histogram(df, x='lifeExp')
df = raw_df.query("year == 2007")

px.histogram(df, x='lifeExp', # y=count
             title="px.histogram(df, x='lifeExp'): Life Expectancy in 2007")

# %%

# 3-2: add a lables
px.histogram(df, x='lifeExp', # y=count
             labels=dict(pop='Population', gdpPercap='GDP Per Capita', lifeExp='Life Expectancy'),
             title="px.histogram(,labels=dict(gdpPercap='GDP Per Capita', lifeExp='Life Expectancy', continent='Continent'))")


# %%

# 3-3: add a template
px.histogram(df, x='lifeExp', # y=count
             template='simple_white',
             labels=dict(pop='Population', gdpPercap='GDP Per Capita', lifeExp='Life Expectancy'),
             title="px.histogram(,template='simple_white')")


# %%

# 3-4: add a bargap=0.02
px.histogram(df, x='lifeExp', # y=count
             title="px.histogram(df, x='lifeExp') + update_layout(bargap=0.02)") \
             .update_layout(bargap=0.02)


# %%

# 3-5: add a marginal='rug'
px.histogram(df,
             x='lifeExp',   # y=count
             marginal='rug',
             labels=dict(pop='Population', gdpPercap='GDP Per Capita', lifeExp='Life Expectancy'),
             title="px.histogram(,marginal='rug')") \
             .update_layout(bargap=0.02)


# %%

# 3-5: add a hover_name='country'
px.histogram(df,
             x='lifeExp',   # y=count
             marginal='rug',
             hover_name='country', # for rug
             labels=dict(pop='Population', gdpPercap='GDP Per Capita', lifeExp='Life Expectancy'),
             title="px.histogram(,hover_name='country')") \
             .update_layout(bargap=0.02)


# %%

# 3-6: add a color='continent' & height=700
px.histogram(df,
             x='lifeExp',   # y=count
             marginal='rug',
             hover_name='country',
             color='continent',
             height=700,
             labels=dict(pop='Population', gdpPercap='GDP Per Capita', lifeExp='Life Expectancy'),
             title="px.histogram(,color='continent', height=700)") \
             .update_layout(bargap=0.02)


# %%

# 3-7: change x='lifeExp' =>  x='continent'
px.histogram(df,
             x='continent', y='pop',
             hover_name='country',
             color='continent',
             height=700,
             labels=dict(pop='Population', gdpPercap='GDP Per Capita', lifeExp='Life Expectancy'),
             title="px.histogram(,x='continent', y='pop')") \
             .update_layout(bargap=0.02)


# %%

# 4: bar()

# 4-1: change px.histogram() => px.bar( x='continent', y='pop',...)
px.bar(df,
       x='continent', y='pop',
       color='continent',
       hover_name='country',
       height=700,
       labels=dict(pop='Population', gdpPercap='GDP Per Capita', lifeExp='Life Expectancy'),
       title="px.bar(,x='continent', y='pop', color='continent', hover_name='country')")


# %%

# 4-2: change color='continent' => color='lifeExp'
px.bar(df,
       x='continent', y='pop',
       hover_name='country',
       color='lifeExp',
       height=700,
       labels=dict(pop='Population', gdpPercap='GDP Per Capita', lifeExp='Life Expectancy'),
       title="px.bar(,color='lifeExp')")


# %%

# 5: sunburst()

# 5-1: change px.bar() => px.sunburst()
# tips: click continent ★
px.sunburst(df,
            path=['continent','country'],
            values='pop',
            hover_name='country',
            color='lifeExp',
            height=700,
            labels=dict(pop='Population', gdpPercap='GDP Per Capita', lifeExp='Life Expectancy'),
            title="px.sunburst(,path=['continent','country'], values='pop', color='lifeExp')")


# %%

# 6: treemap()

# 6-1: change px.sunburst() => px.treemap()
# tips: click continent ★
px.treemap(df,
           path=['continent','country'],
           values='pop',
           hover_name='country',
           color='lifeExp',
           height=700,
           labels=dict(pop='Population', gdpPercap='GDP Per Capita', lifeExp='Life Expectancy'),
           title="px.treemap(,path=['continent','country'], values='pop', color='lifeExp')")


# %%

# 7: choropleth()

# 7-1: change px.treemap() => px.choropleth()
px.choropleth(df,
              locations='iso_alpha',
              color='lifeExp',
              hover_name='country',
              height=700,
              labels=dict(pop='Population', gdpPercap='GDP Per Capita', lifeExp='Life Expectancy'),
              title="px.choropleth(,lcations='iso_alpha', color='lifeExp', hover_name='country')")


# %%

# 7-2: add a hover_data=df.columns
px.choropleth(df,
              locations='iso_alpha',
              color='lifeExp',
              hover_name='country',
              hover_data=df.columns,
              height=700,
              labels=dict(pop='Population', gdpPercap='GDP Per Capita', lifeExp='Life Expectancy'),
              title="px.choropleth(,hover_name='country', hover_data=df.columns)")


# %%

# 7-3: add a projection='natural earth'
px.choropleth(df,
              locations='iso_alpha',
              color='lifeExp',
              hover_name='country',
              hover_data=df.columns,
              projection='natural earth',
              height=700,
              labels=dict(pop='Population', gdpPercap='GDP Per Capita', lifeExp='Life Expectancy'),
              title="px.choropleth(, projection='natural earth')")


# %%

# 8: scatter()

# 8-1: px.choropleth() => px.scatter()
px.scatter(df,
           x='gdpPercap', y='lifeExp',
           hover_name='country',
           hover_data=df.columns,
           height=700,
           labels=dict(pop='Population', gdpPercap='GDP Per Capita', lifeExp='Life Expectancy'),
           title="px.scatter(,x='dgpPercap', y='lifeExp', hover_name='country', hover_data=df.columns)")


# %%

# 8-2: add a  log_x=True
px.scatter(df,
           x='gdpPercap', y='lifeExp',
           log_x=True,
           hover_name='country',
           hover_data=df.columns,
           height=700,
           labels=dict(pop='Population', gdpPercap='GDP Per Capita', lifeExp='Life Expectancy'),
           title="px.scatter(,x='dgpPercap', y='lifeExp', log_x=True)")


# %%

# 8-3: add a size='pop'
px.scatter(df,
           x='gdpPercap', y='lifeExp',
           size='pop',
           log_x=True,
           hover_name='country',
           hover_data=df.columns,
           height=700,
           labels=dict(pop='Population', gdpPercap='GDP Per Capita', lifeExp='Life Expectancy'),
           title="px.scatter(,x='dgpPercap', y='lifeExp', size='pop')")


# %%

# 8-4: add a size_max=65
px.scatter(df,
           x='gdpPercap', y='lifeExp',
           size='pop', size_max=65,
           log_x=True,
           hover_name='country',
           hover_data=df.columns,
           height=700,
           labels=dict(pop='Population', gdpPercap='GDP Per Capita', lifeExp='Life Expectancy'),
           title="px.scatter(,x='dgpPercap', y='lifeExp', size='pop', size_max=65)")


# %%

# 8-5: add a color='continent'
px.scatter(df,
           x='gdpPercap', y='lifeExp',
           color='continent',
           size='pop', size_max=65,
           log_x=True,
           hover_name='country',
           hover_data=df.columns,
           height=700,
           labels=dict(pop='Population', gdpPercap='GDP Per Capita', lifeExp='Life Expectancy'),
           title="px.scatter(,x='dgpPercap', y='lifeExp', color='continent')")


# %%


# 8-6: add animation_frame='year', animation_group='country', range_y=[20, 100] : no filter
df = raw_df.copy()

px.scatter(df,
           x='gdpPercap', y='lifeExp',
           size='pop', size_max=65,
           color='continent',
           animation_frame='year', animation_group='country', range_y=[20, 100],
           log_x=True,
           hover_name='country',
           hover_data=df.columns,
           height=700,
           labels=dict(pop='Population', gdpPercap='GDP Per Capita', lifeExp='Life Expectancy'),
           title="px.scatter(,animation_frame='year', animation_group='country',range_y=[20, 100]) ")


# %%

# 8-7: add facet_col='year', facet_col_wrap=5
px.scatter(df,
           x='gdpPercap', y='lifeExp',
           size='pop', size_max=65,
           color='continent',
           facet_col='year', facet_col_wrap=5,
           log_x=True,
           hover_name='country',
           hover_data=df.columns,
           height=700,
           labels=dict(pop='Population', gdpPercap='GDP Per Capita', lifeExp='Life Expectancy'),
           title="px.scatter(...,x='dgpPercap', y='lifeExp', facet_col='year', facet_col_wrap=5) ")


# %%

# 8-8: filter year == 2007
df = raw_df.query("year == 2007")

px.scatter(df,
           x='gdpPercap', y='lifeExp',
           size='pop', size_max=65,
           color='continent',
           log_x=True,
           hover_name='country',
           hover_data=df.columns,
           height=700,
           labels=dict(pop='Population', gdpPercap='GDP Per Capita', lifeExp='Life Expectancy'),
           title="px.scatter(...,x='dgpPercap', y='lifeExp', color='continent') + raw_df.query('year == 2007') ")

# %%