-
まずは、Pythonの開発環境を準備する
まずは、
「記事(Article137)」を参照して、
Pythonの開発環境を準備してください。
ここでは、Pythonのプロジェクトフォルダとして「Plotly」を使用しています。
 図1
図1は、Visual Studio Code(VS Code)の「Terminal」メニューから「New Terminal」を選択して、
「Terminal」ウィンドウを開いたときの画面です。
緑色の「(venv)」が表示されていれば、 Pythonの仮想環境が正常に作成されていることになります。
図1
図1は、Visual Studio Code(VS Code)の「Terminal」メニューから「New Terminal」を選択して、
「Terminal」ウィンドウを開いたときの画面です。
緑色の「(venv)」が表示されていれば、 Pythonの仮想環境が正常に作成されていることになります。
-
Visual Studio Codeを起動してプログラムファイルを作成する
Pythonの開発環境の準備が完了したら、 VS Codeを起動して新規のPythonファイル(*.py)を作成します。
ここで作成したPythonのファイルには「リスト8-1」のコードをコピペします。
 図2
図2は、VS Codeの画面です。
図2
図2は、VS Codeの画面です。
-
日本の人口データとマップを作成するためのデータを用意する
ここでは、3種類のファイルを使用して日本の人口データを各種グラフに表示するためのデータを準備します。
「prefectures.json」ファイルには、日本の都道府県の地理データがJSON形式で格納されています。
「japan_census_all.csv」ファイルには、都道府県別・男女別の人口データがcsv形式で格納されています。
「japan_geo.csv」ファイルには、都道府県名、地方名が日本語と英語で格納されています。
さらに、検証所在地の緯度・経度も格納されています。
これらのファイルを使用して、
Plotly Expressで各種グラフを作成します。
なお、データを準備するための手順は図の説明にて解説します。
### 0: Prepare geojason / census data for analysis by cleaning and transforming the data

### 0-1: Read a GeoJson file

url = r'https://money-or-ikigai.com/Menu/Python/Article/data/map/prefectures.json'
response = urllib.request.urlopen(url)
geo_data = response.read().decode('utf-8')
japan_prefectures = json.loads(geo_data)
# json_file = 'data/json/prefectures.json'
# japan_prefectures = json.load(open(json_file, 'r'))
japan_prefectures


# %%

### 0-2: Load a prefecture id map dictionary from the geojson data
# Create an empty dictionary to store prefecture IDs
prefecture_id_map = {}

# Loop through the "features" list in the "japan_prefectures" dictionary
for feature in japan_prefectures['features']:
    feature['id'] = feature['properties']['pref']
    prefecture_id_map[feature['properties']['name']] = feature['id']

prefecture_id_map


# %%

### 0-3: Load Japan census data from a csv file

csv_file = r'https://money-or-ikigai.com/Menu/Python/Article/data/map/japan_census_all.csv'
# csv_file = 'data/csv/japan_census_all.csv'
df = pd.read_csv(csv_file)
# df.info()
# df
dfx = df.query("year == 2021")
dfx.shape   # (47, 5)


# %%

### 0-4: Load Japan geo data from a csv file

geo_csv = r'https://money-or-ikigai.com/Menu/Python/Article/data/map/japan_geo.csv'
# geo_csv = 'data/csv/japan_geo.csv'
geo_df = pd.read_csv(geo_csv)
geo_df


# %%

### 0-5: Filter columns from the pandas dataframe.

geo_df = geo_df[['region_en','region_jp','prefecture_en','prefecture_jp']]
geo_df


# %%

### 0-6: Concatenate the Japan census and geojason data horizontally based on the 'prefecture_jp' column

# Set the "prefecture_jp" column as the index for the "dfx" DataFrame
dfx.set_index('prefecture_jp', inplace=True)

# Set the "prefecture_jp" column as the index for the "geo_df" DataFrame
geo_df.set_index('prefecture_jp', inplace=True)

# Concatenate the "dfx" and "geo_df" DataFrames
# along the columns axis (axis=1) and store the result in "dfy"
dfy = pd.concat([dfx, geo_df], axis=1)
dfy


# %%

### 0-7: Add a new column 'id' into the dataframe.

# Create a new column named "id" in the "dfy" DataFrame
# by applying a lambda function to the "prefecture_en" column.
# The lambda function maps each prefecture name in the "prefecture_en" column
# to its corresponding ID in the "prefecture_id_map" dictionary.
# The resulting IDs are assigned to the "id" column
dfy['id'] = dfy['prefecture_en'].apply(lambda x: prefecture_id_map[x])
dfy


# %%

### 0-8: Calculate male/female ratios.

dfy.reset_index(inplace=True)

raw_df = dfy.copy()

raw_df['male_ratio'] = raw_df.apply(lambda row: round(row['male'] / row['population'],2), axis=1)
raw_df['female_ratio'] = raw_df.apply(lambda row: round(row['female'] / row['population'],2), axis=1)
raw_df['male_ratio_scale'] = np.log10(raw_df['male_ratio'])
raw_df
 図3-1
図3-1では、「prefectures.json」ファイルを読み込んでデータの内容を表示しています。
このファイル(geojson)には、日本の都道府県の地理データが格納されています。
このデータはJSON形式で「都道府県のID(pref)」、「都道府県名(name)」、都道府県の境界線(coordinates)
などの情報が格納されています。
このデータは、Plotly Expressのchoropleth()で日本のマップを作成するときに使用します。
詳細は後述します。
図3-1
図3-1では、「prefectures.json」ファイルを読み込んでデータの内容を表示しています。
このファイル(geojson)には、日本の都道府県の地理データが格納されています。
このデータはJSON形式で「都道府県のID(pref)」、「都道府県名(name)」、都道府県の境界線(coordinates)
などの情報が格納されています。
このデータは、Plotly Expressのchoropleth()で日本のマップを作成するときに使用します。
詳細は後述します。
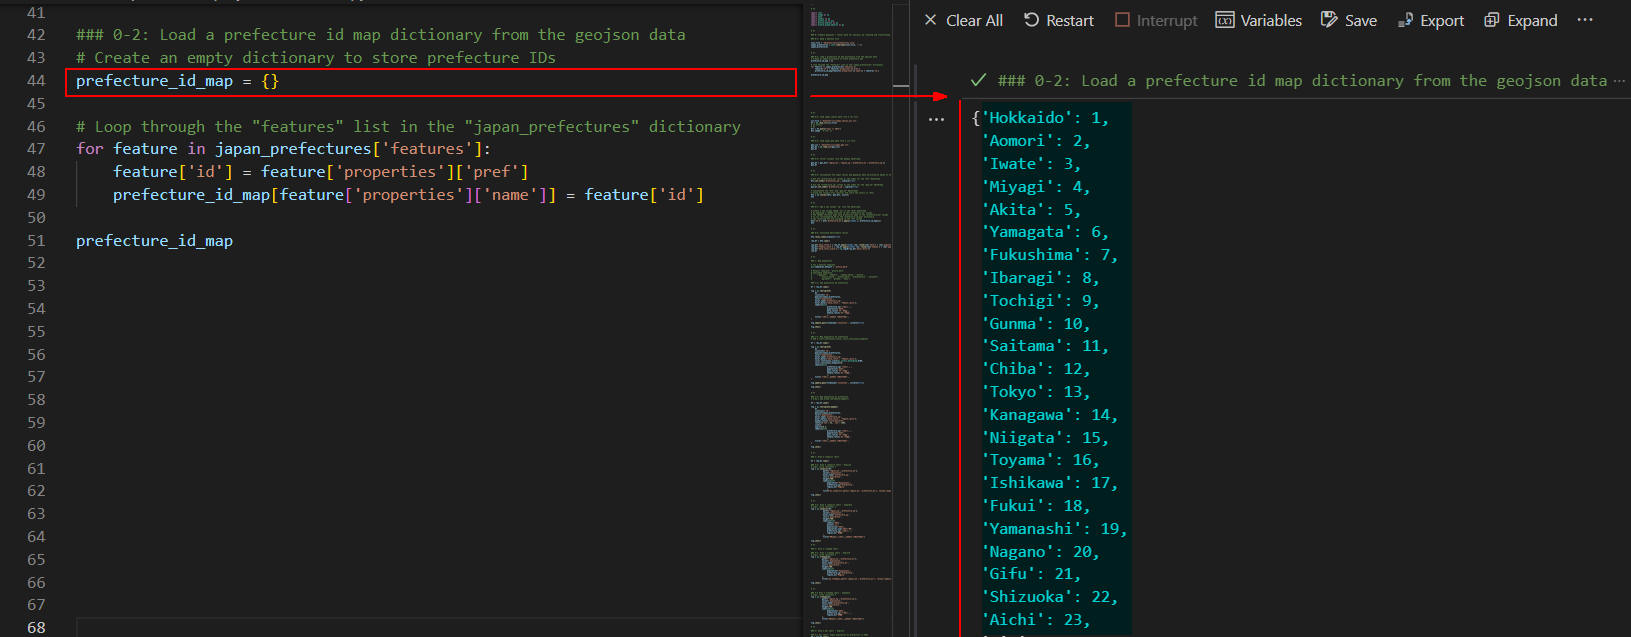 図3-2
図3-2では、geojsonデータから都道府県の「id」と都道府県名「name」を取り出して
変数「prefecture_id_map」にdict型で格納しています。
図3-2に表示されているように変数には「'Hokkaido': 1, 'Aomori': 2,...」のように
都道府県名とIDが格納されています。
図3-2
図3-2では、geojsonデータから都道府県の「id」と都道府県名「name」を取り出して
変数「prefecture_id_map」にdict型で格納しています。
図3-2に表示されているように変数には「'Hokkaido': 1, 'Aomori': 2,...」のように
都道府県名とIDが格納されています。
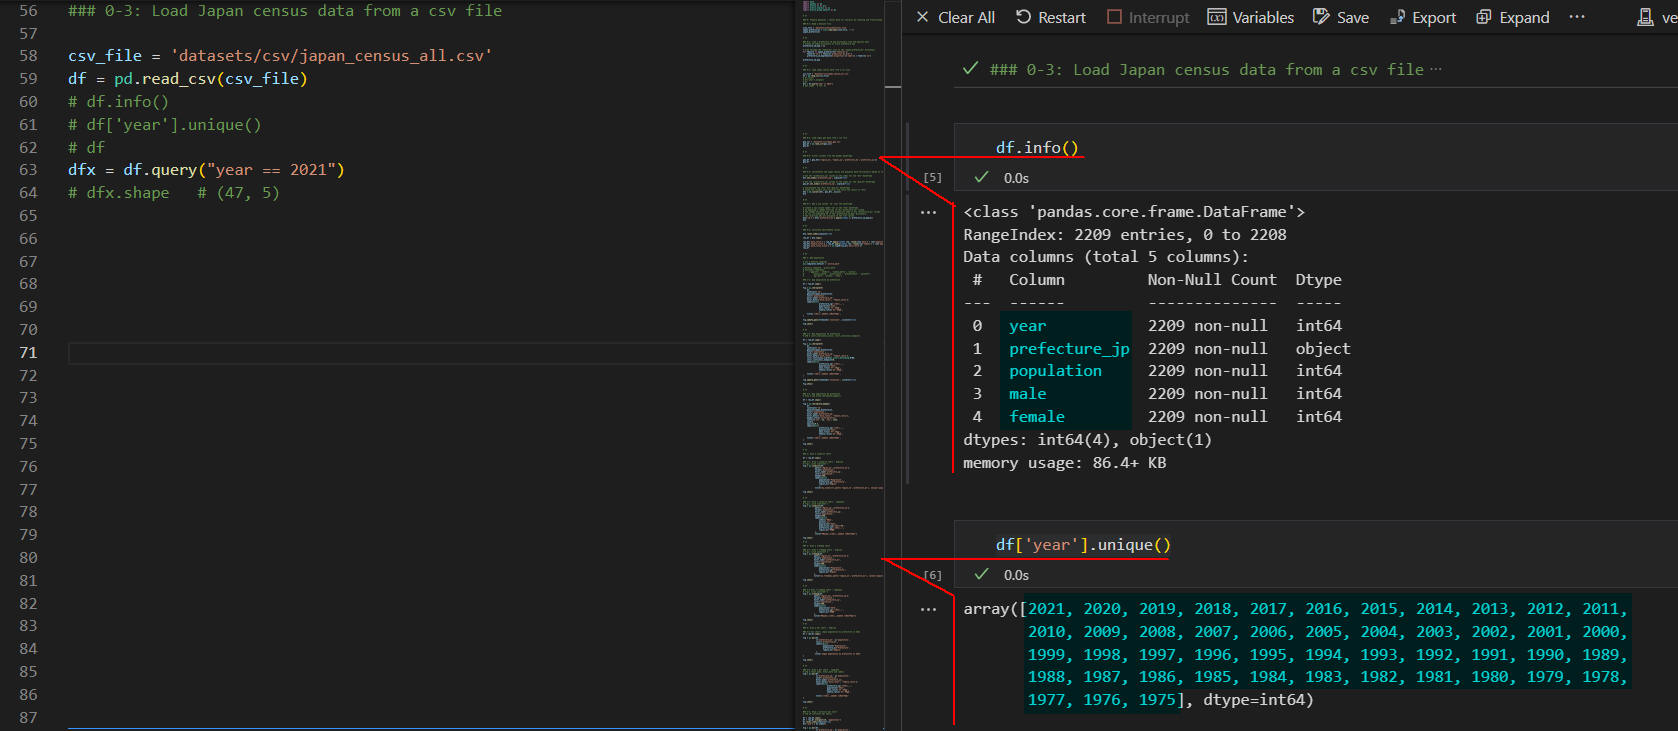 図3-3
図3-3では、日本の都道府県別の人口データが格納されているPandasのDataFrameの構造を表示しています。
DataFrameは「year(年度), prefecture_jp(都道府県名), population(人口), male(男性の人口),
female(女性の人口)」のカラムから構成されています。
図3-3
図3-3では、日本の都道府県別の人口データが格納されているPandasのDataFrameの構造を表示しています。
DataFrameは「year(年度), prefecture_jp(都道府県名), population(人口), male(男性の人口),
female(女性の人口)」のカラムから構成されています。
カラム「year」には「1975」から「2021」の年度が格納されています。
つまり、DataFrameには1975年度から2021年度までの人口データが格納されています。
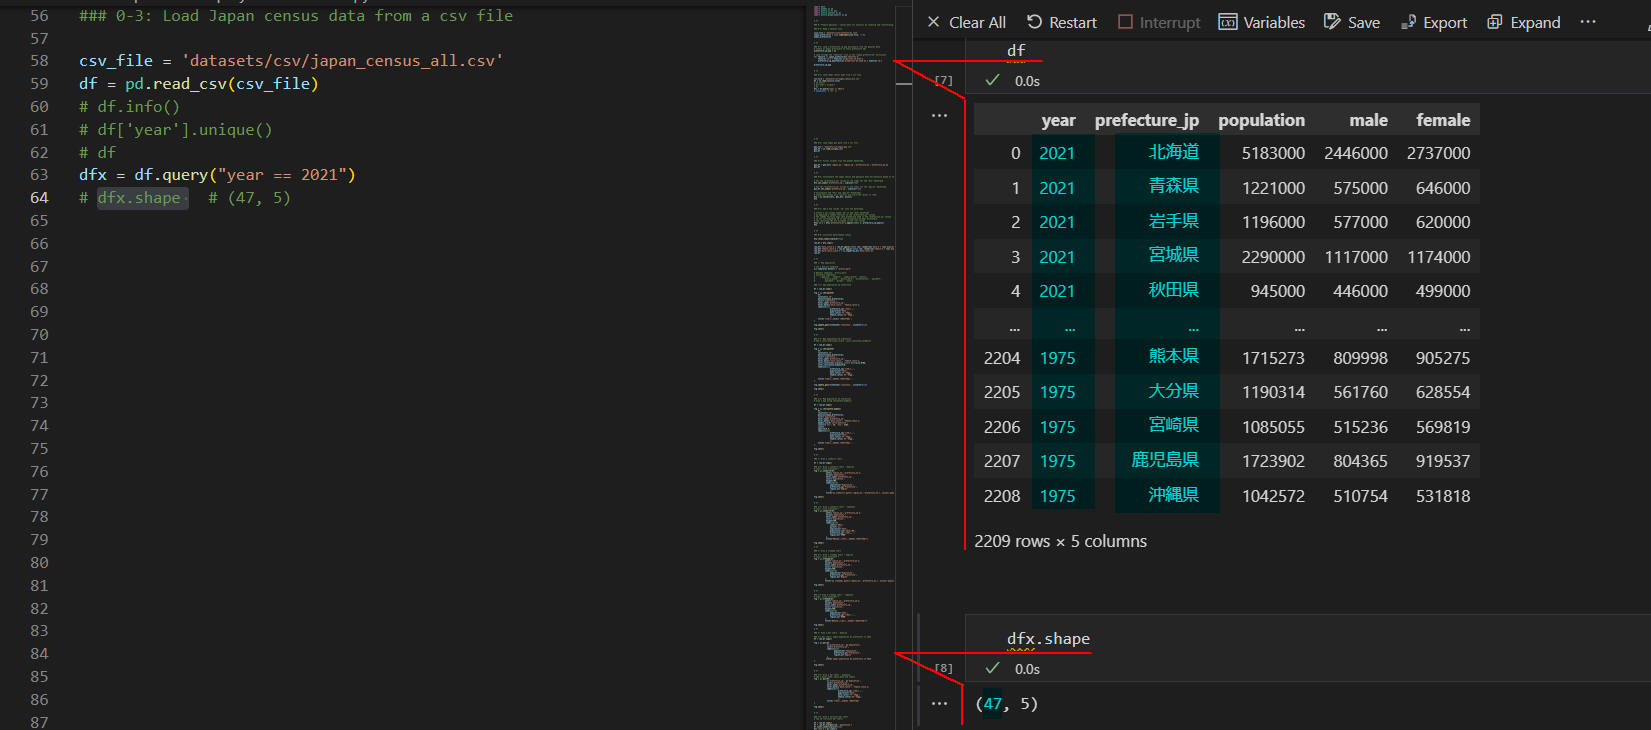 図3-4
図3-4では、前出(図3-3)のDataFrameの内容を表示しています。
DataFrameには「年度、都道府県名、都道府県の人口、男性の人口、女性の人口」
が格納されています。
図3-4
図3-4では、前出(図3-3)のDataFrameの内容を表示しています。
DataFrameには「年度、都道府県名、都道府県の人口、男性の人口、女性の人口」
が格納されています。
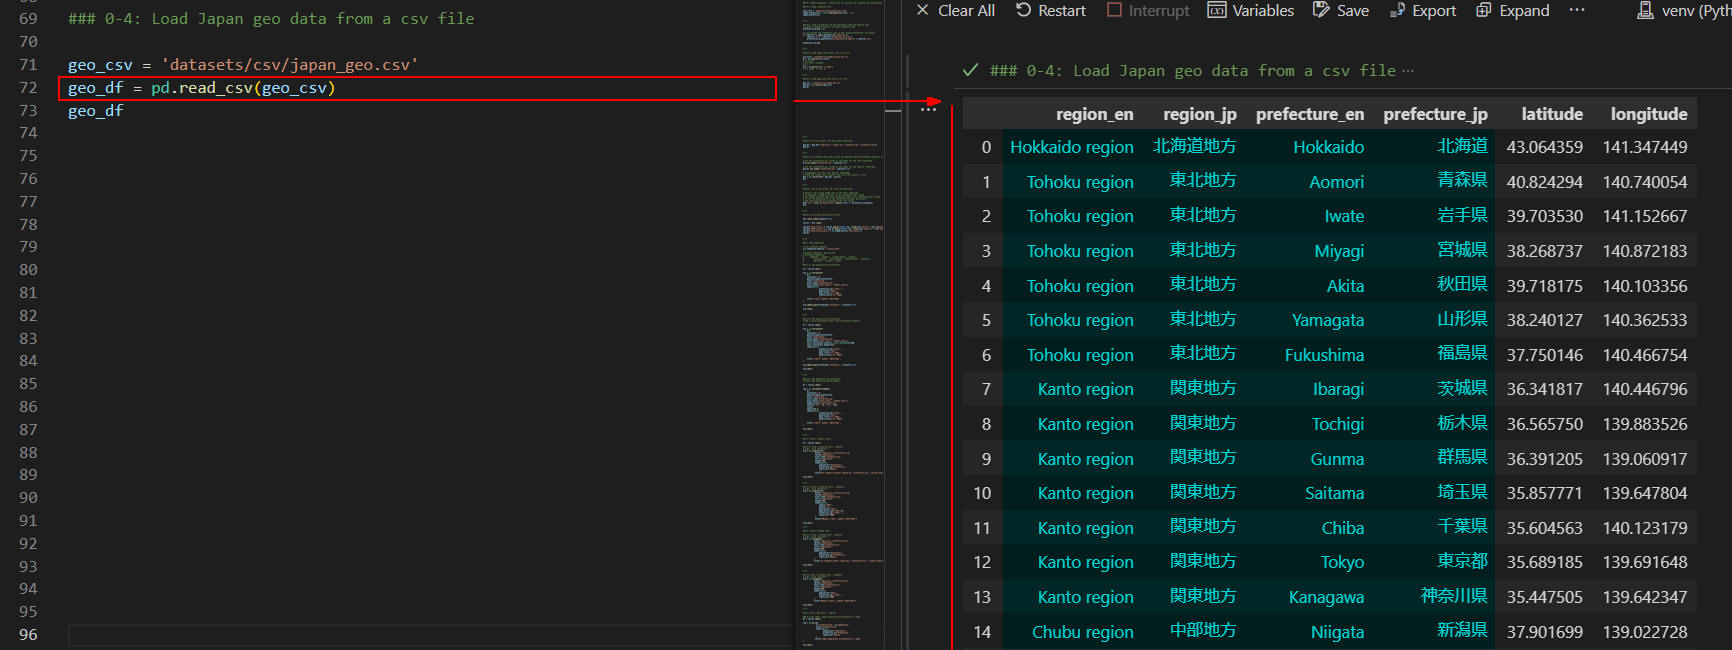 図3-5
図3-5には「japan_geo.csv」ファイルのデータが格納されている、
PandasのDataFrameの内容を表示しています。
このDataFrameには「英語の地方名(region_en), 日本語の地方名(region_jp),
英語の都道府県名(prefecture_en), 日本語の都道府県名(prefecture_jp)」などが格納されています。
図3-5
図3-5には「japan_geo.csv」ファイルのデータが格納されている、
PandasのDataFrameの内容を表示しています。
このDataFrameには「英語の地方名(region_en), 日本語の地方名(region_jp),
英語の都道府県名(prefecture_en), 日本語の都道府県名(prefecture_jp)」などが格納されています。
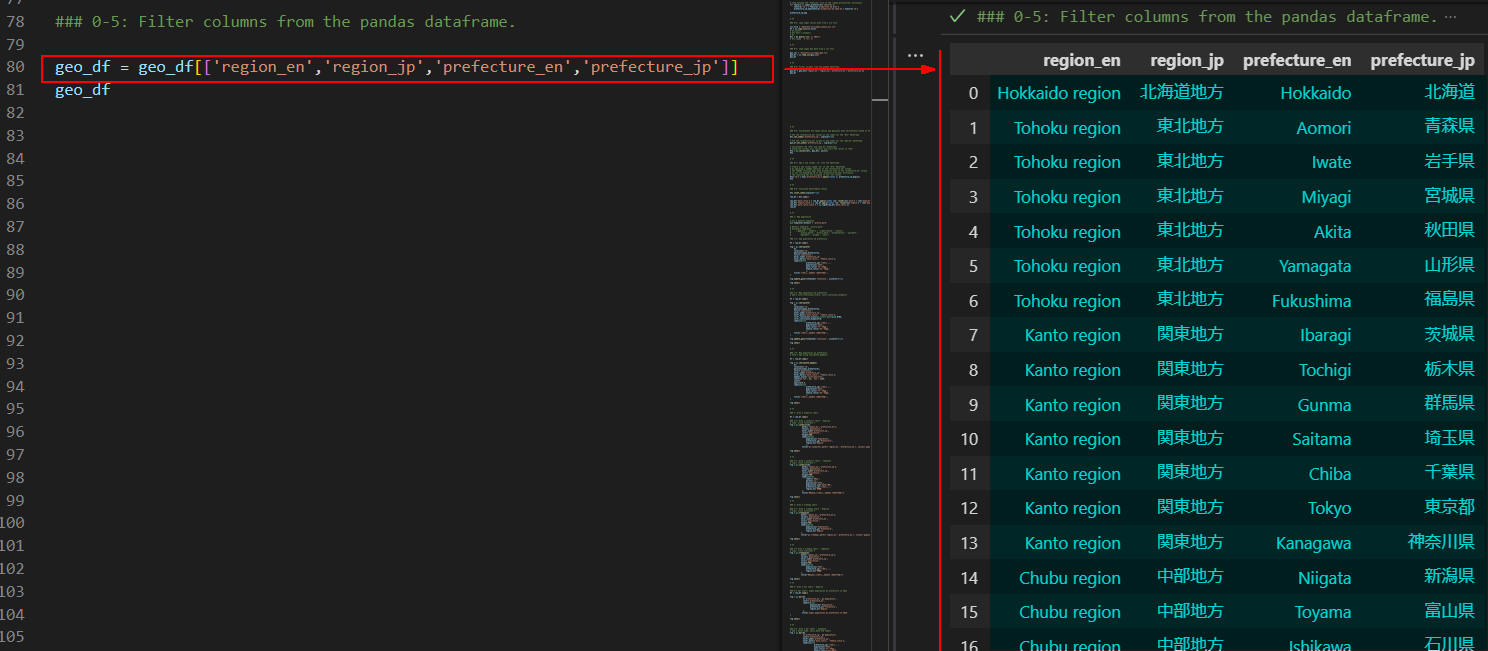 図3-6
図3-6には、前出(図3-5)のDataFrameから「region_en, region_jp, prefecture_en, prefecture_jp」
のカラムだけ抽出したDataFrame「geo_df」の内容を表示しています。
図3-6
図3-6には、前出(図3-5)のDataFrameから「region_en, region_jp, prefecture_en, prefecture_jp」
のカラムだけ抽出したDataFrame「geo_df」の内容を表示しています。
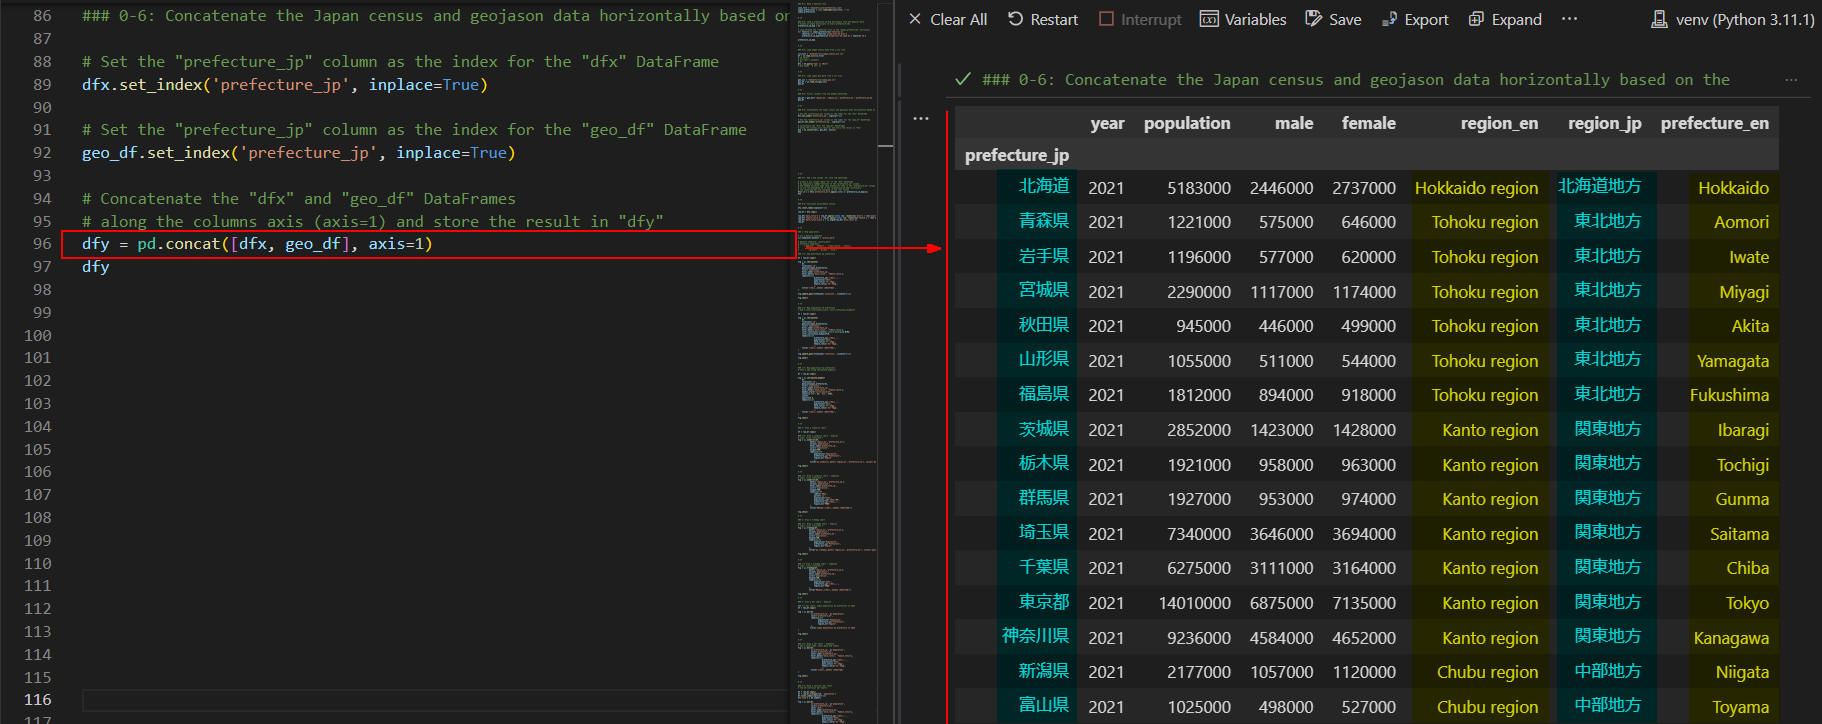 図3-7
図3-7には、DataFrame(dfx)とDataFrame(geo_df)を連結したあとのDataFrame(dfy)の内容を表示しています。
このDataFrame(dfy)には、「year, population, male, female, region_en, region_jp,
prefecture_en, prefecture_jp」が格納されています。
カラム「prefecture_jp」はインデックスに設定されています。
図3-7
図3-7には、DataFrame(dfx)とDataFrame(geo_df)を連結したあとのDataFrame(dfy)の内容を表示しています。
このDataFrame(dfy)には、「year, population, male, female, region_en, region_jp,
prefecture_en, prefecture_jp」が格納されています。
カラム「prefecture_jp」はインデックスに設定されています。
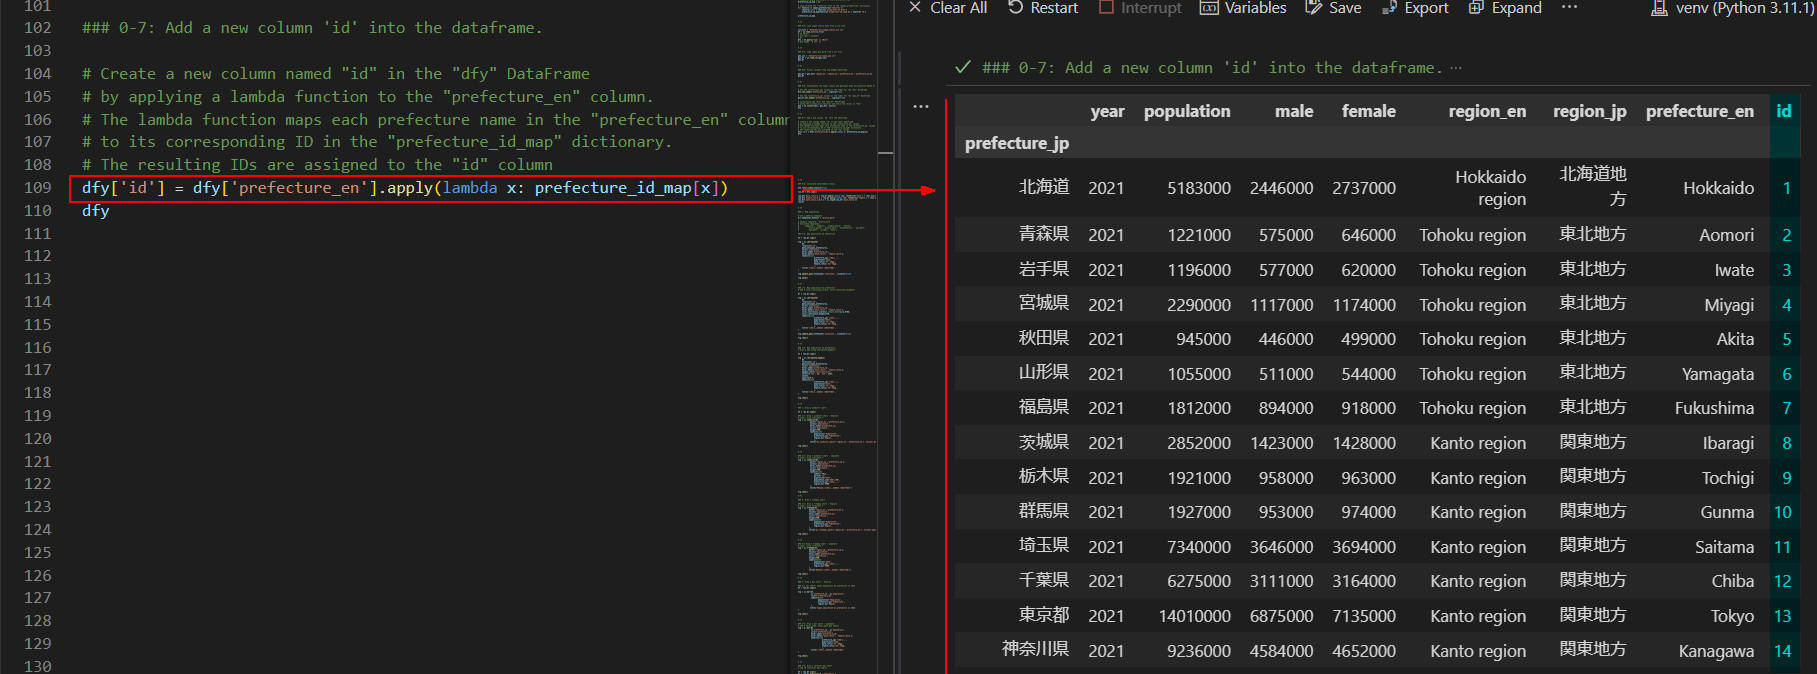 図3-8
図3-8では、前出(図3-7)のDataFrame(dfy)にカラム「id」を追加したDataFrameの内容を表示しています。
カラム「id」には、geojsonの都道府県の「id」が格納されています。
これで人口データと地理データがリンクされるようになります。
図3-8
図3-8では、前出(図3-7)のDataFrame(dfy)にカラム「id」を追加したDataFrameの内容を表示しています。
カラム「id」には、geojsonの都道府県の「id」が格納されています。
これで人口データと地理データがリンクされるようになります。
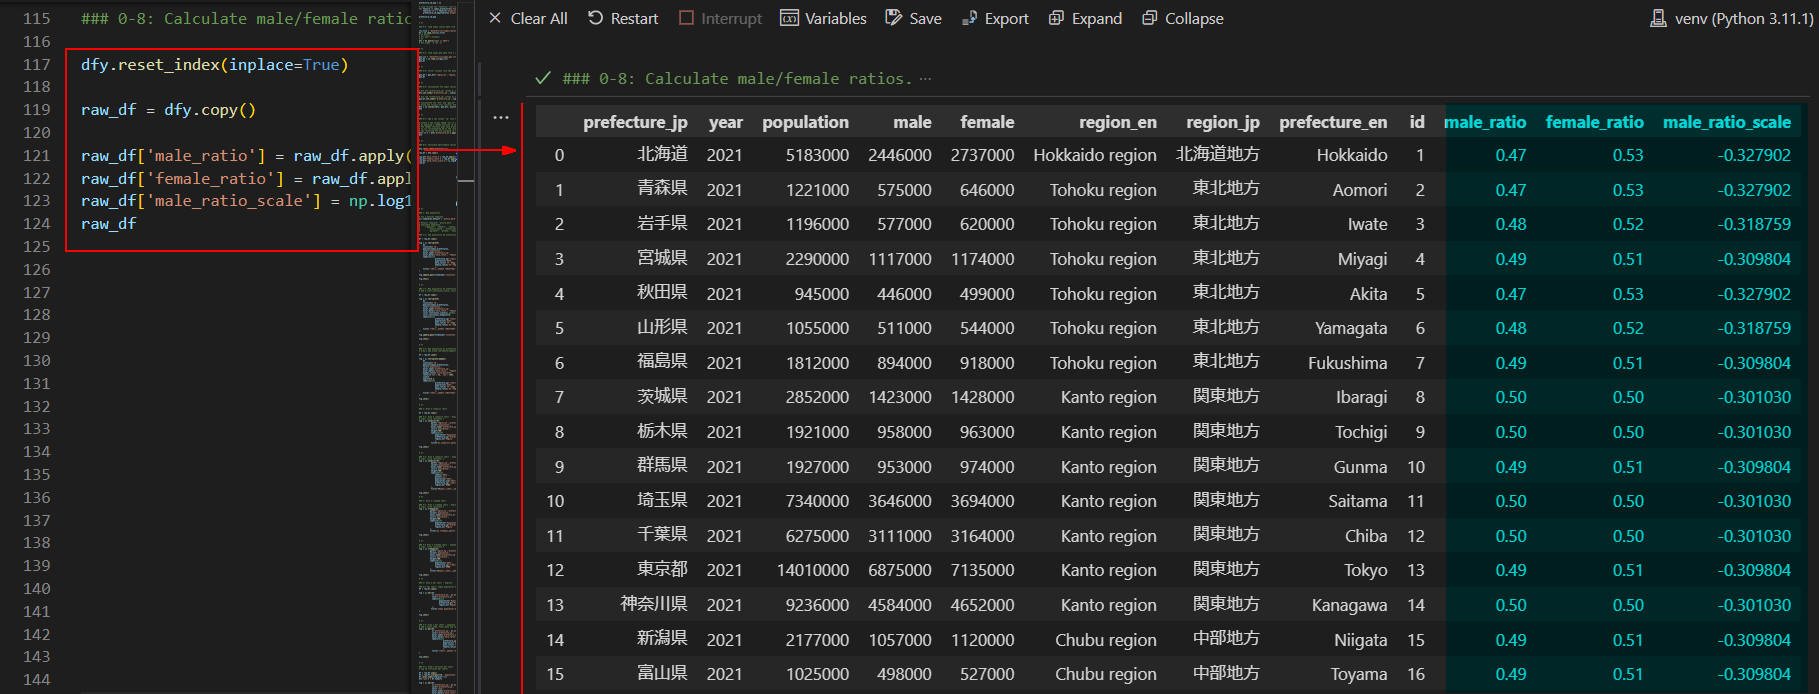 図3-9
図3-9では、前出(図3-8)のDataFrame(dfy)に新規のカラム「male_ratio, female_ratio, male_ratio_scale」
のカラムを追加して作成した最終版のDataFrame(raw_df)の内容を表示しています。
このDataFrame(raw_df)には、後述するステップで使用する全てのデータが含まれています。
これでデータの準備作業が完了しました。
図3-9
図3-9では、前出(図3-8)のDataFrame(dfy)に新規のカラム「male_ratio, female_ratio, male_ratio_scale」
のカラムを追加して作成した最終版のDataFrame(raw_df)の内容を表示しています。
このDataFrame(raw_df)には、後述するステップで使用する全てのデータが含まれています。
これでデータの準備作業が完了しました。
-
Plotly ExpressのChoropleth(コロプレス図)で人口データのマップを作成する
ここでは、Plotly Expressのコロプレス図で人口データを可視化します。
### 1: Map population

# set a defulat template
pio.templates.default = 'plotly_dark'

### 1-1: map population by prefecture

df = raw_df.copy()

fig = px.choropleth(
    df,
    locations='id',
    geojson=japan_prefectures,
    color='population',
    hover_name='prefecture_jp',
    hover_data=['male_ratio', 'female_ratio'],
    labels=dict(
                prefecture_jp='都道府県',
                population='人口',
                male_ratio='男性比率',
                female_ratio='女性比率',
                ),
    title='都道府県別人口 (2021年度)',
)

fig.update_geos(fitbounds='locations', visible=False)

fig.show()

# %%

### 1-2: Map population by prefecture
# add a color_continuous_scale, color_continuous_midpoint

df = raw_df.copy()

fig = px.choropleth(
    df,
    locations='id',
    geojson=japan_prefectures,
    color='population',
    hover_name='prefecture_jp',
    hover_data=['male_ratio', 'female_ratio'],
    color_continuous_scale=px.colors.diverging.BrBG,
    color_continuous_midpoint=0,
    labels=dict(
                prefecture_jp='都道府県',
                population='人口',
                male_ratio='男性比率',
                female_ratio='女性比率',
                ),
    title='都道府県別人口 (2021年度)',
)

fig.update_geos(fitbounds='locations', visible=False)

fig.show()


# %%

### 1-3: Map population by prefecture
# draw a map using choropleth_mapbox()

df = raw_df.copy()

fig = px.choropleth_mapbox(
    df,
    locations='id',
    geojson=japan_prefectures,
    color='population',
    hover_name='prefecture_jp',
    hover_data=['male_ratio', 'female_ratio'],
    mapbox_style='carto-positron',
    center={'lat': 35, 'lon': 139},
    zoom=3,
    opacity=0.5,
    labels=dict(
                prefecture_jp='都道府県',
                population='人口',
                male_ratio='男性比率',
                female_ratio='女性比率',
                ),
    title='都道府県別人口 (2021年度)',
)

fig.show()
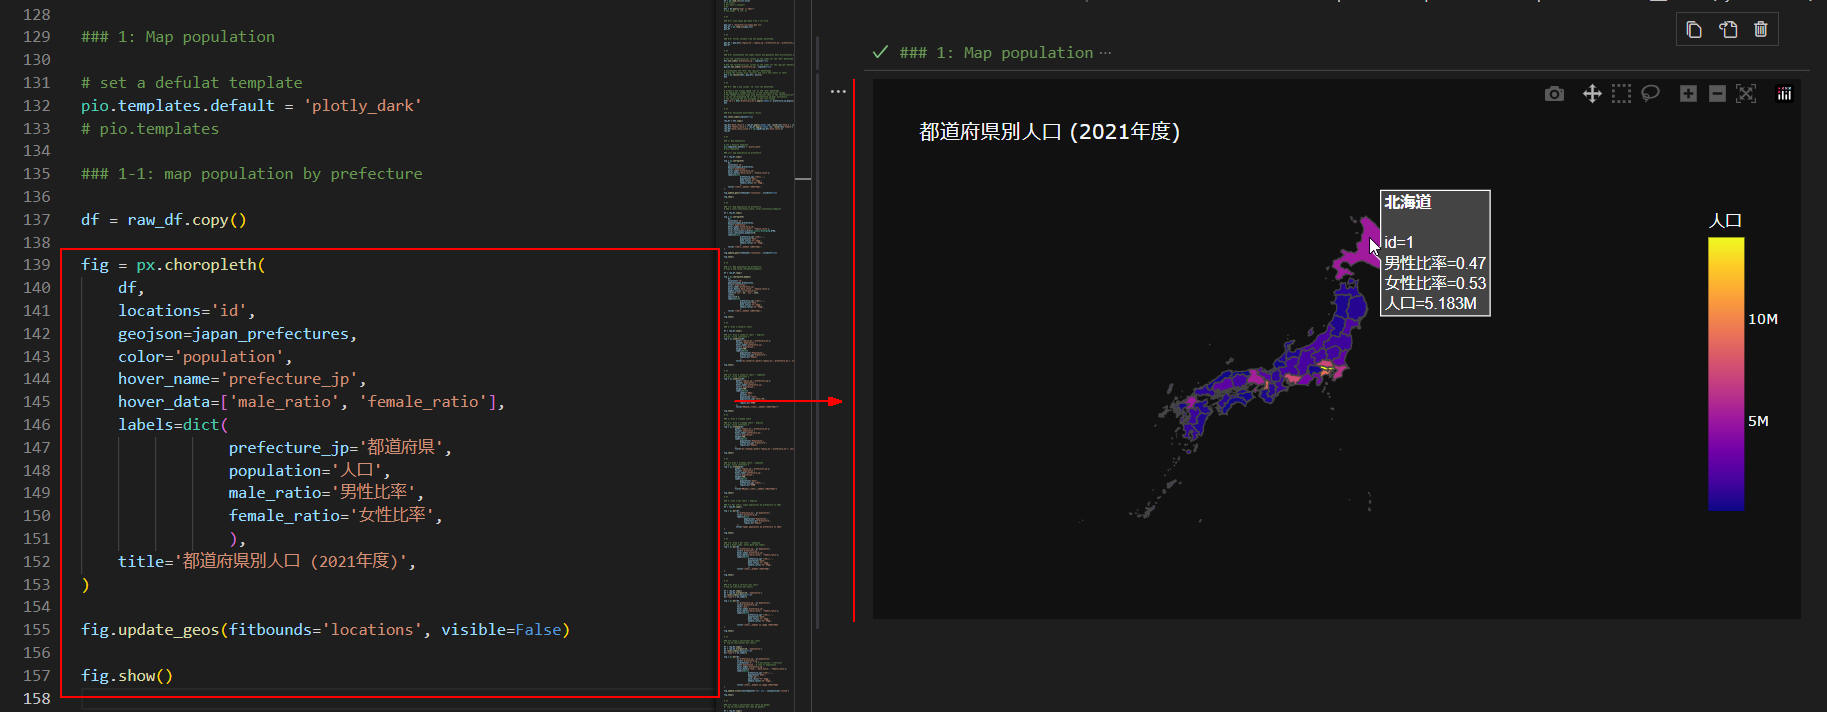 図4-1
図4-1では、日本地図にカラーマップを適用させて都道府県別の人口分布を表示させています。
都道府県の色が「青色」から「黄色」になるほど人口が多くなっています。
マップ上にマウスをホバリングさせると、ホバーテキストが表示されます。
ここでは「北海道」のホバーテキストが表示されています。
マップはマウスで移動させたりズームイン・ズームアウトさせることができます。
図4-1
図4-1では、日本地図にカラーマップを適用させて都道府県別の人口分布を表示させています。
都道府県の色が「青色」から「黄色」になるほど人口が多くなっています。
マップ上にマウスをホバリングさせると、ホバーテキストが表示されます。
ここでは「北海道」のホバーテキストが表示されています。
マップはマウスで移動させたりズームイン・ズームアウトさせることができます。
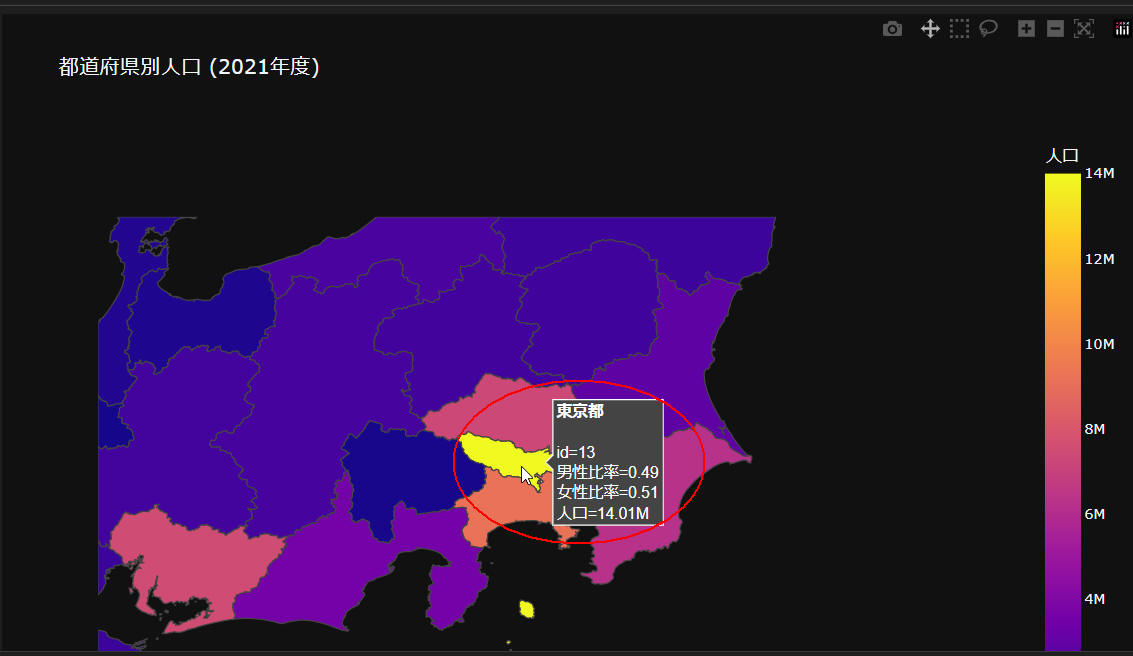 図4-2
図4-2では、関東地方をズームインしています。
ホバーテキストには「東京都」のデータが表示されています。
図4-2
図4-2では、関東地方をズームインしています。
ホバーテキストには「東京都」のデータが表示されています。
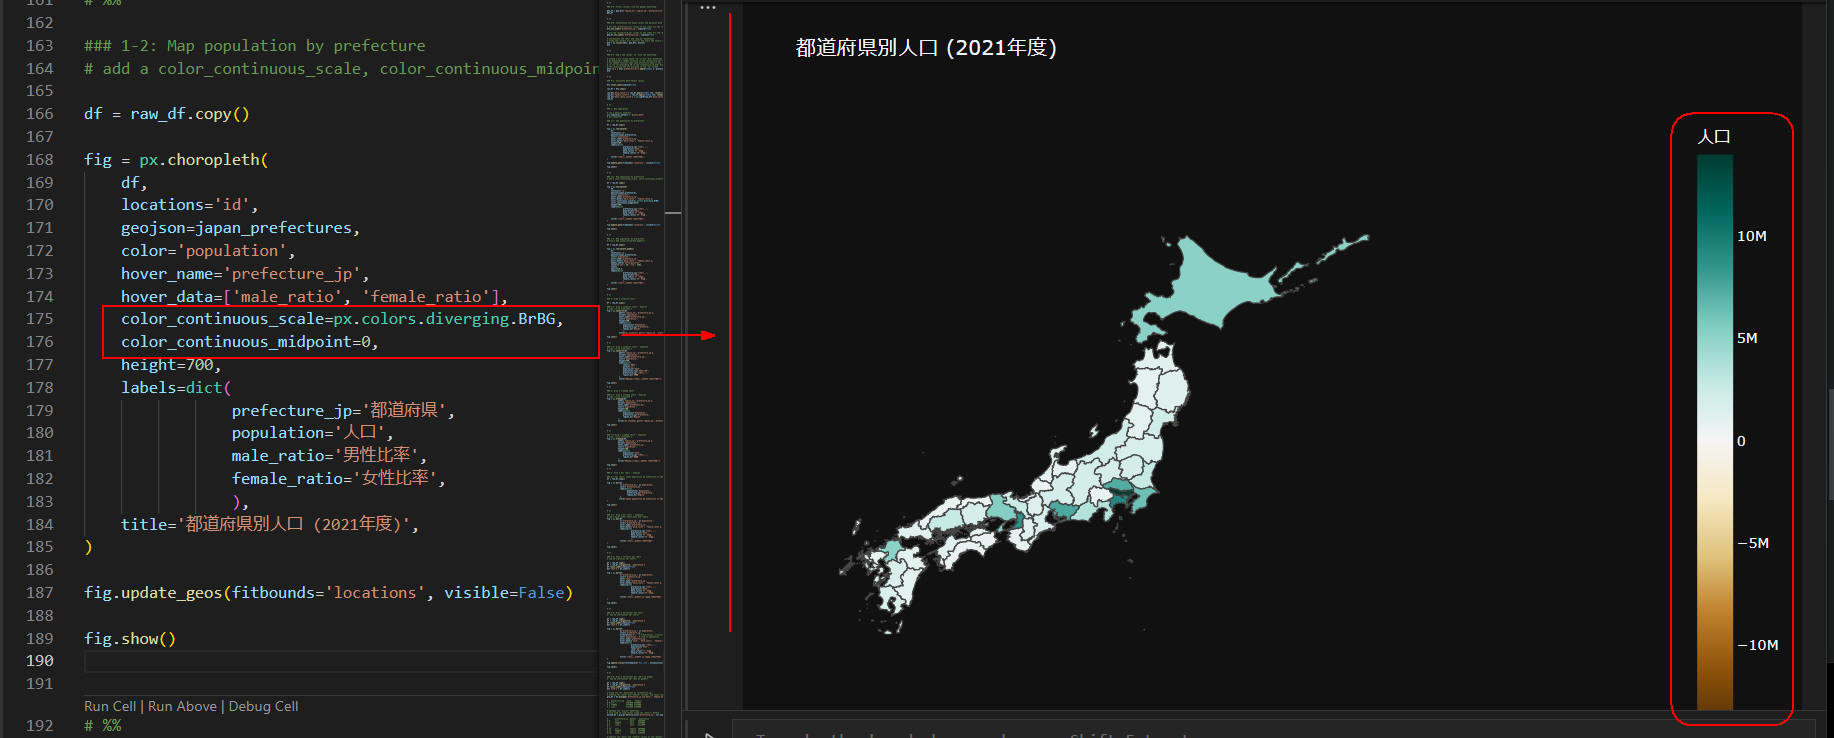 図4-3
図4-3では、Plotly Expressの「choropleth()」メソッドの引数に
「color_continuous_scale」を追加してカラーマップの色を変えています。
px.colors.divergingには「BrBG, PRGn, PiYG, PuOr, RdBu,...」などが指定できます。
詳細は、
「Built-In Diverging Color scales」
を参照してください。
図4-3
図4-3では、Plotly Expressの「choropleth()」メソッドの引数に
「color_continuous_scale」を追加してカラーマップの色を変えています。
px.colors.divergingには「BrBG, PRGn, PiYG, PuOr, RdBu,...」などが指定できます。
詳細は、
「Built-In Diverging Color scales」
を参照してください。
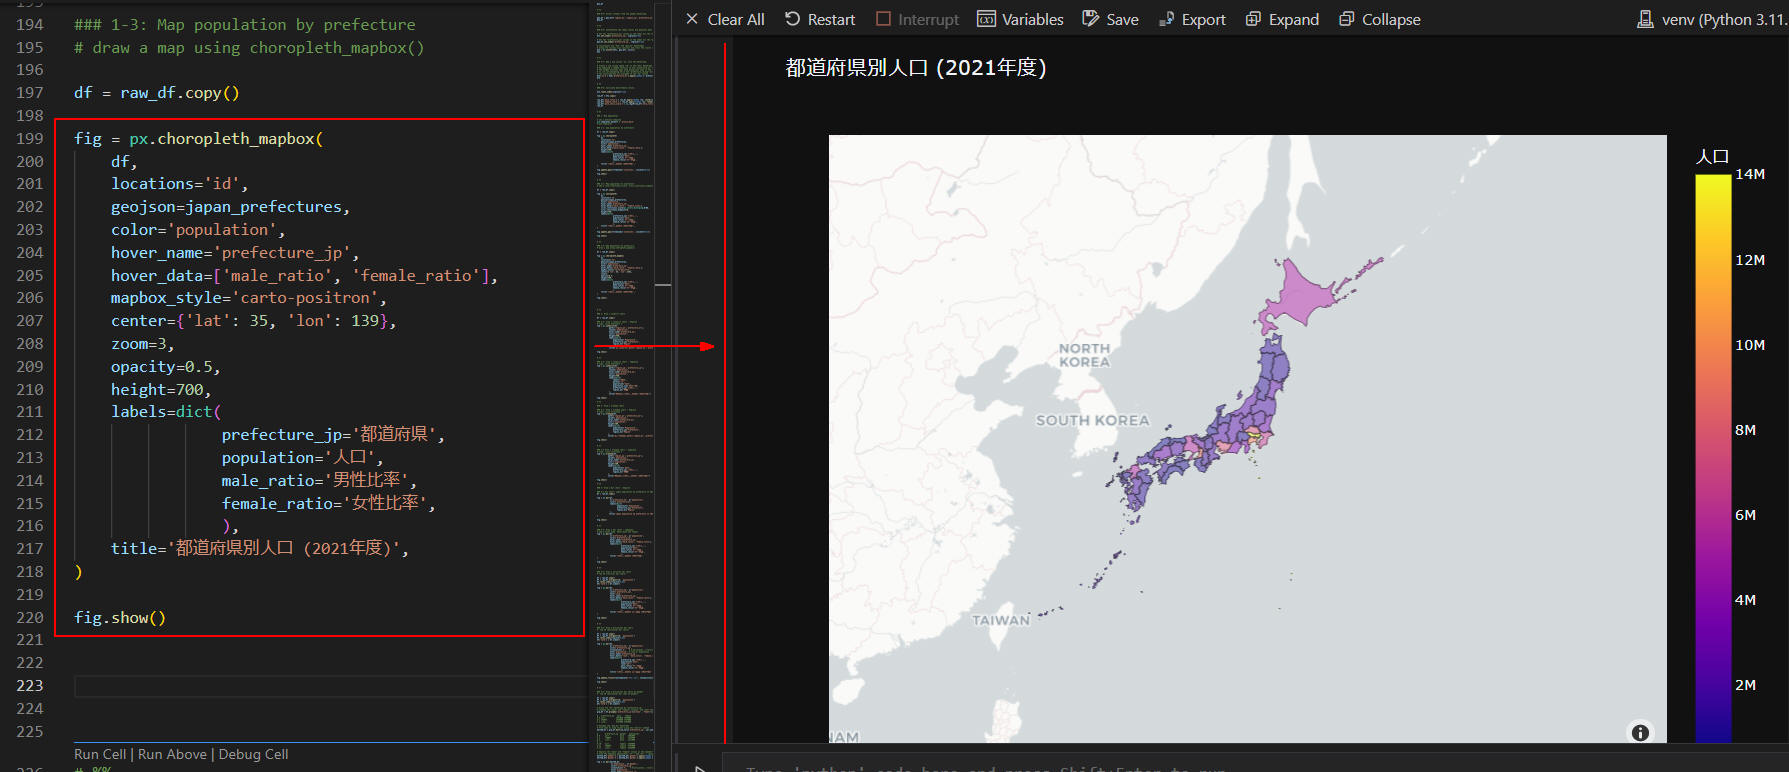 図4-4
図4-4では、Plotly Expressの「px.choropleth_mapbox()」メソッドを使用してマップを表示しています。
マップには「国名、都道府県名、都市名...」などが表示されます。
図4-4
図4-4では、Plotly Expressの「px.choropleth_mapbox()」メソッドを使用してマップを表示しています。
マップには「国名、都道府県名、都市名...」などが表示されます。
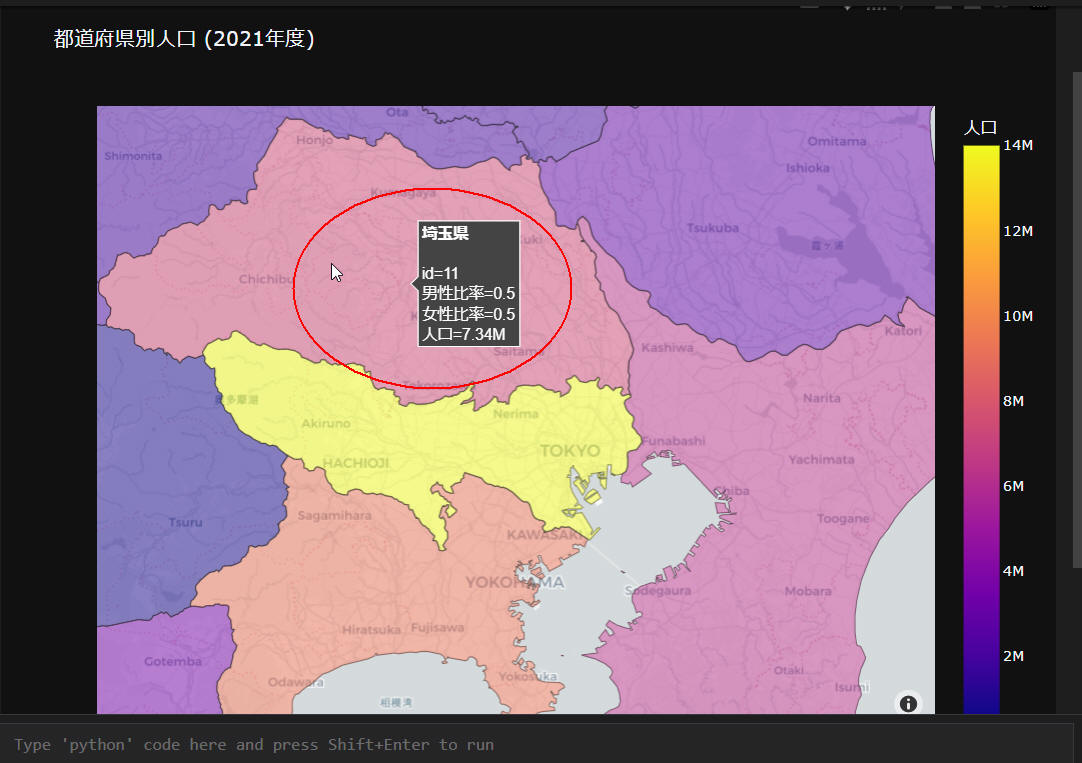 図4-5
図4-5では、前出(図4-4)のマップをズームインしています。
ここでは、ホバーテキストに「埼玉県」の情報が表示されています。
図4-5
図4-5では、前出(図4-4)のマップをズームインしています。
ここでは、ホバーテキストに「埼玉県」の情報が表示されています。
-
Plotly ExpressのSunburst(サンバーストチャート)で人口データを可視化する
ここでは、Plotly Expressのサンバーストチャートで人口データを可視化します。
### 2: Draw a sunburst chart

df = raw_df.copy()

### 2-1: Draw a sunburst chart : English
# tips: click continent ★
fig = px.sunburst(df,
            path=['region_en','prefecture_en'],
            values='population',
            hover_name='prefecture_jp',
            color='population',
            height=700,
            labels=dict(
                population='Population',
                prefecture_jp='Prefecture',
                region_en='Region'
                ),
            title="px.sunburst(,path=['region_en','prefecture_en'], values='population', color='population')")

fig.show()


# %%

### 2-2: Draw a sunburst chart : Japanese
# tips: click continent ★
fig = px.sunburst(df,
            path=['region_jp','prefecture_jp'],
            values='population',
            hover_name='prefecture_jp',
            color='population',
            height=700,
            labels=dict(
                labels='地方',
                parent='親',
                population='人口',
                population_sum='人口総数',
                prefecture_jp='都道府県',
                region_en='地域'
            ),
            title="地方別・都道府県別人口 (2021年度)")

fig.show()
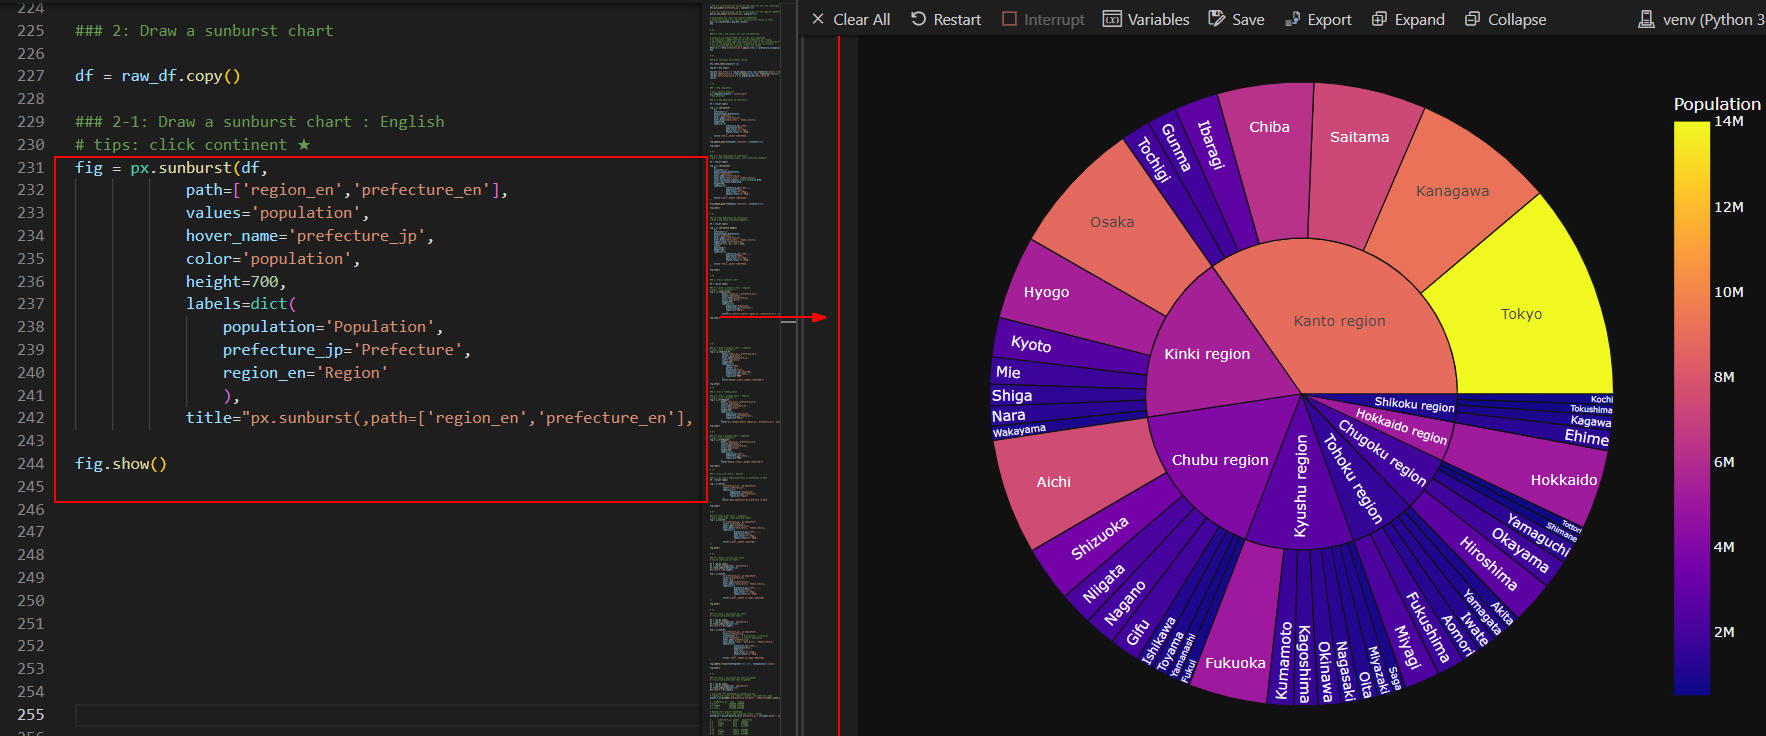 図5-1
図5-1では、地方、都道府県ごとの人口比率を円グラフで表示しています。
内側の円には、地方の人口比率が表示されています。
外側の円には、都道府県国ごとの人口比率が表示されています。
このグラフからは、地方と都道府県ごとの人口比率が同時に可視化できます。
図5-1
図5-1では、地方、都道府県ごとの人口比率を円グラフで表示しています。
内側の円には、地方の人口比率が表示されています。
外側の円には、都道府県国ごとの人口比率が表示されています。
このグラフからは、地方と都道府県ごとの人口比率が同時に可視化できます。
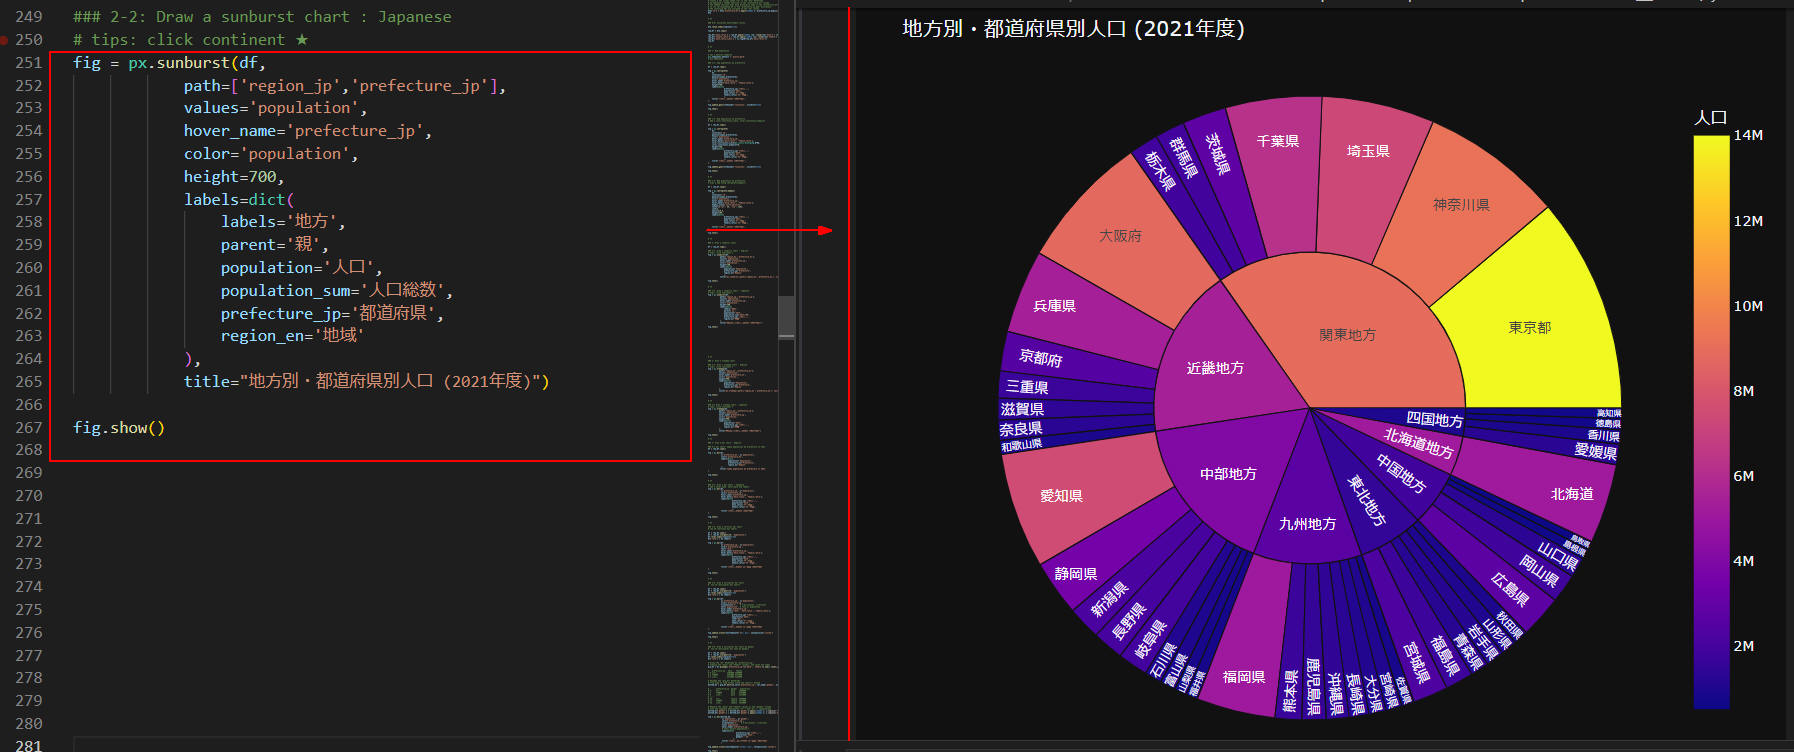 図5-2
図5-2では、前出(図5-1)のグラフを日本語で表示しています。
内側の円の地方「関東地方、近畿地方、中部地方...」をクリックすると、
その地域の都道府県が表示されます。
円グラフの色が「青色」から「黄色」になると人口が増えていることを意味します。
なので、「円弧」の大きさと「色」から人口比率を可視化できます。
図5-2
図5-2では、前出(図5-1)のグラフを日本語で表示しています。
内側の円の地方「関東地方、近畿地方、中部地方...」をクリックすると、
その地域の都道府県が表示されます。
円グラフの色が「青色」から「黄色」になると人口が増えていることを意味します。
なので、「円弧」の大きさと「色」から人口比率を可視化できます。
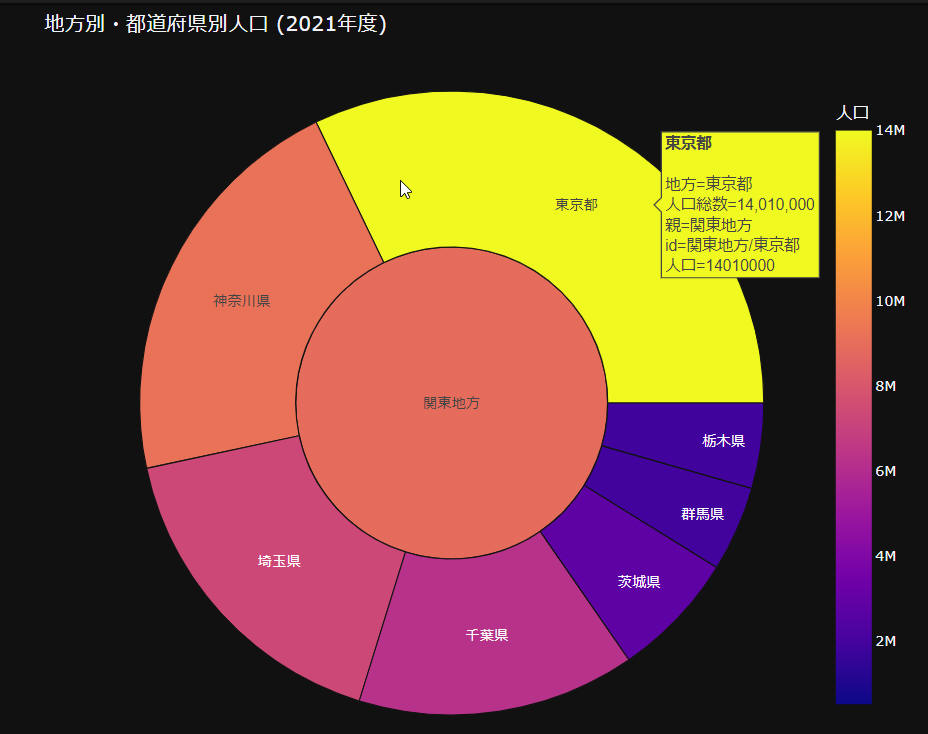 図5-3
図5-3では、前出(図5-2)のグラフから「関東地方」をクリックしています。
このグラフには「関東地方」の都道府県が表示されています。
都道府県にマウスをホバリングさせると、ホバーテキストが表示されます。
ここでは「東京都」のホバーテキストが表示されています。
図5-3
図5-3では、前出(図5-2)のグラフから「関東地方」をクリックしています。
このグラフには「関東地方」の都道府県が表示されています。
都道府県にマウスをホバリングさせると、ホバーテキストが表示されます。
ここでは「東京都」のホバーテキストが表示されています。
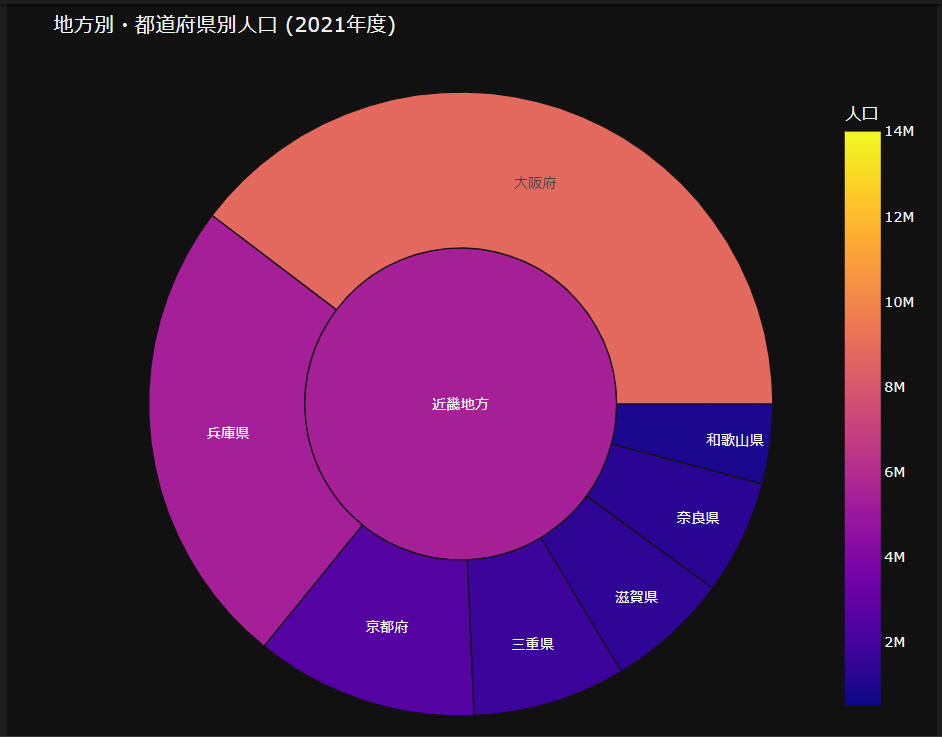 図5-4
図5-4では、前出(図5-2)のグラフから「近畿地方」をクリックしています。
このグラフには「近畿地方」の都道府県が表示されています。
図5-4
図5-4では、前出(図5-2)のグラフから「近畿地方」をクリックしています。
このグラフには「近畿地方」の都道府県が表示されています。
-
Plotly ExpressのTreemap(ツリーマップ)で人口データを可視化する
ここでは、Plotly Expressのツリーマップで人口データを可視化します。
### 3: Draw a treemap chart

### 3-1: Draw a treemap chart : English
# tips: click continent ★
fig = px.treemap(df,
           path=['region_en','prefecture_en'],
           values='population',
           hover_name='prefecture_en',
           color='population',
           height=700,
           labels=dict(
                population='Population',
                prefecture_jp='Prefecture',
                region_en='Region'
           ),
           title="px.treemap(,path=['region_en','prefecture_en'], values='population', color='population')")

fig.show()


# %%

### 3-2 Draw a treemap chart : Japanese
# tips: click continent ★
fig = px.treemap(df,
           path=['region_jp','prefecture_jp'],
           values='population',
           hover_name='prefecture_jp',
           color='population',
           height=700,
           labels=dict(
                population='人口',
                prefecture_jp='都道府県',
                region_en='地域'
           ),
           title="地方別・都道府県別人口 (2021年度)")

fig.show()
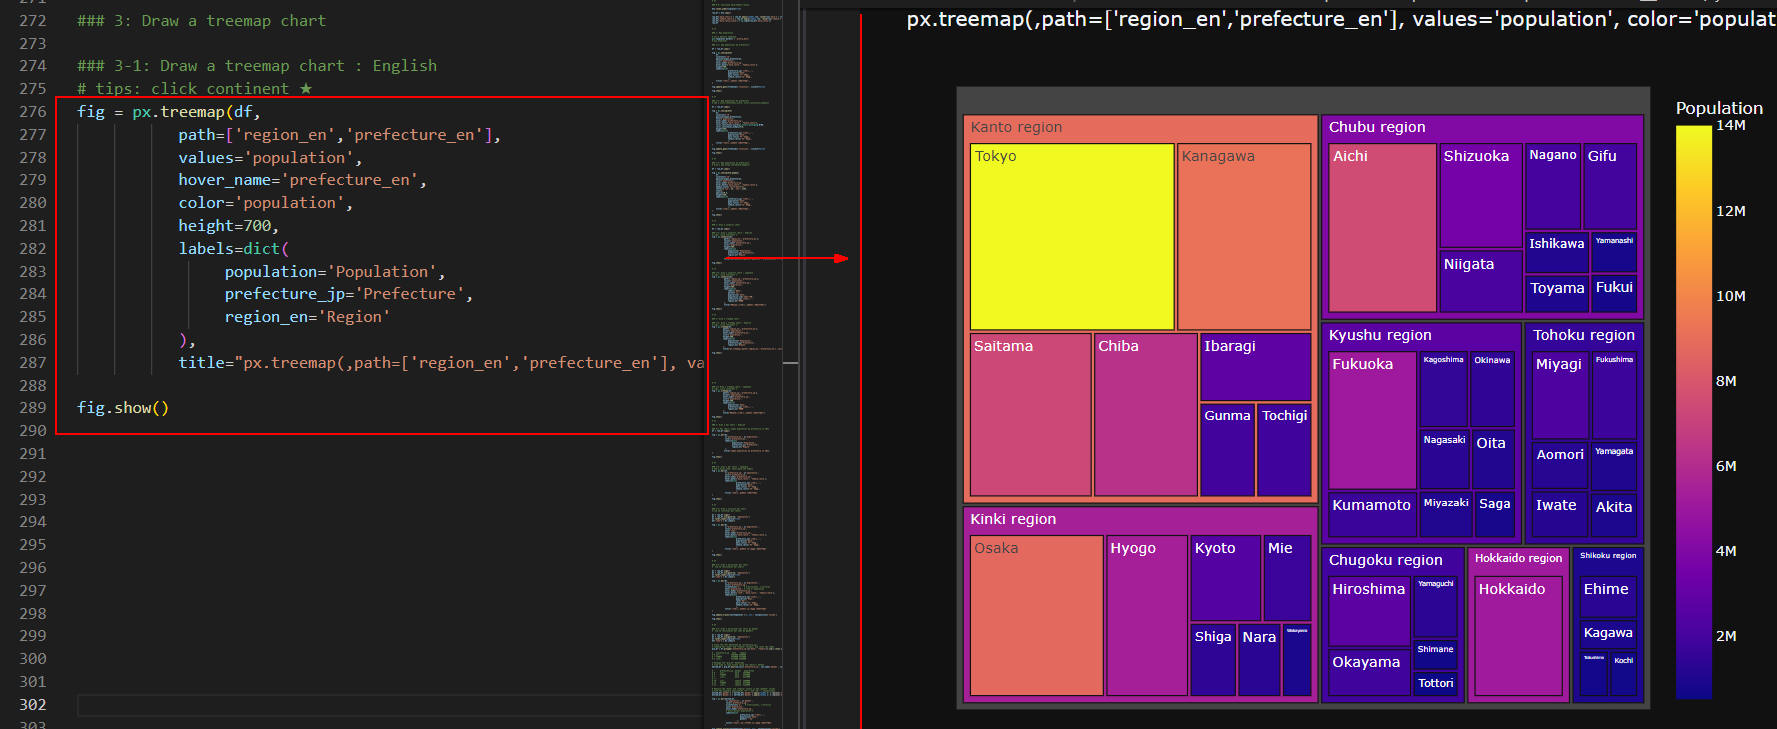 図6-1
図6-1では、地方、都道府県ごとの人口比率をツリーマップで表示しています。
ツリーマップには、地方、都道府県が英語で表示されています。
都道府県の色が「青色」から「黄色」に変わると人口が増えていることを意味します。
また、ツリーマップの四角の大きさは人口比率と連動しています。
なので、人口比率を「色」と「四角の大きさ」で視覚化することができます。
図6-1
図6-1では、地方、都道府県ごとの人口比率をツリーマップで表示しています。
ツリーマップには、地方、都道府県が英語で表示されています。
都道府県の色が「青色」から「黄色」に変わると人口が増えていることを意味します。
また、ツリーマップの四角の大きさは人口比率と連動しています。
なので、人口比率を「色」と「四角の大きさ」で視覚化することができます。
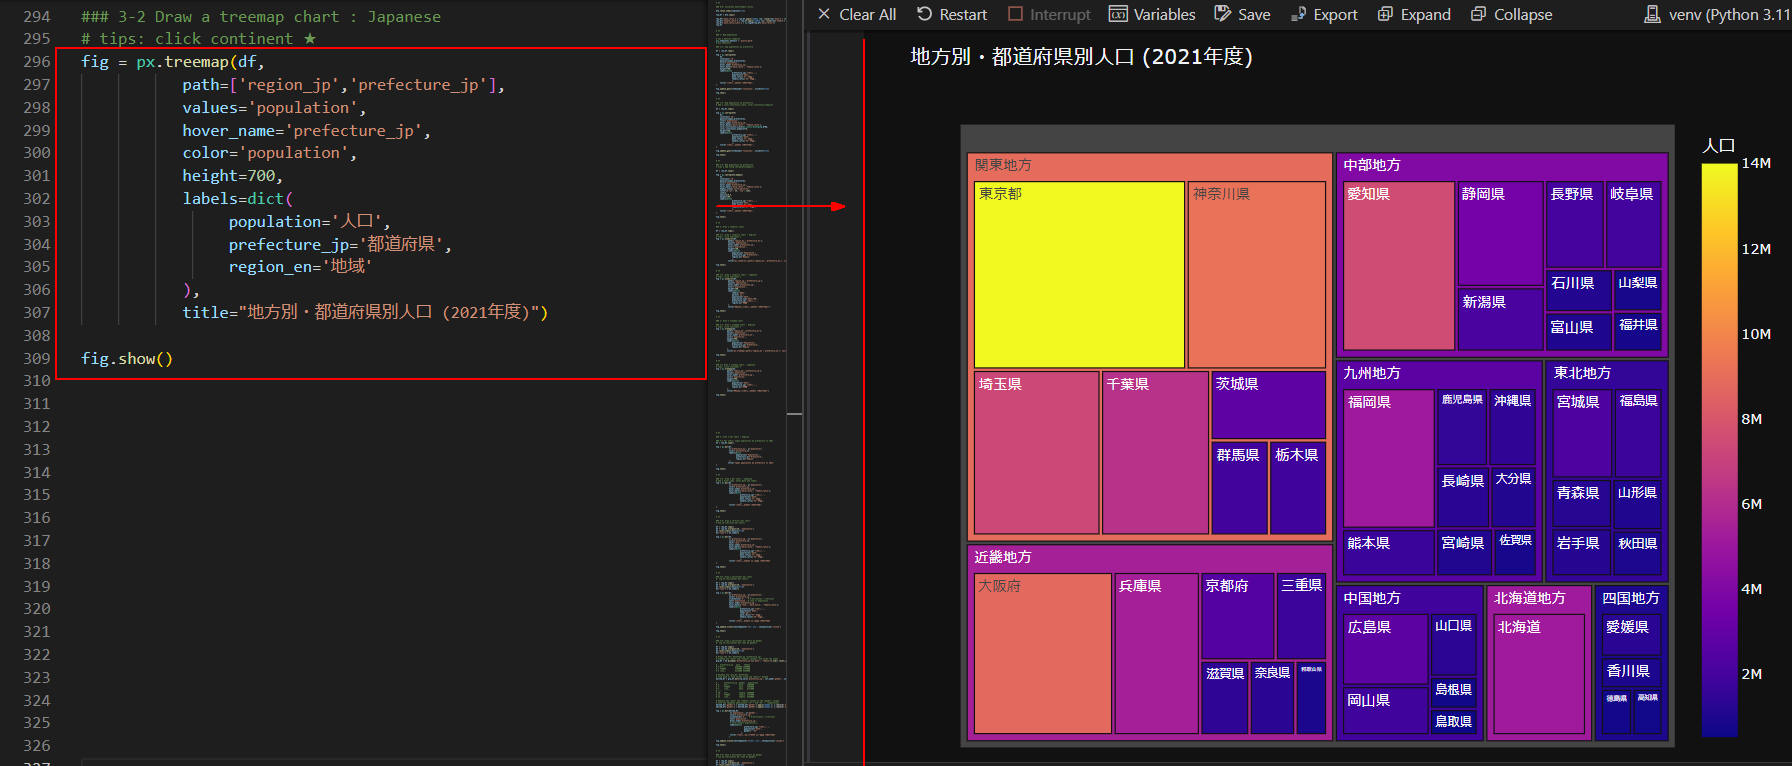 図6-2
図6-2では、前出(図6-1)のツリーマップを日本語で表示しています。
図6-2
図6-2では、前出(図6-1)のツリーマップを日本語で表示しています。
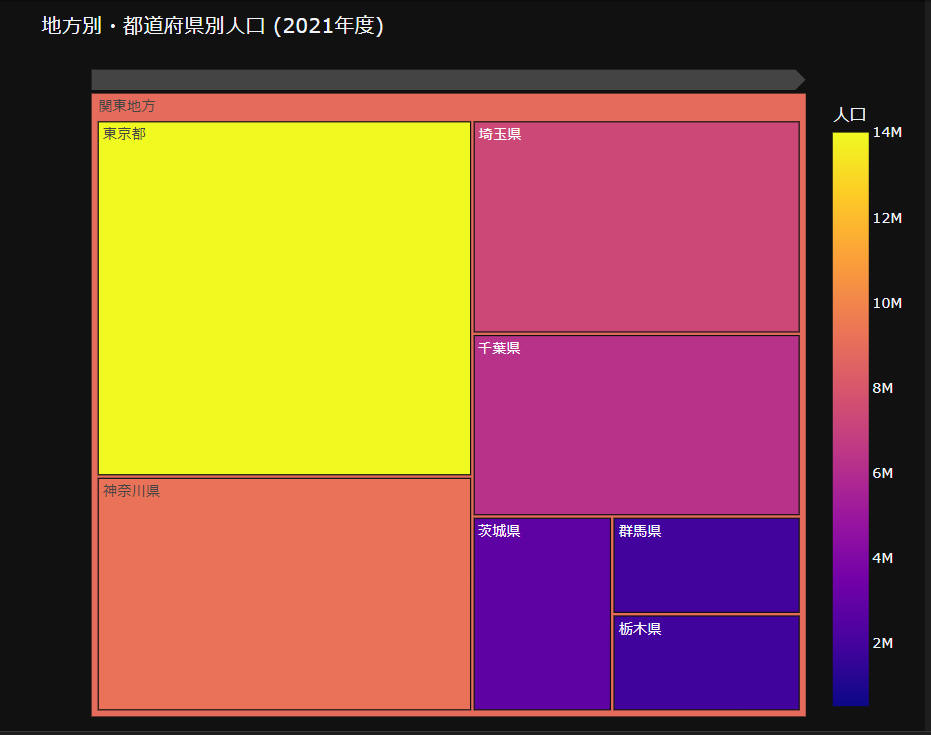 図6-3
図6-3では、前出(図6-2)のツリーマップから「関東地方」をクリックしています。
ツリーマップには、関東地方の都道府県が表示されています。
図6-3
図6-3では、前出(図6-2)のツリーマップから「関東地方」をクリックしています。
ツリーマップには、関東地方の都道府県が表示されています。
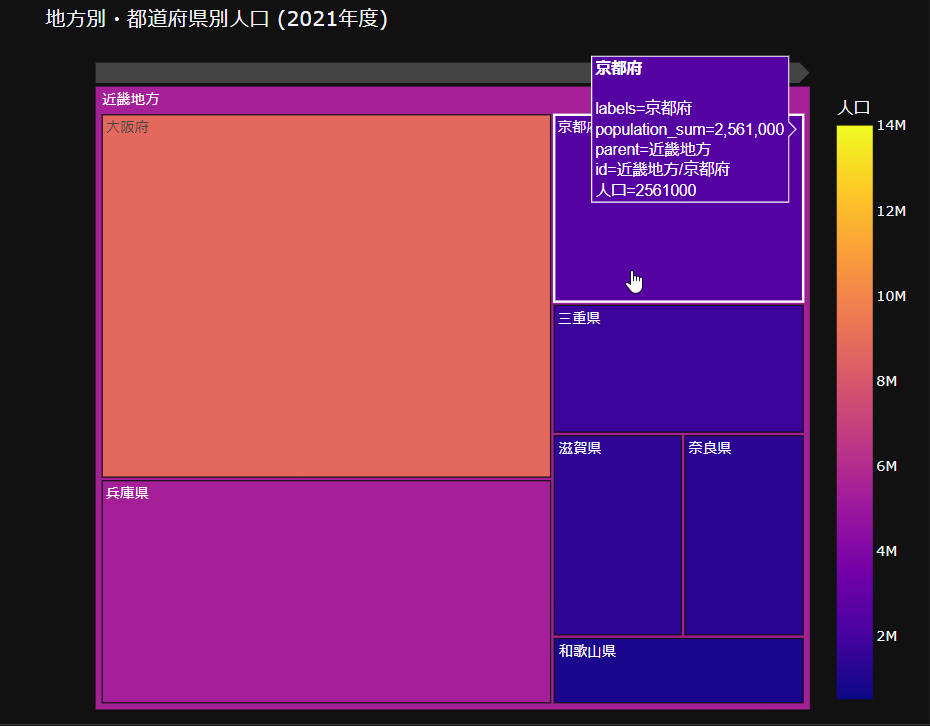 図6-4
図6-4では、前出(図6-2)のツリーマップから「近畿地方」をクリックしています。
ツリーマップには、近畿地方の都道府県が表示されています。
都道府県にマウスをホバリングさせると、ホバーテキストが表示されます。
ここでは、「京都府」のホバーテキストが表示されています。
図6-4
図6-4では、前出(図6-2)のツリーマップから「近畿地方」をクリックしています。
ツリーマップには、近畿地方の都道府県が表示されています。
都道府県にマウスをホバリングさせると、ホバーテキストが表示されます。
ここでは、「京都府」のホバーテキストが表示されています。
-
Plotly ExpressのBar Chart(棒グラフ)で人口データを可視化する
ここでは、棒グラフで人口データを可視化します。
棒グラフは、垂直形と水平形で表示します。
### 4: Draw a bar chart : English

### 4-1 bar chart: Japan population by prefecture in 2021
df = raw_df.copy()

fig = px.bar(df,
             x='prefecture_en', y='population',
             color='prefecture_en',
             labels=dict(
                    population='Population',
                    prefecture_en='Prefecture',
                    region_en='Region'
             ),
            title='Japan population by prefecture in 2021'
)

fig.show()


# %%

### 4-2: Draw a bar chart : Japanese
# add a hover_name, hover_data and labels
fig = px.bar(df,
             x='prefecture_jp', y='population',
             color='prefecture_jp',
             hover_name='prefecture_jp',
             hover_data=['male_ratio', 'female_ratio'],
             labels=dict(
                        prefecture_jp='都道府県',
                        population='人口',
                        male_ratio='男性比率',
                        female_ratio='女性比率',
                        ),
             title='都道府県別人口 (2021年度)'
)

fig.show()


# %%

### 4-3: Draw a vertical bar chart
# add a text
# top 10 (vertical bar chart)

df = raw_df.copy()
df = df.nlargest(10, 'population')
df.reset_index(inplace=True)
df['rank'] = df.index+1

fig = px.bar(df,
             x='prefecture_jp', y='population',
             color='prefecture_jp',
             text='rank',
             hover_name='prefecture_jp',
             hover_data=['male_ratio', 'female_ratio'],
             labels=dict(
                        prefecture_jp='都道府県',
                        population='人口',
                        male_ratio='男性比率',
                        female_ratio='女性比率',
                        ),
             title='都道府県別人口 上位10 (2021年度)'
)

fig.show()


# %%

### 4-4: Draw a horizontal bar chart
#  top 10 (horizontal bar chart)

df = raw_df.copy()
df = df.nlargest(10, 'population')
df.reset_index(inplace=True)
df['rank'] = df.index+1

fig = px.bar(df,
             y='prefecture_jp', x='population',
             color='prefecture_jp',
             orientation='h',   # h-horizontal, v-vertical
             text='population', # rank or population
             hover_name='prefecture_jp',
             hover_data=['rank', 'male_ratio', 'female_ratio'],
             labels=dict(
                        prefecture_jp='都道府県',
                        population='人口',
                        rank='順位',
                        male_ratio='男性比率',
                        female_ratio='女性比率',
                        ),
             title='都道府県別人口 上位10 (2021年度)'
)

fig.update_traces(texttemplate='%{x:.2s}', textposition='inside')

fig.show()


# %%

### 4-5: Draw a horizontal bar chart by gender
#  top 10 (horizontal bar chat by gender)

df = raw_df.copy()
df = df.nlargest(10, 'population')
df.reset_index(inplace=True)
df['rank'] = df.index+1

# Group the "df" DataFrame by "prefecture_jp",
# summing the "male" and "female" columns, and reset the index
grp_df = df.groupby('prefecture_jp')[['male', 'female']].sum().reset_index()

# Reshape the "grp_df" DataFrame
# from wide to long format using the "melt()" method
melted_df = grp_df.melt(id_vars='prefecture_jp', var_name='gender', value_name='population')

# Replace the "male" and "female" values in the "gender" column
# with the Japanese equivalents "男性" and "女性", respectively
melted_df['gender'] = melted_df['gender'].apply(lambda x: x.replace('female','女性'))
melted_df['gender'] = melted_df['gender'].apply(lambda x: x.replace('male','男性'))

fig = px.bar(melted_df,
              x='population', y='gender',
              color='prefecture_jp',
              orientation='h',   # h-horizontal, v-vertical
              text='population',
              hover_name='prefecture_jp',
              labels=dict(
                            prefecture_jp='都道府県',
                            population='人口',
                            gender='性別'
                         ),
              title='都道府県別・男女比 上位10 (2021年度)'
             )

fig.update_traces(texttemplate='%{text:.2s}', textposition='inside')

fig.show()


# %%

### 4-6: Draw a horizontal bar chart by gender
# top 10 (horizontal bar chat by gender)

df = raw_df.copy()
df = df.nlargest(10, 'population')
df.reset_index(inplace=True)
df['rank'] = df.index+1

# Create a bar chart using Plotly with separate bars for male and female populations

fig = go.Figure()

# add a female bar chart
fig.add_trace(go.Bar(
    y=df['prefecture_jp'],
    x=df['female']*-1,
    orientation='h',
    name='女性',
    text=df['female'],
    textposition='inside',
    # marker=dict(color='red')
    marker=dict(color='#FFC0CB')
))

# add a male bar chart
fig.add_trace(go.Bar(
    y=df['prefecture_jp'],
    x=df['male'],
    orientation='h',
    name='男性',
    text=df['male'],
    textposition='inside',
    # marker=dict(color='green')
    marker=dict(color='#6495ED')
))

# Customize the chart layout with titles, legends, and axis labels
fig.update_layout(
    barmode='overlay',
    xaxis=dict(
        side='top',
        tickfont=dict(size=10)
    ),
    yaxis=dict(
        tickfont=dict(size=10),
        anchor='x',
        mirror=True
    ),
    title='都道府県別・男女別人口 上位10 (2021年度)',
    legend=dict(
        orientation='h',
        yanchor='bottom',
        y=1.02,
        xanchor='right',
        x=1
    ),
    height=600,
    margin=dict(l=150, r=50, t=50, b=50)
)

# fig.update_traces(texttemplate='%{x:.2s}', textposition='inside')

fig.update_traces(texttemplate='%{x:,.0f}', textposition='inside')

fig.show()


# %%

### 4-7: Draw a vertical bar chart
#  bottom 10 (Vertical bar chart)

df = raw_df.copy()
df = df.nsmallest(10, 'population')
df.reset_index(inplace=True)
df['rank'] = df.index+1

fig = px.bar(df,
             x='prefecture_jp', y='population',
             color='prefecture_jp',
             text='rank',
             hover_name='prefecture_jp',
             hover_data=['male_ratio', 'female_ratio'],
             labels=dict(
                        prefecture_jp='都道府県',
                        population='人口',
                        rank='順位',
                        male_ratio='男性比率',
                        female_ratio='女性比率',
                        ),
             title='都道府県別人口 下位10 (2021年度)'
)

fig.show()


# %%

### 4-8: Draw a horizontal bar chart
# bottom 10 (Horizontal bar chart)

df = raw_df.copy()
df = df.nsmallest(10, 'population')
df.reset_index(inplace=True)
df['rank'] = df.index+1

fig = px.bar(df,
             y='prefecture_jp', x='population',
             color='prefecture_jp',
             orientation='h',   # h-horizontal, v-vertical
             text='rank',
             hover_name='prefecture_jp',
             hover_data=['male_ratio', 'female_ratio'],
             labels=dict(
                         prefecture_jp='都道府県',
                         population='人口',
                         rank='順位',
                         male_ratio='男性比率',
                         female_ratio='女性比率',
                        ),
             title='都道府県別人口 下位10 (2021年度)'
            )

fig.show()
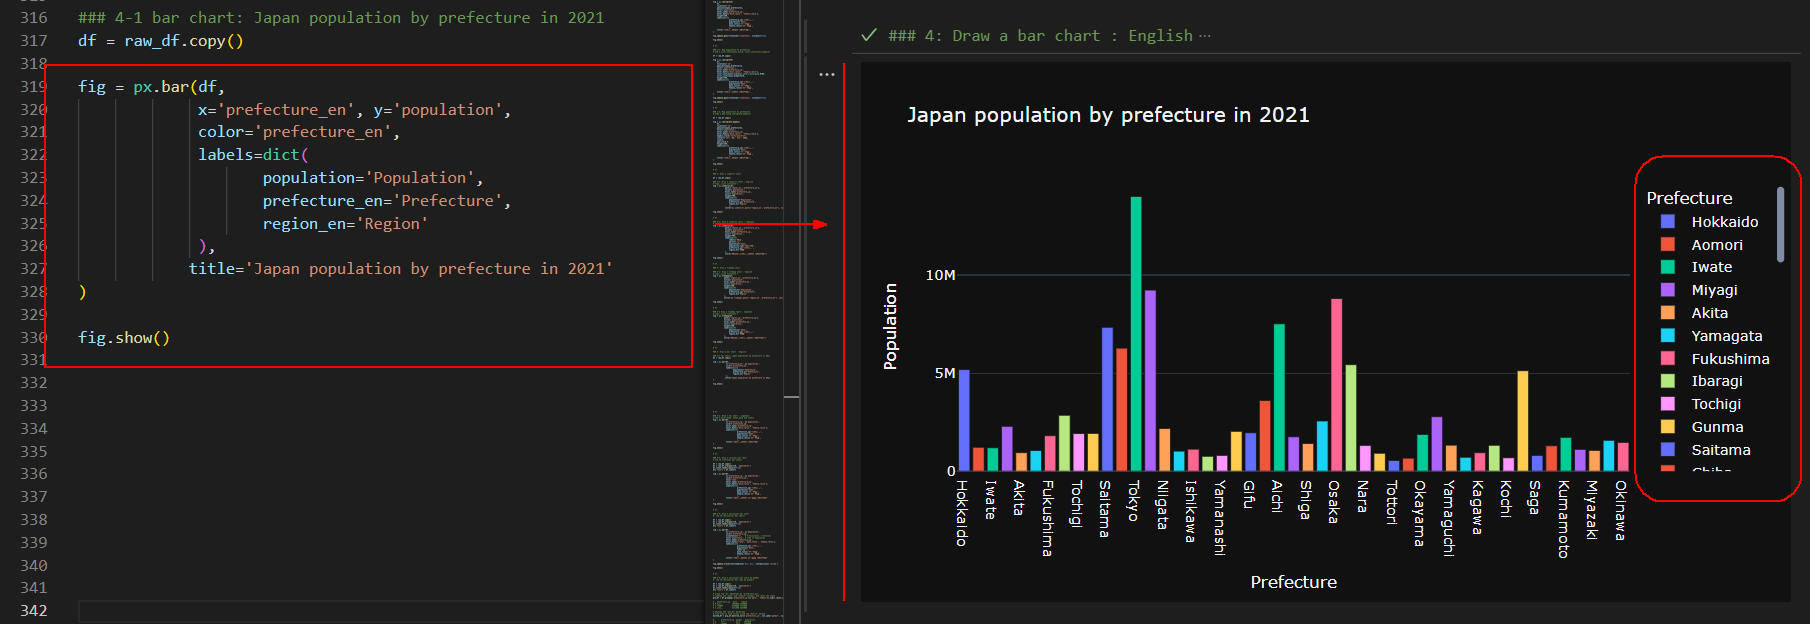 図7-1
図7-1では、都道府県別の人口を垂直形の棒グラフで表示しています。
この棒グラフには、都道府県名と凡例が英語で表示されています。
図7-1
図7-1では、都道府県別の人口を垂直形の棒グラフで表示しています。
この棒グラフには、都道府県名と凡例が英語で表示されています。
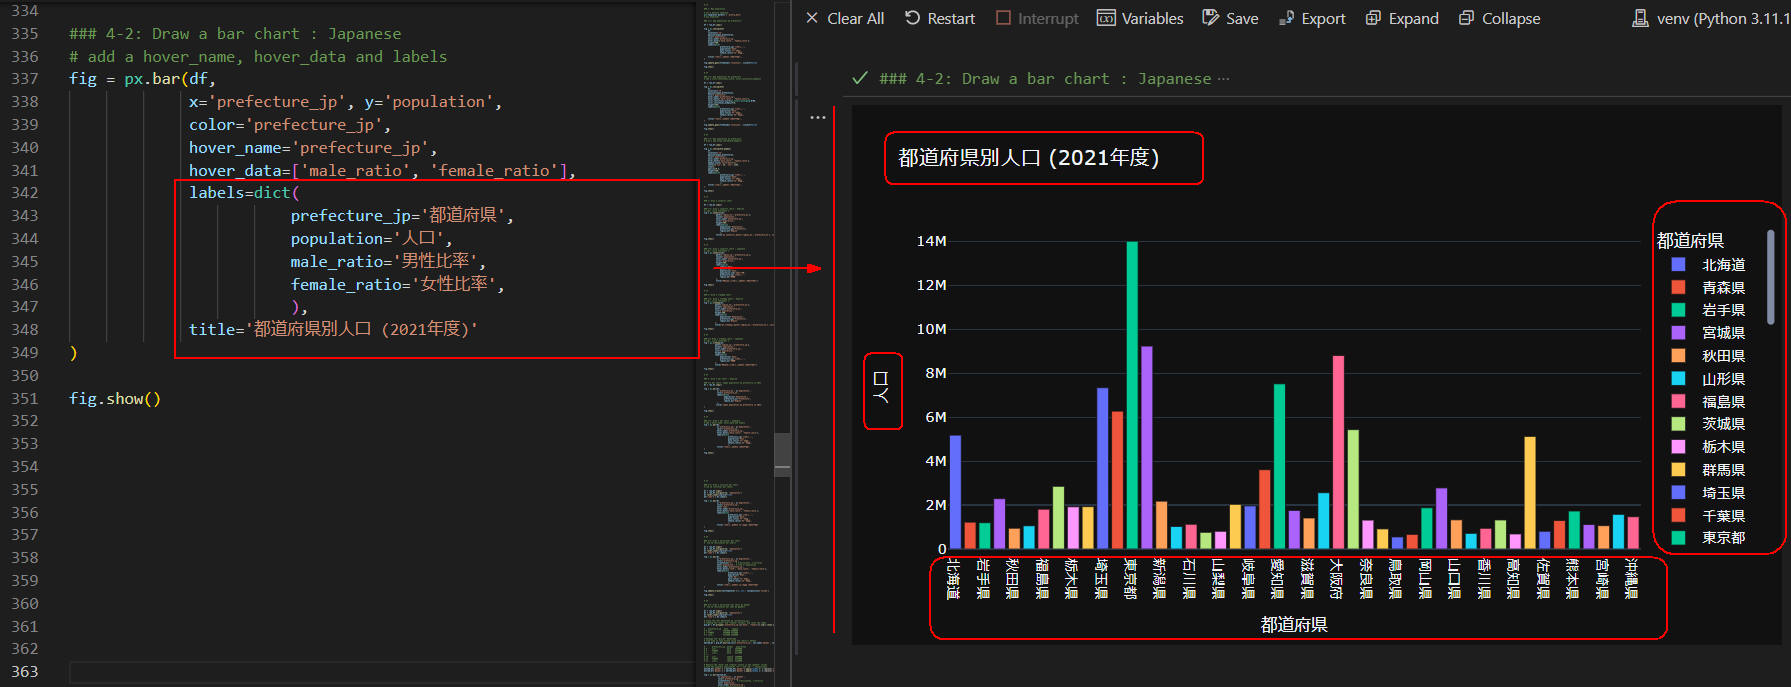 図7-2
図7-2では、前出(図7-1)の棒グラフを日本語で表示しています。
PandasのDataFrameには、英語と日本語の「都道府県名」が格納されているので
簡単に「英語」「日本語」の切り替えができます。
図7-2
図7-2では、前出(図7-1)の棒グラフを日本語で表示しています。
PandasのDataFrameには、英語と日本語の「都道府県名」が格納されているので
簡単に「英語」「日本語」の切り替えができます。
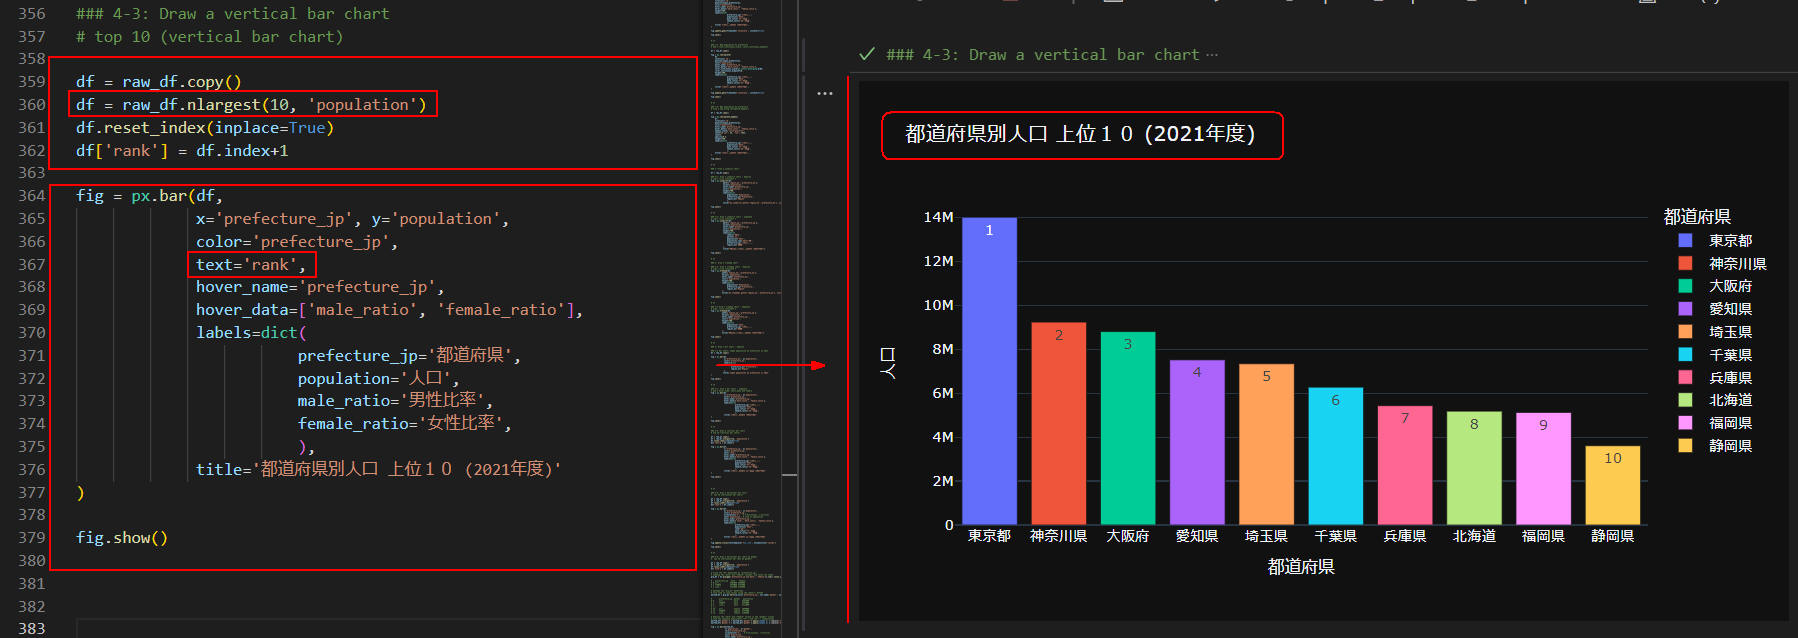 図7-3
図7-3では、人口の上位10の都道府県を棒グラフに表示しています。
上位10の都道府県を絞り込むには、
DataFrameの「nlargest()」メソッドを使用します。
棒グラフには、順位も表示されています。
順位を表示するには、
Plotly Expressの「bar()」メソッドに引数「text='rank'」を追加します。
図7-3
図7-3では、人口の上位10の都道府県を棒グラフに表示しています。
上位10の都道府県を絞り込むには、
DataFrameの「nlargest()」メソッドを使用します。
棒グラフには、順位も表示されています。
順位を表示するには、
Plotly Expressの「bar()」メソッドに引数「text='rank'」を追加します。
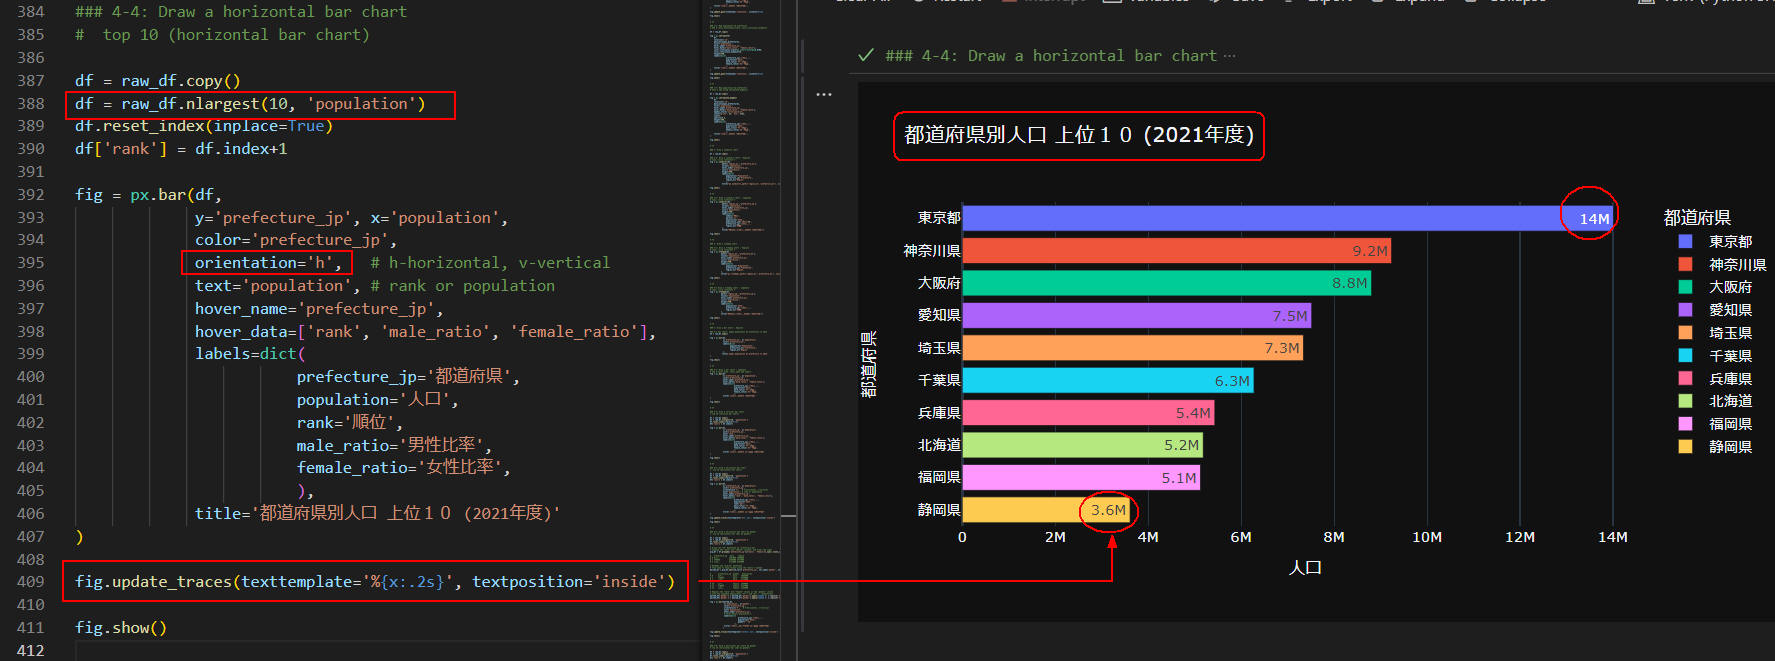 図7-4
図7-4では、前出(図7-3)の棒グラフを水平形で表示しています。
棒グラフを水平形にするには、
Plotly Expressの「bar()」メソッドに引数「orientation='h'」を追加します。
ここでは、figureクラスの「update_traces()」メソッドを使用して、
棒グラフに都道府県別の人口も表示しています。
図7-4
図7-4では、前出(図7-3)の棒グラフを水平形で表示しています。
棒グラフを水平形にするには、
Plotly Expressの「bar()」メソッドに引数「orientation='h'」を追加します。
ここでは、figureクラスの「update_traces()」メソッドを使用して、
棒グラフに都道府県別の人口も表示しています。
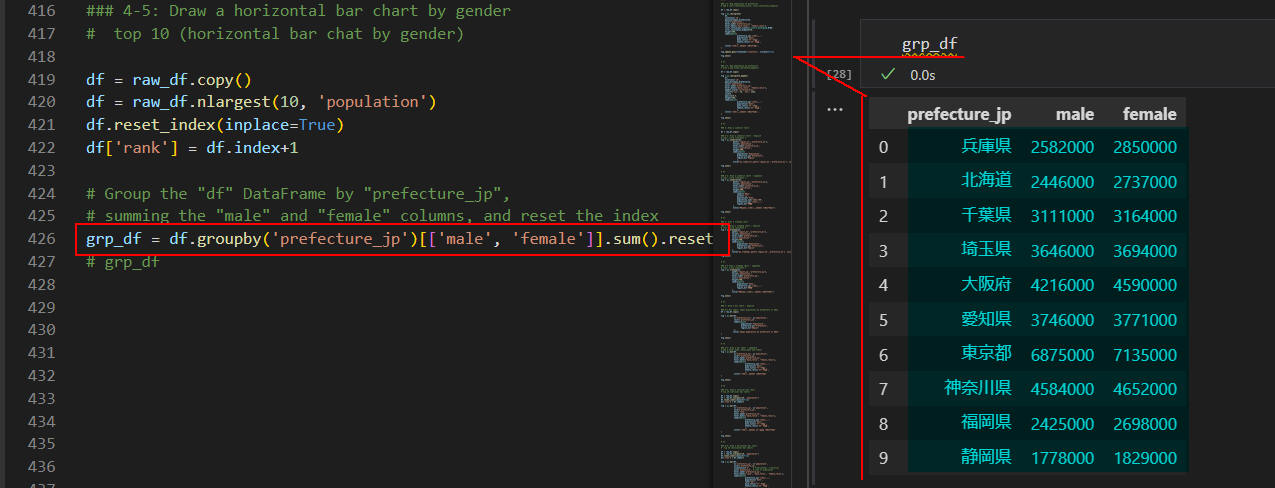 図7-5
図7-5では、図7-7の棒グラフを作成するための準備をしています。
ここでは、DataFrameに格納されているデータから人口の上位10の都道府県を絞り込みます。
そして、都道府県ごとの男女の人口を集計しています。
DataFrame(grp_df)には、上位10の都道府県の「都道府県名(prefecture_jp)、
男性人口(male)、女性人口(female)」が格納されています。
図7-5
図7-5では、図7-7の棒グラフを作成するための準備をしています。
ここでは、DataFrameに格納されているデータから人口の上位10の都道府県を絞り込みます。
そして、都道府県ごとの男女の人口を集計しています。
DataFrame(grp_df)には、上位10の都道府県の「都道府県名(prefecture_jp)、
男性人口(male)、女性人口(female)」が格納されています。
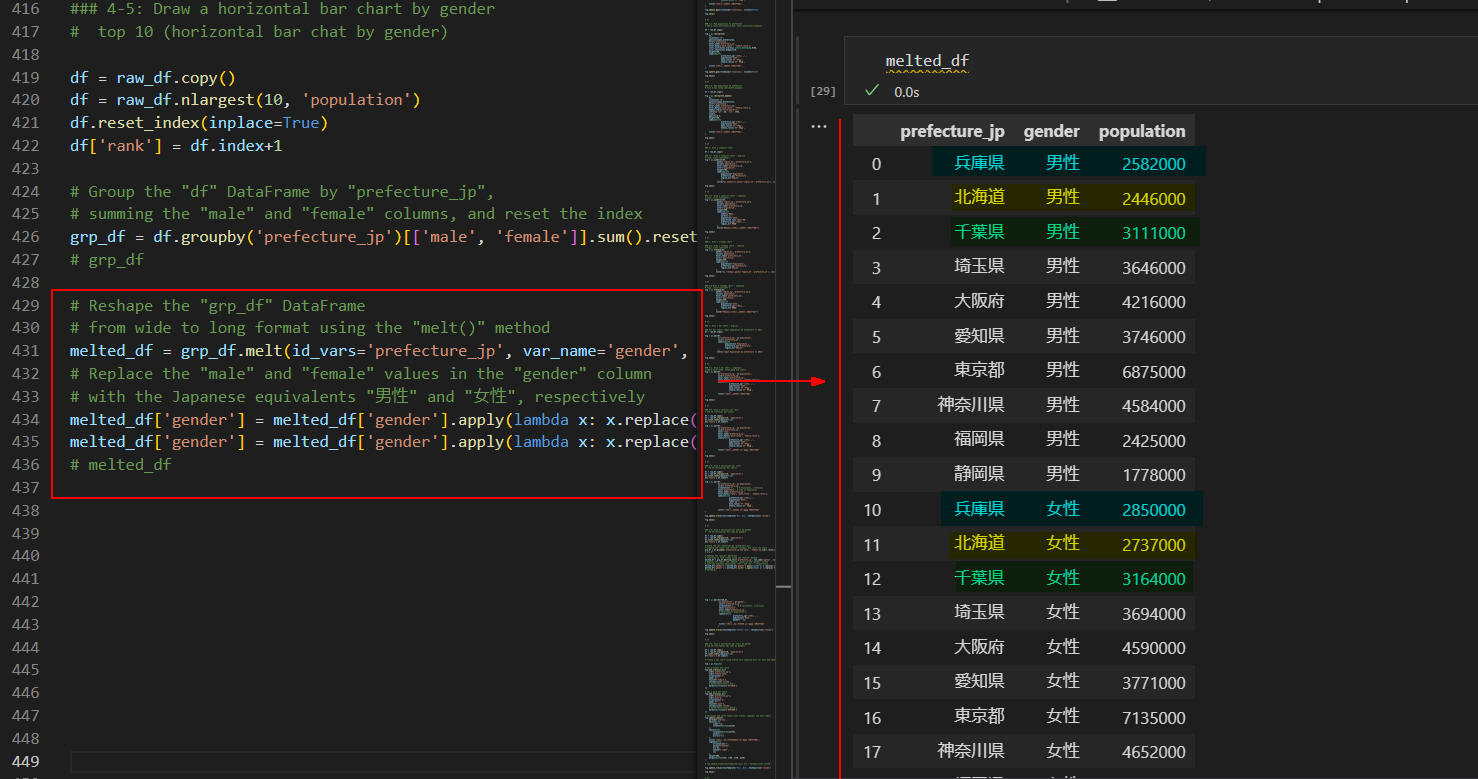 図7-6
図7-6では、図7-7の棒グラフを作成するための準備をしています。
ここでは、DataFrame(grp_df)のカラム「male, female」を横形式から縦形式に変換しています。
横形式から縦形式に変換するには、DataFrameの「melt()」メソッドを使用します。
ここではさらに、DataFrame(melted_df)に格納されている「gender」の値を
英語(male, female)から日本語(男性, 女性)に変換しています。
図7-6
図7-6では、図7-7の棒グラフを作成するための準備をしています。
ここでは、DataFrame(grp_df)のカラム「male, female」を横形式から縦形式に変換しています。
横形式から縦形式に変換するには、DataFrameの「melt()」メソッドを使用します。
ここではさらに、DataFrame(melted_df)に格納されている「gender」の値を
英語(male, female)から日本語(男性, 女性)に変換しています。
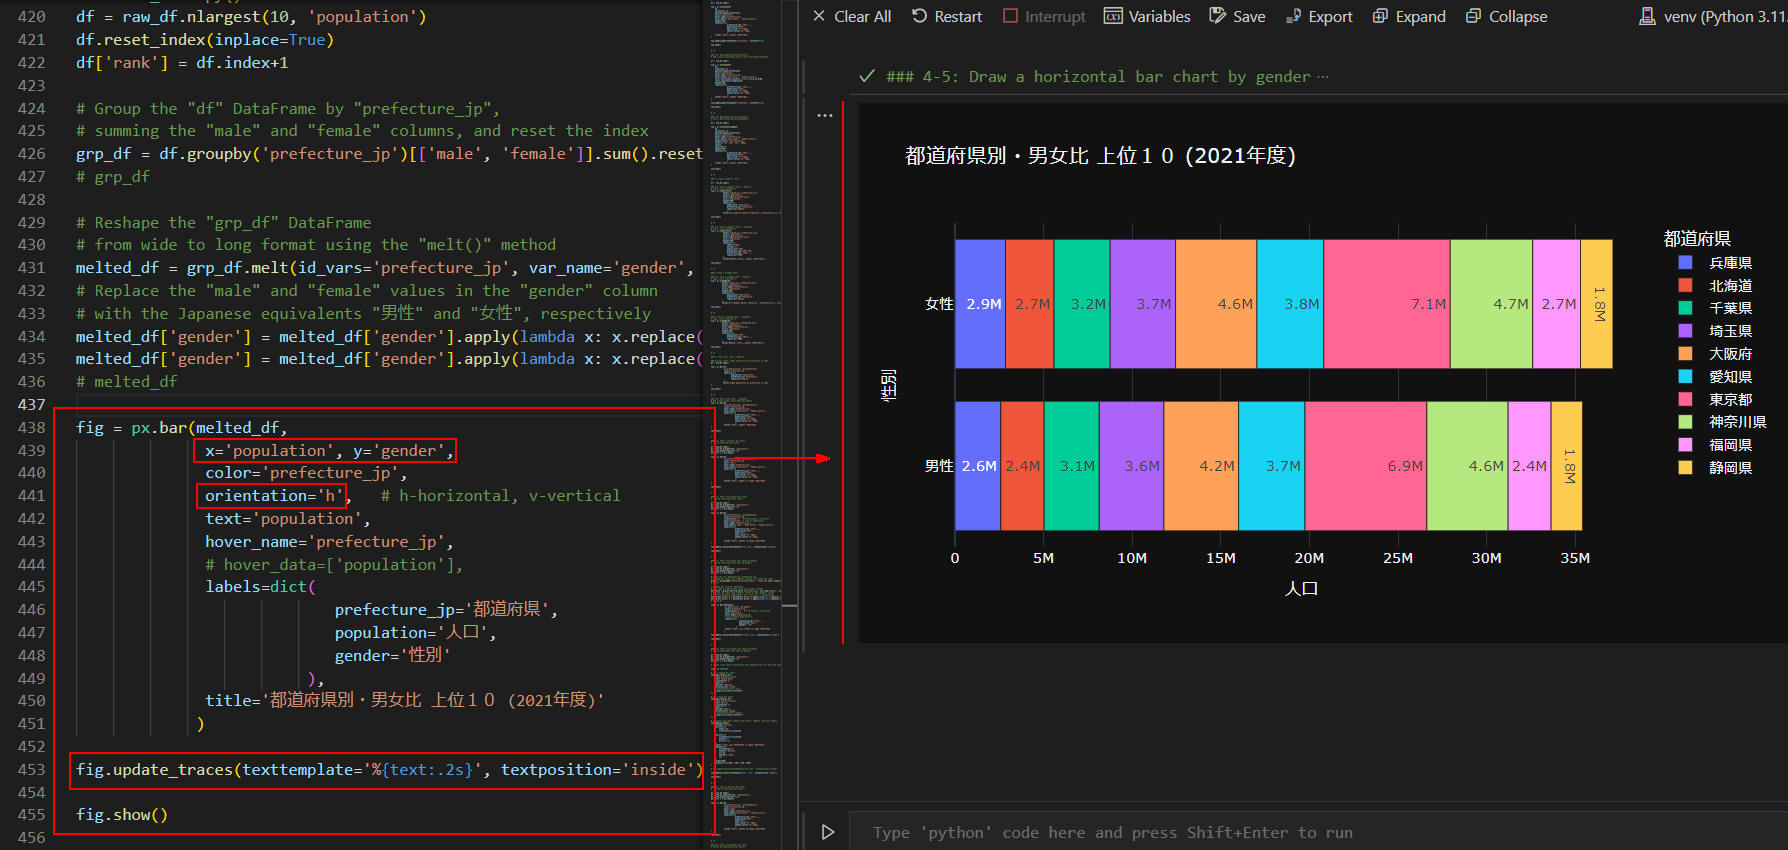 図7-7
図7-7では、上位10の都道府県の男女別の人口を水平形の棒グラフで表示しています。
棒グラフには、都道府県の男女の人口も表示されています。
この棒グラフからは、女性の人口が男性よりも多いことが分かります。
これは、女性の平均寿命が男性よりも長いのが要因と思われます。
図7-7
図7-7では、上位10の都道府県の男女別の人口を水平形の棒グラフで表示しています。
棒グラフには、都道府県の男女の人口も表示されています。
この棒グラフからは、女性の人口が男性よりも多いことが分かります。
これは、女性の平均寿命が男性よりも長いのが要因と思われます。
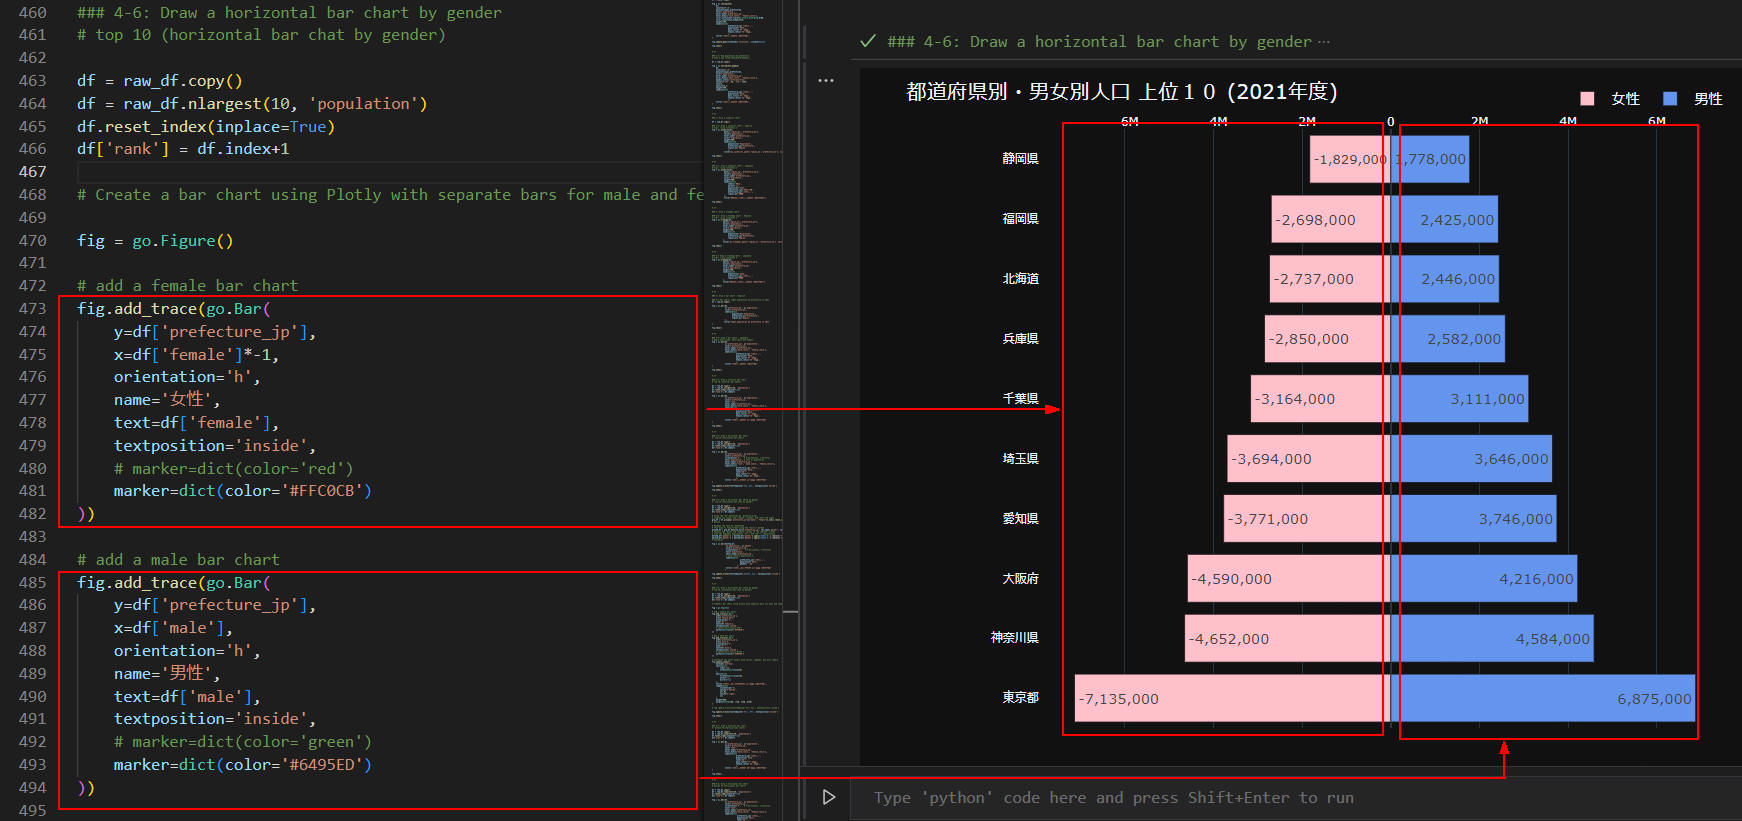 図7-8
図7-8では、上位10の都道府県の人口を男女別に水平形の棒グラフで表示しています。
棒グラフを左右対称に表示するには「女性」の人口を「マイナス」、
「男性」の人口を「プラス」にします。
これで左右対称の水平形棒グラフが作成できます。
なお、ここでは男女2種類のグラフを同じ図(Figure)に作成しているので、
Plotly Expressの代わりにPlotly Graph Objectsを使用しています。
図7-8
図7-8では、上位10の都道府県の人口を男女別に水平形の棒グラフで表示しています。
棒グラフを左右対称に表示するには「女性」の人口を「マイナス」、
「男性」の人口を「プラス」にします。
これで左右対称の水平形棒グラフが作成できます。
なお、ここでは男女2種類のグラフを同じ図(Figure)に作成しているので、
Plotly Expressの代わりにPlotly Graph Objectsを使用しています。
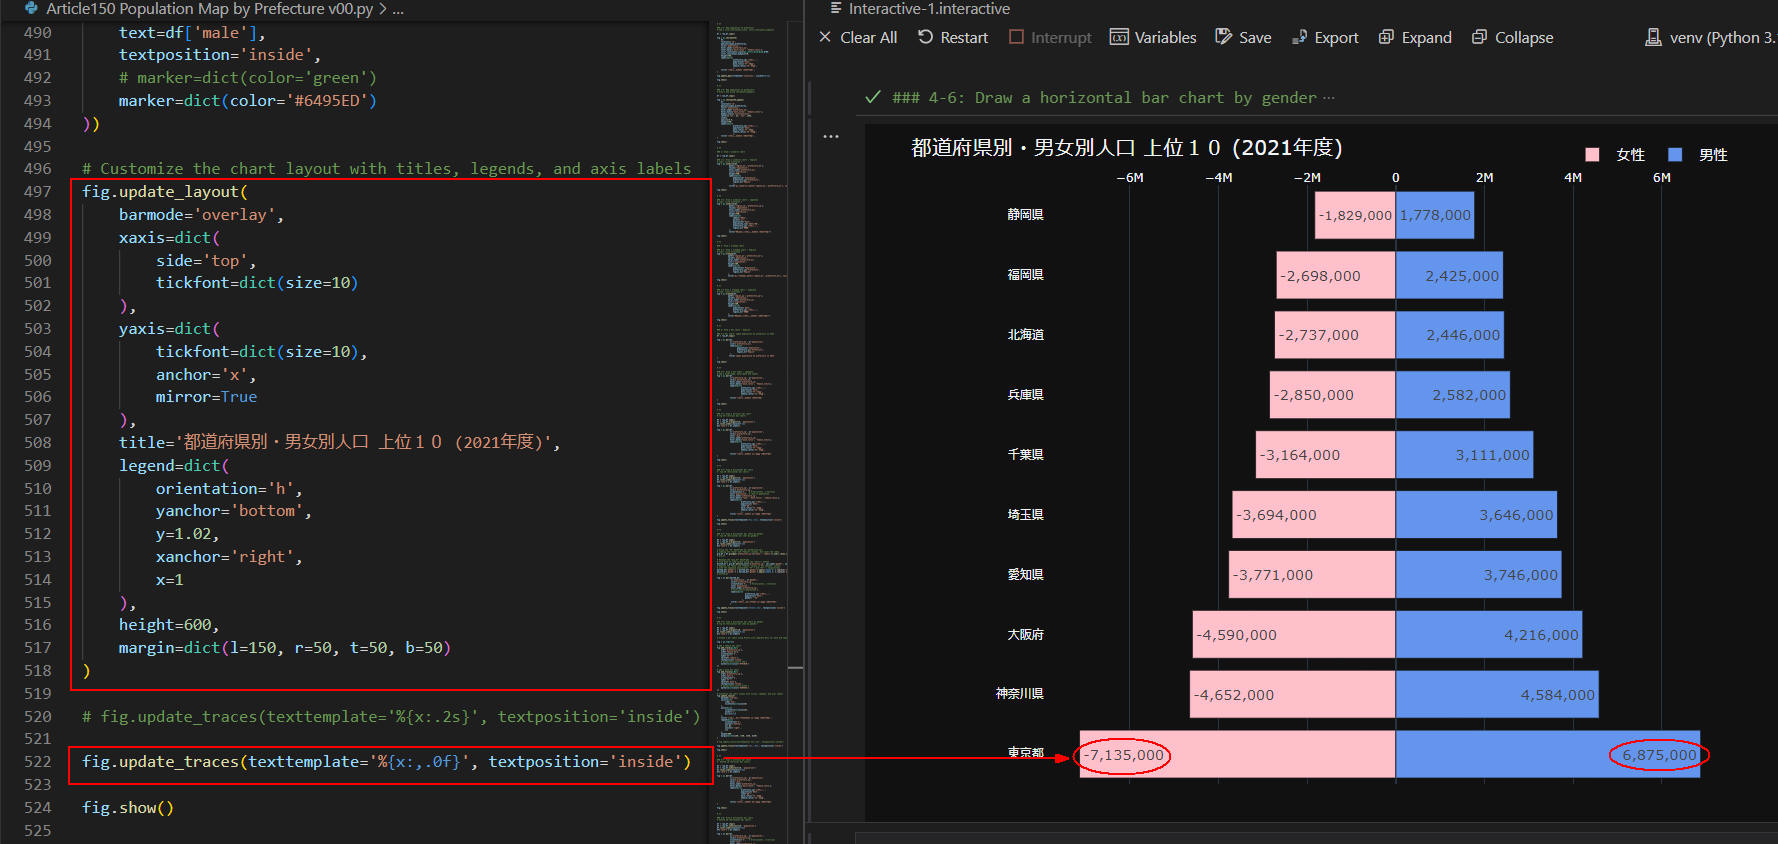 図7-9
棒グラフに人口も表示するには、
figureクラスの「update_traces()」メソッドを使用します。
前出の図7-8で説明したように女性の人口が「マイナス」、
男性の人口が「プラス」で表示されています。
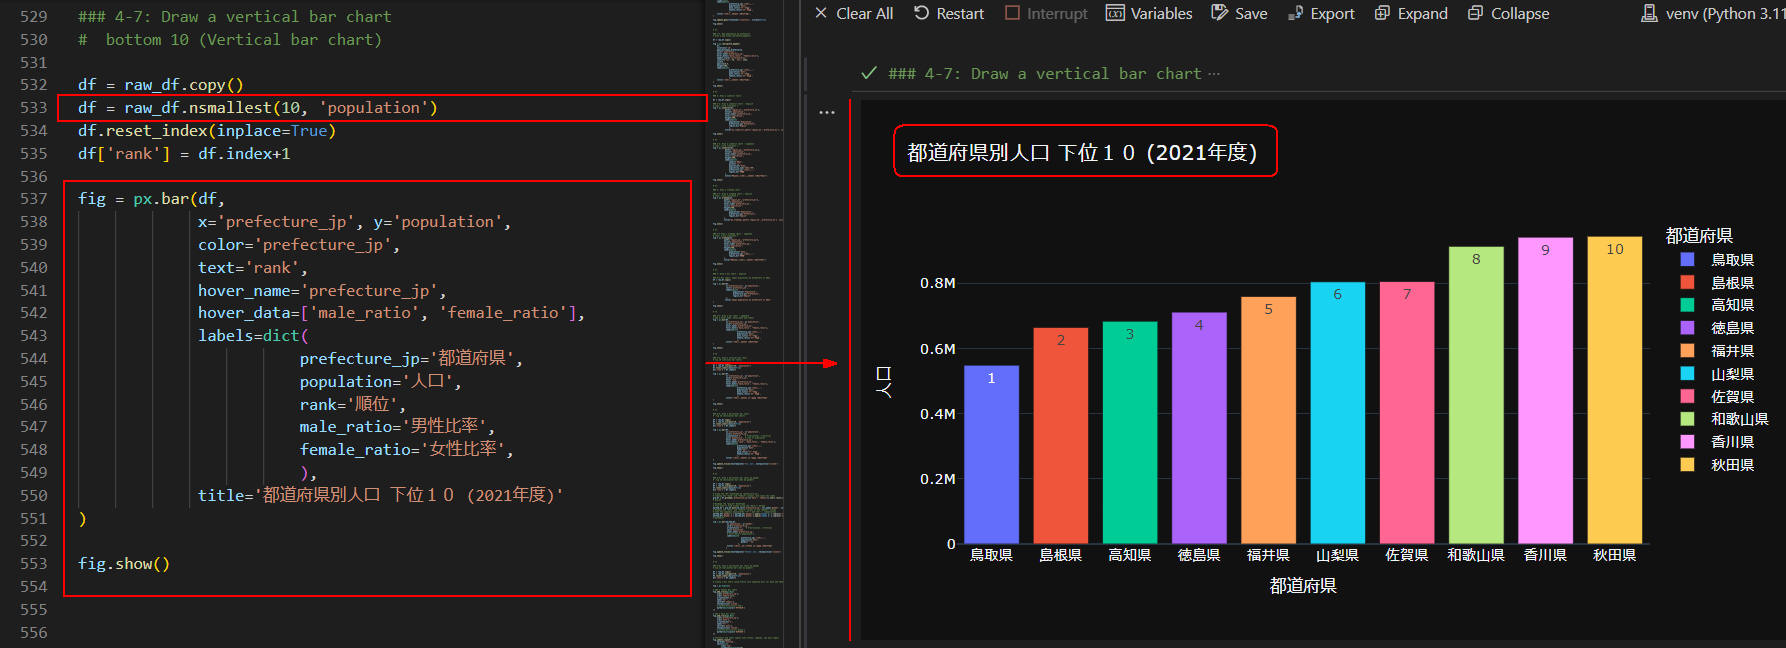 図7-10
図7-10では、人口の下位10の都道府県の棒グラフを表示しています。
ここでは縦型の棒グラフを作成しています。
下位10の都道府県を絞り込むには、
DataFrameの「nsmallest()」メソッドを使用します。
図7-10
図7-10では、人口の下位10の都道府県の棒グラフを表示しています。
ここでは縦型の棒グラフを作成しています。
下位10の都道府県を絞り込むには、
DataFrameの「nsmallest()」メソッドを使用します。
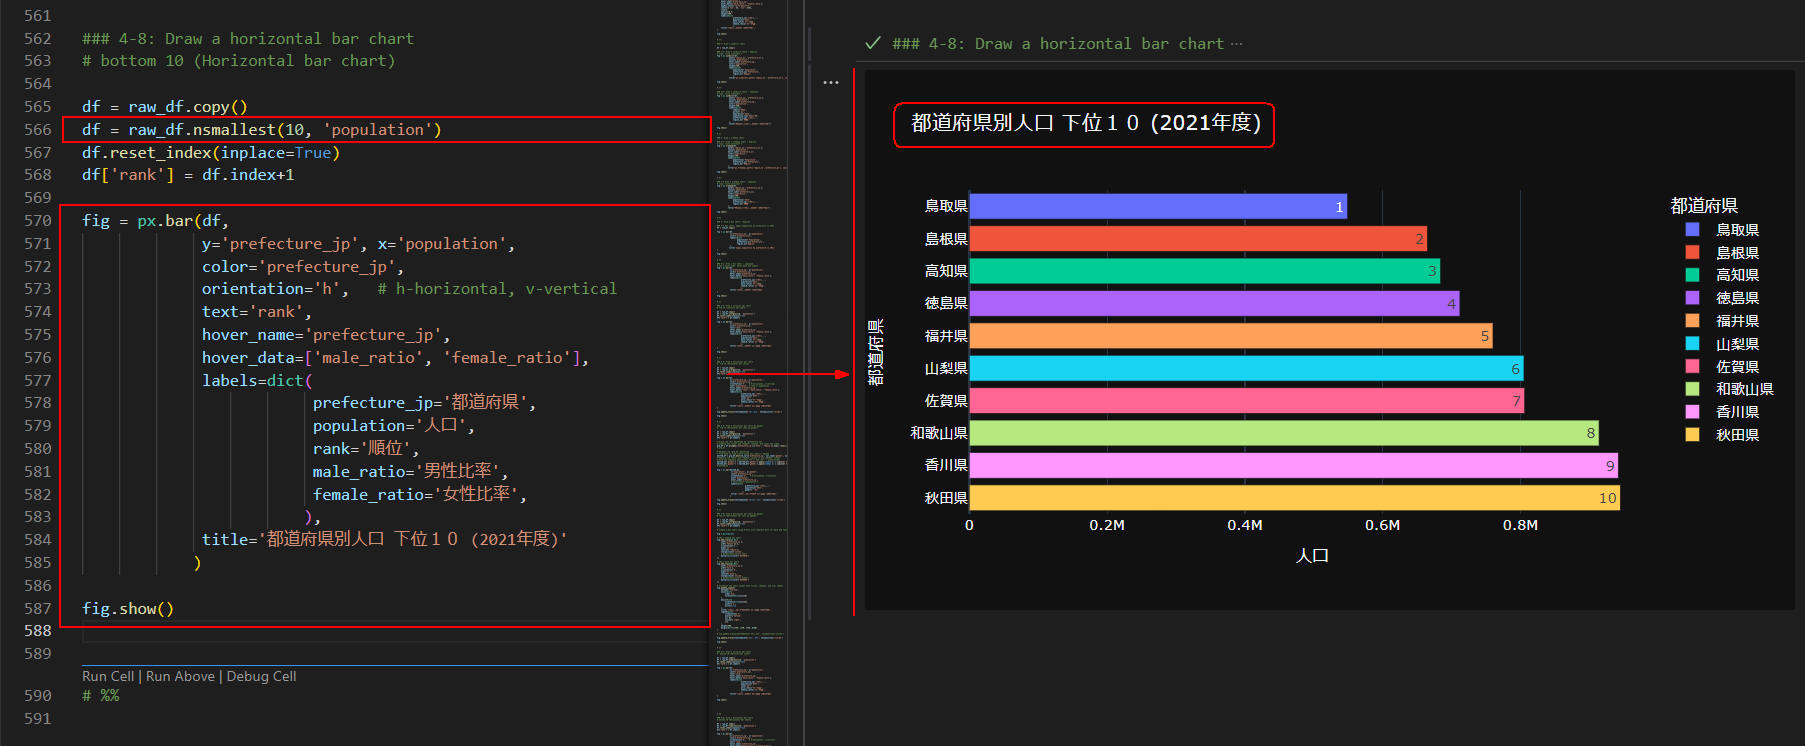 図7-11
図7-11では、前出(図7-10)の垂直型の棒グラフを水平型にしています。
図7-11
図7-11では、前出(図7-10)の垂直型の棒グラフを水平型にしています。
-
全てのコードを掲載
ここでは、本記事で解説している全てのコードを掲載しています。
リスト8-1: Article150.py
# Article150 Population Map by Prefecture v00.py

'''
References

https://www.e-stat.go.jp/

https://plotly.com/python/choropleth-maps/

https://plotly.com/python/colorscales/

https://www.mapbox.com/

https://plotly.com/python/mapbox-county-choropleth/

https://plotly.com/python/mapbox-layers/
'''

# %%

import json
import urllib.request
import numpy as np
import math
import pandas as pd
import plotly.io as pio
import plotly.express as px
import plotly.graph_objects as go


# %%

### 0: Prepare geojason / census data for analysis by cleaning and transforming the data

### 0-1: Read a GeoJson file

url = r'https://money-or-ikigai.com/Menu/Python/Article/data/map/prefectures.json'
response = urllib.request.urlopen(url)
geo_data = response.read().decode('utf-8')
japan_prefectures = json.loads(geo_data)
# json_file = 'data/json/prefectures.json'
# japan_prefectures = json.load(open(json_file, 'r'))
japan_prefectures


# %%

### 0-2: Load a prefecture id map dictionary from the geojson data
# Create an empty dictionary to store prefecture IDs
prefecture_id_map = {}

# Loop through the "features" list in the "japan_prefectures" dictionary
for feature in japan_prefectures['features']:
    feature['id'] = feature['properties']['pref']
    prefecture_id_map[feature['properties']['name']] = feature['id']

prefecture_id_map


# %%

### 0-3: Load Japan census data from a csv file

csv_file = r'https://money-or-ikigai.com/Menu/Python/Article/data/map/japan_census_all.csv'
# csv_file = 'data/csv/japan_census_all.csv'
df = pd.read_csv(csv_file)
# df.info()
# df
dfx = df.query("year == 2021")
dfx.shape   # (47, 5)


# %%

### 0-4: Load Japan geo data from a csv file

geo_csv = r'https://money-or-ikigai.com/Menu/Python/Article/data/map/japan_geo.csv'
# geo_csv = 'data/csv/japan_geo.csv'
geo_df = pd.read_csv(geo_csv)
geo_df


# %%

### 0-5: Filter columns from the pandas dataframe.

geo_df = geo_df[['region_en','region_jp','prefecture_en','prefecture_jp']]
geo_df


# %%

### 0-6: Concatenate the Japan census and geojason data horizontally based on the 'prefecture_jp' column

# Set the "prefecture_jp" column as the index for the "dfx" DataFrame
dfx.set_index('prefecture_jp', inplace=True)

# Set the "prefecture_jp" column as the index for the "geo_df" DataFrame
geo_df.set_index('prefecture_jp', inplace=True)

# Concatenate the "dfx" and "geo_df" DataFrames
# along the columns axis (axis=1) and store the result in "dfy"
dfy = pd.concat([dfx, geo_df], axis=1)
dfy


# %%

### 0-7: Add a new column 'id' into the dataframe.

# Create a new column named "id" in the "dfy" DataFrame
# by applying a lambda function to the "prefecture_en" column.
# The lambda function maps each prefecture name in the "prefecture_en" column
# to its corresponding ID in the "prefecture_id_map" dictionary.
# The resulting IDs are assigned to the "id" column
dfy['id'] = dfy['prefecture_en'].apply(lambda x: prefecture_id_map[x])
dfy


# %%

### 0-8: Calculate male/female ratios.

dfy.reset_index(inplace=True)

raw_df = dfy.copy()

raw_df['male_ratio'] = raw_df.apply(lambda row: round(row['male'] / row['population'],2), axis=1)
raw_df['female_ratio'] = raw_df.apply(lambda row: round(row['female'] / row['population'],2), axis=1)
raw_df['male_ratio_scale'] = np.log10(raw_df['male_ratio'])
raw_df


# %%

### 1: Map population

# set a defulat template
pio.templates.default = 'plotly_dark'

# Default template: 'plotly_dark'
# Available templates:
#     ['ggplot2', 'seaborn', 'simple_white', 'plotly',
#         'plotly_white', 'plotly_dark', 'presentation', 'xgridoff',
#         'ygridoff', 'gridon', 'none']

### 1-1: map population by prefecture

df = raw_df.copy()

fig = px.choropleth(
    df,
    locations='id',
    geojson=japan_prefectures,
    color='population',
    hover_name='prefecture_jp',
    hover_data=['male_ratio', 'female_ratio'],
    labels=dict(
                prefecture_jp='都道府県',
                population='人口',
                male_ratio='男性比率',
                female_ratio='女性比率',
                ),
    title='都道府県別人口 (2021年度)',
)

fig.update_geos(fitbounds='locations', visible=False)

fig.show()


# %%

### 1-2: Map population by prefecture
# add a color_continuous_scale, color_continuous_midpoint

df = raw_df.copy()

fig = px.choropleth(
    df,
    locations='id',
    geojson=japan_prefectures,
    color='population',
    hover_name='prefecture_jp',
    hover_data=['male_ratio', 'female_ratio'],
    color_continuous_scale=px.colors.diverging.BrBG,
    color_continuous_midpoint=0,
    labels=dict(
                prefecture_jp='都道府県',
                population='人口',
                male_ratio='男性比率',
                female_ratio='女性比率',
                ),
    title='都道府県別人口 (2021年度)',
)

fig.update_geos(fitbounds='locations', visible=False)

fig.show()


# %%

### 1-3: Map population by prefecture
# draw a map using choropleth_mapbox()

df = raw_df.copy()

fig = px.choropleth_mapbox(
    df,
    locations='id',
    geojson=japan_prefectures,
    color='population',
    hover_name='prefecture_jp',
    hover_data=['male_ratio', 'female_ratio'],
    mapbox_style='carto-positron',
    center={'lat': 35, 'lon': 139},
    zoom=3,
    opacity=0.5,
    labels=dict(
                prefecture_jp='都道府県',
                population='人口',
                male_ratio='男性比率',
                female_ratio='女性比率',
                ),
    title='都道府県別人口 (2021年度)',
)

fig.show()


# %%

### 2: Draw a sunburst chart

df = raw_df.copy()

### 2-1: Draw a sunburst chart : English
# tips: click continent ★
fig = px.sunburst(df,
            path=['region_en','prefecture_en'],
            values='population',
            hover_name='prefecture_jp',
            color='population',
            height=700,
            labels=dict(
                population='Population',
                prefecture_jp='Prefecture',
                region_en='Region'
                ),
            title="px.sunburst(,path=['region_en','prefecture_en'], values='population', color='population')")

fig.show()


# %%

### 2-2: Draw a sunburst chart : Japanese
# tips: click continent ★
fig = px.sunburst(df,
            path=['region_jp','prefecture_jp'],
            values='population',
            hover_name='prefecture_jp',
            color='population',
            height=700,
            labels=dict(
                labels='地方',
                parent='親',
                population='人口',
                population_sum='人口総数',
                prefecture_jp='都道府県',
                region_en='地域'
            ),
            title="地方別・都道府県別人口 (2021年度)")

fig.show()

# %%

### 3: Draw a treemap chart

### 3-1: Draw a treemap chart : English
# tips: click continent ★
fig = px.treemap(df,
           path=['region_en','prefecture_en'],
           values='population',
           hover_name='prefecture_en',
           color='population',
           height=700,
           labels=dict(
                population='Population',
                prefecture_jp='Prefecture',
                region_en='Region'
           ),
           title="px.treemap(,path=['region_en','prefecture_en'], values='population', color='population')")

fig.show()


# %%

### 3-2 Draw a treemap chart : Japanese
# tips: click continent ★
fig = px.treemap(df,
           path=['region_jp','prefecture_jp'],
           values='population',
           hover_name='prefecture_jp',
           color='population',
           height=700,
           labels=dict(
                population='人口',
                prefecture_jp='都道府県',
                region_en='地域'
           ),
           title="地方別・都道府県別人口 (2021年度)")

fig.show()

# %%

### 4: Draw a bar chart : English

### 4-1 bar chart: Japan population by prefecture in 2021
df = raw_df.copy()

fig = px.bar(df,
             x='prefecture_en', y='population',
             color='prefecture_en',
             labels=dict(
                    population='Population',
                    prefecture_en='Prefecture',
                    region_en='Region'
             ),
            title='Japan population by prefecture in 2021'
)

fig.show()


# %%

### 4-2: Draw a bar chart : Japanese
# add a hover_name, hover_data and labels
fig = px.bar(df,
             x='prefecture_jp', y='population',
             color='prefecture_jp',
             hover_name='prefecture_jp',
             hover_data=['male_ratio', 'female_ratio'],
             labels=dict(
                        prefecture_jp='都道府県',
                        population='人口',
                        male_ratio='男性比率',
                        female_ratio='女性比率',
                        ),
             title='都道府県別人口 (2021年度)'
)

fig.show()


# %%

### 4-3: Draw a vertical bar chart
# top 10 (vertical bar chart)

df = raw_df.copy()
df = df.nlargest(10, 'population')
df.reset_index(inplace=True)
df['rank'] = df.index+1

fig = px.bar(df,
             x='prefecture_jp', y='population',
             color='prefecture_jp',
             text='rank',
             hover_name='prefecture_jp',
             hover_data=['male_ratio', 'female_ratio'],
             labels=dict(
                        prefecture_jp='都道府県',
                        population='人口',
                        male_ratio='男性比率',
                        female_ratio='女性比率',
                        ),
             title='都道府県別人口 上位10 (2021年度)'
)

fig.show()


# %%

### 4-4: Draw a horizontal bar chart
#  top 10 (horizontal bar chart)

df = raw_df.copy()
df = df.nlargest(10, 'population')
df.reset_index(inplace=True)
df['rank'] = df.index+1

fig = px.bar(df,
             y='prefecture_jp', x='population',
             color='prefecture_jp',
             orientation='h',   # h-horizontal, v-vertical
             text='population', # rank or population
             hover_name='prefecture_jp',
             hover_data=['rank', 'male_ratio', 'female_ratio'],
             labels=dict(
                        prefecture_jp='都道府県',
                        population='人口',
                        rank='順位',
                        male_ratio='男性比率',
                        female_ratio='女性比率',
                        ),
             title='都道府県別人口 上位10 (2021年度)'
)

fig.update_traces(texttemplate='%{x:.2s}', textposition='inside')

fig.show()


# %%

### 4-5: Draw a horizontal bar chart by gender
#  top 10 (horizontal bar chat by gender)

df = raw_df.copy()
df = df.nlargest(10, 'population')
df.reset_index(inplace=True)
df['rank'] = df.index+1

# Group the "df" DataFrame by "prefecture_jp",
# summing the "male" and "female" columns, and reset the index
grp_df = df.groupby('prefecture_jp')[['male', 'female']].sum().reset_index()

# Reshape the "grp_df" DataFrame
# from wide to long format using the "melt()" method
melted_df = grp_df.melt(id_vars='prefecture_jp', var_name='gender', value_name='population')

# Replace the "male" and "female" values in the "gender" column
# with the Japanese equivalents "男性" and "女性", respectively
melted_df['gender'] = melted_df['gender'].apply(lambda x: x.replace('female','女性'))
melted_df['gender'] = melted_df['gender'].apply(lambda x: x.replace('male','男性'))

fig = px.bar(melted_df,
              x='population', y='gender',
              color='prefecture_jp',
              orientation='h',   # h-horizontal, v-vertical
              text='population',
              hover_name='prefecture_jp',
              # hover_data=['population'],
              labels=dict(
                            prefecture_jp='都道府県',
                            population='人口',
                            gender='性別'
                         ),
              title='都道府県別・男女比 上位10 (2021年度)'
             )

fig.update_traces(texttemplate='%{text:.2s}', textposition='inside')

fig.show()


# %%

### 4-6: Draw a horizontal bar chart by gender
# top 10 (horizontal bar chat by gender)

df = raw_df.copy()
df = df.nlargest(10, 'population')
df.reset_index(inplace=True)
df['rank'] = df.index+1

# Create a bar chart using Plotly with separate bars for male and female populations

fig = go.Figure()

# add a female bar chart
fig.add_trace(go.Bar(
    y=df['prefecture_jp'],
    x=df['female']*-1,
    orientation='h',
    name='女性',
    text=df['female'],
    textposition='inside',
    # marker=dict(color='red')
    marker=dict(color='#FFC0CB')
))

# add a male bar chart
fig.add_trace(go.Bar(
    y=df['prefecture_jp'],
    x=df['male'],
    orientation='h',
    name='男性',
    text=df['male'],
    textposition='inside',
    # marker=dict(color='green')
    marker=dict(color='#6495ED')
))

# Customize the chart layout with titles, legends, and axis labels
fig.update_layout(
    barmode='overlay',
    xaxis=dict(
        side='top',
        tickfont=dict(size=10)
    ),
    yaxis=dict(
        tickfont=dict(size=10),
        anchor='x',
        mirror=True
    ),
    title='都道府県別・男女別人口 上位10 (2021年度)',
    legend=dict(
        orientation='h',
        yanchor='bottom',
        y=1.02,
        xanchor='right',
        x=1
    ),
    height=600,
    margin=dict(l=150, r=50, t=50, b=50)
)

# fig.update_traces(texttemplate='%{x:.2s}', textposition='inside')

fig.update_traces(texttemplate='%{x:,.0f}', textposition='inside')

fig.show()


# %%

### 4-7: Draw a vertical bar chart
#  bottom 10 (Vertical bar chart)

df = raw_df.copy()
df = df.nsmallest(10, 'population')
df.reset_index(inplace=True)
df['rank'] = df.index+1

fig = px.bar(df,
             x='prefecture_jp', y='population',
             color='prefecture_jp',
             text='rank',
             hover_name='prefecture_jp',
             hover_data=['male_ratio', 'female_ratio'],
             labels=dict(
                        prefecture_jp='都道府県',
                        population='人口',
                        rank='順位',
                        male_ratio='男性比率',
                        female_ratio='女性比率',
                        ),
             title='都道府県別人口 下位10 (2021年度)'
)

fig.show()


# %%

### 4-8: Draw a horizontal bar chart
# bottom 10 (Horizontal bar chart)

df = raw_df.copy()
df = df.nsmallest(10, 'population')
df.reset_index(inplace=True)
df['rank'] = df.index+1

fig = px.bar(df,
             y='prefecture_jp', x='population',
             color='prefecture_jp',
             orientation='h',   # h-horizontal, v-vertical
             text='rank',
             hover_name='prefecture_jp',
             hover_data=['male_ratio', 'female_ratio'],
             labels=dict(
                         prefecture_jp='都道府県',
                         population='人口',
                         rank='順位',
                         male_ratio='男性比率',
                         female_ratio='女性比率',
                        ),
             title='都道府県別人口 下位10 (2021年度)'
            )

fig.show()