-
まずは、Pythonの開発環境を準備する
まずは、
「記事(Article137)」を参照して、
Pythonの開発環境を準備してください。
ここでは、Pythonのプロジェクトフォルダとして「Plotly」を使用しています。
 図1
図1は、Visual Studio Code(VS Code)の「Terminal」メニューから「New Terminal」を選択して、
「Terminal」ウィンドウを開いたときの画面です。
緑色の「(venv)」が表示されていれば、 Pythonの仮想環境が正常に作成されていることになります。
図1
図1は、Visual Studio Code(VS Code)の「Terminal」メニューから「New Terminal」を選択して、
「Terminal」ウィンドウを開いたときの画面です。
緑色の「(venv)」が表示されていれば、 Pythonの仮想環境が正常に作成されていることになります。
-
Visual Studio Codeを起動してプログラムファイルを作成する
Pythonの開発環境の準備が完了したら、 VS Codeを起動して新規のPythonファイル(*.py)を作成します。
ここで作成したPythonのファイルには「リスト6-1」のコードをコピペします。
 図2
図2は、VS Codeの画面です。
図2
図2は、VS Codeの画面です。
-
日本の年齢別人口データを分析(可視化)するためのデータを用意する
ここでは、総務省統計局のWebサイトからダウンロードした
年齢別人口データを加工してPlotly Expressで分析するためのデータを用意します。
### 0: Prepare data

# 0-1: read a population data from a csv file
csv_file = r'https://money-or-ikigai.com/Menu/Python/Article/data/map/japan_population_by_age(2021).csv'
# csv_file = 'datasets/csv/japan_population_by_age(2021).csv'
df = pd.read_csv(csv_file)
# df.info()
# df


# %%

# 0-2: update the population columns (population, male, female)
pd.options.mode.chained_assignment = None

dfx = df[['year','age','population','male','female','ratio']]

dfx.loc[:, 'population'] = dfx['population'].apply(lambda x: x * 1000)
dfx.loc[:, 'male'] = dfx['male'].apply(lambda x: x * 1000)
dfx.loc[:, 'female'] = dfx['female'].apply(lambda x: x * 1000)
raw_df = dfx.copy()
# raw_df.info()
# raw_df
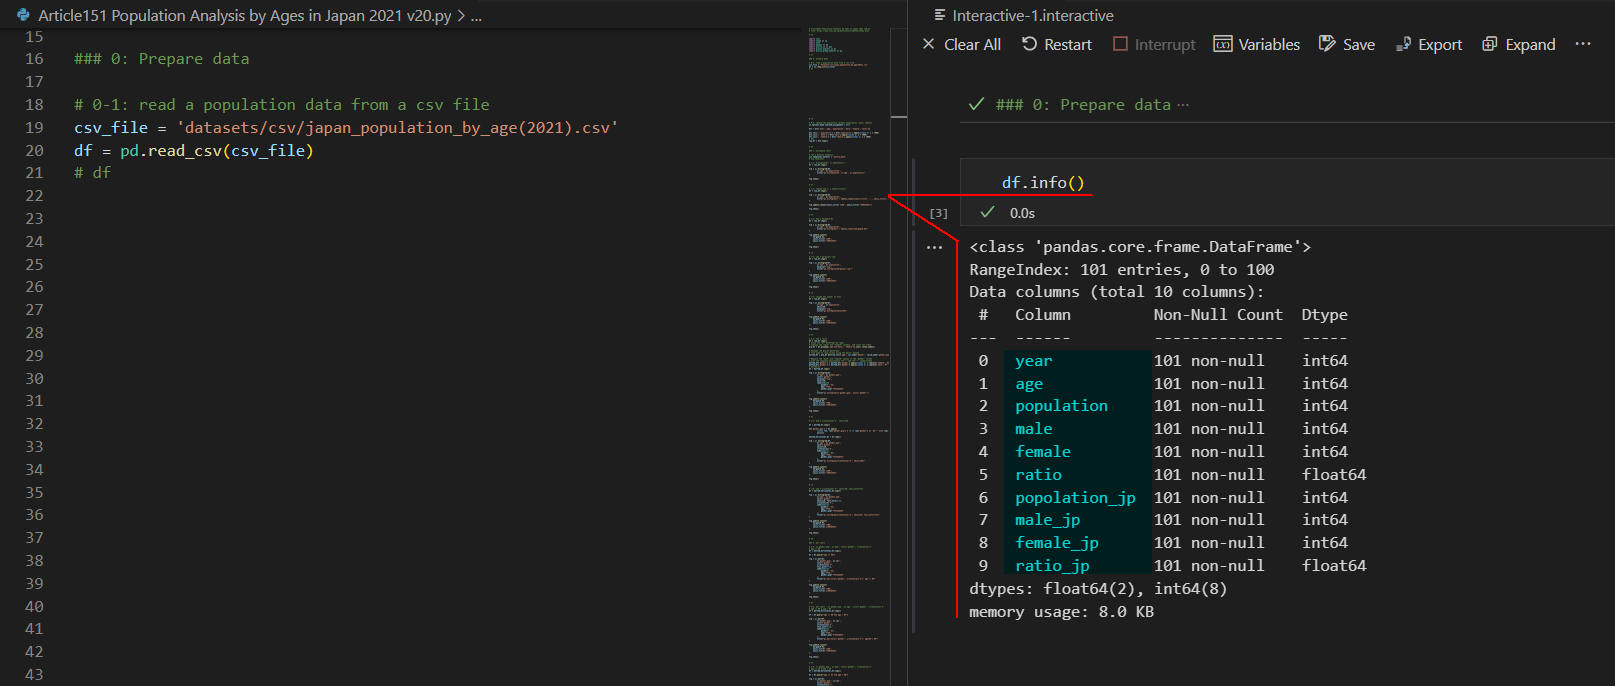 図3-1
図3-1では、年齢別人口データが格納されているPandas DataFrameの構造を表示しています。
DataFrameは「year, age, population, male, female, reaito,..」等のカラム(列)から構成されています。
カラム「???_jp」には、日本国籍の年齢別人口が格納されています。
ここでは、総人口を使用します。
図3-1
図3-1では、年齢別人口データが格納されているPandas DataFrameの構造を表示しています。
DataFrameは「year, age, population, male, female, reaito,..」等のカラム(列)から構成されています。
カラム「???_jp」には、日本国籍の年齢別人口が格納されています。
ここでは、総人口を使用します。
 図3-2
図3-2では、DataFrameの内容を表示しています。
カラム「year」には、人口の年度が格納されています。
カラム「age」には年齢が格納されています。
カラム「population, male, female」には年齢別の人口が1000人の単位で格納されています。
なお、年齢「100歳」には、100歳以上の人も含まれます。
図3-2
図3-2では、DataFrameの内容を表示しています。
カラム「year」には、人口の年度が格納されています。
カラム「age」には年齢が格納されています。
カラム「population, male, female」には年齢別の人口が1000人の単位で格納されています。
なお、年齢「100歳」には、100歳以上の人も含まれます。
 図3-3
図3-3では、前出(図3-2)のDataFrameの内容を加工して新規のDataFrame(raw_df)を作成しています。
図3-3では、DaraFrame(raw_df)の構造を表示しています。
図3-3
図3-3では、前出(図3-2)のDataFrameの内容を加工して新規のDataFrame(raw_df)を作成しています。
図3-3では、DaraFrame(raw_df)の構造を表示しています。
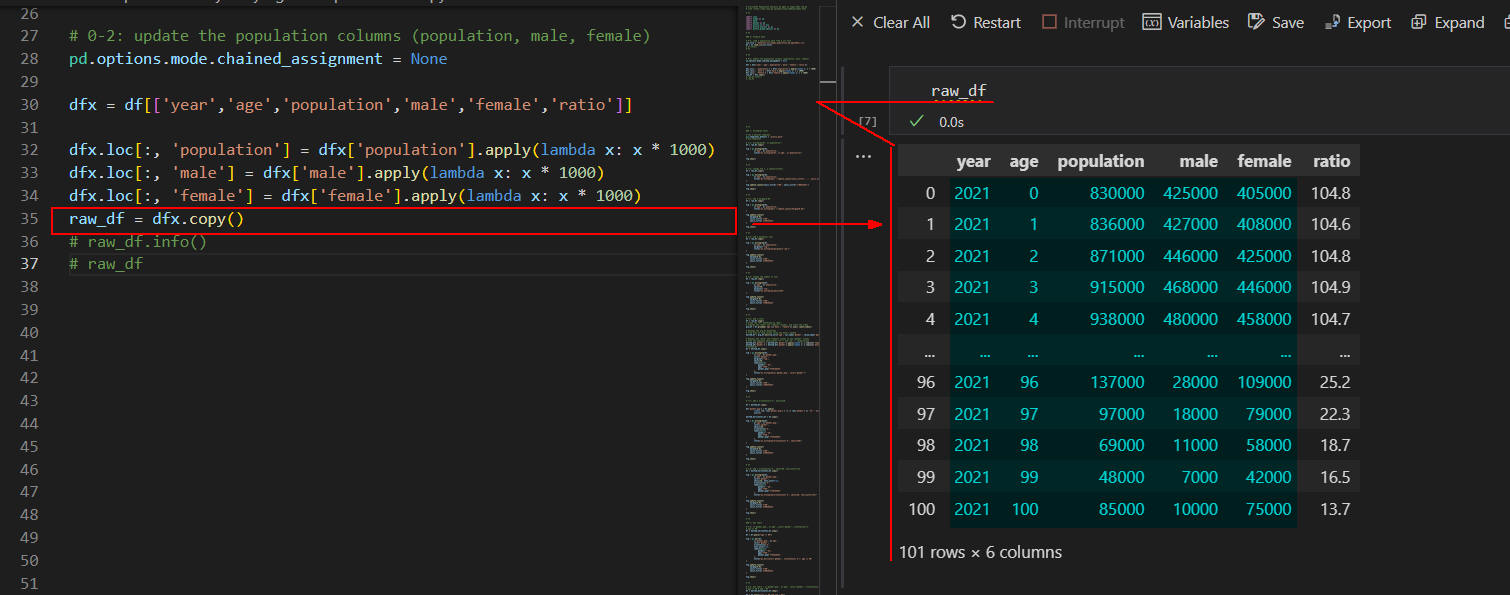 図3-4
図3-4では、DataFrame(raw_df)の内容を表示しています。
カラム「population, male, female」には、1000倍した人口が格納されています。
つまり、実際の人口(人数)になります。
図3-4
図3-4では、DataFrame(raw_df)の内容を表示しています。
カラム「population, male, female」には、1000倍した人口が格納されています。
つまり、実際の人口(人数)になります。
-
Plotly ExpressのHistogram(ヒストグラム)で年齢別人口データを分析(可視化)する
ここでは、Plotly Expressのヒストグラムで年齢別人口データを可視化します。
### 1: histogram chart

# set a defulat template
pio.templates.default = 'plotly_dark'
# pio.templates

# 1-1: histogram(df, x='population')
df = raw_df.copy()

fig = px.histogram(df,
        x='age', y='population',
        title="px.histogram(df, x='age', y='population)"
)

fig.show()


# %%

# 1-2: change the x, y lables(titles)
df = raw_df.copy()

fig = px.histogram(df,
        x='age', y='population',
        title="px.histogram() + update_layout(xaxis_title='...', yaxis_title='...') "
)

fig.update_layout(xaxis_title='世代', yaxis_title='世代別人口')

fig.show()


# %%

# 1-3: add a bargap=0.02
df = raw_df.copy()

fig = px.histogram(df,
        x='age', y='population',
        title="px.histogram() + update_layout(bargap=0.02)"
)

fig.update_layout(
    bargap=0.02,
    xaxis_title='世代',
    yaxis_title='世代別人口'
)

fig.show()


# %%

# 1-4: add a marginal='rug'
df = raw_df.copy()

fig = px.histogram(df,
        x='age', y='population',
        marginal='rug',
        title="px.histogram(marginal='rug')"
)

fig.update_layout(
    bargap=0.02,
    xaxis_title='世代',
    yaxis_title='世代別人口'
)

fig.show()


# %%

# 1-5: change the number of bins
df = raw_df.copy()

fig = px.histogram(df,
        x='age', y='population',
        nbins=40,
        marginal='rug',
        title="px.histogram(nbins=40)"
)

fig.update_layout(
    bargap=0.02,
    xaxis_title='世代',
    yaxis_title='世代別人口'
)

fig.show()


# %%

# 1-6: add a color
df = raw_df.copy()
# Group the "df" DataFrame by "age",
# summing the "male" and "female" columns, and reset the index
grp_df = df.groupby('age')[['male', 'female']].sum().reset_index()

# Reshape the grp_df DataFrame
# from wide to long format using the melt() method
melted_df = grp_df.melt(id_vars='age', var_name='gender', value_name='gender_pop')

# Replace the "male" and "female" values in the "gender" column
# with the Japanese equivalents "男性" and "女性", respectively
melted_df['gender'] = melted_df['gender'].apply(lambda x: x.replace('female','女性'))
melted_df['gender'] = melted_df['gender'].apply(lambda x: x.replace('male','男性'))
# melted_df
df = melted_df.copy()

fig = px.histogram(df,
        x='age', y='gender_pop',
        color='gender',
        marginal='rug',
        nbins=40,
        labels=dict(
            gender='性別',
            age='年齢',
            gender_pop='男女別人口'
        ),
        title="px.histogram(y='gender_pop', color='gender')"
)

fig.update_layout(
    bargap=0.02,
    xaxis_title='世代',
    yaxis_title='世代別人口'
)

fig.show()


# %%

# 1-7: add a orientation='h', nbins=120

df = melted_df.copy()

df['gender_pop'] = df.apply(
        lambda row: row['gender_pop'] * -1 if row['gender'] == '女性' else row['gender_pop'],
        axis=1)

melted_horizontal_df = df.copy()

fig = px.histogram(df,
        y='age', x='gender_pop',
        color='gender',
        nbins=120,
        orientation='h',
        labels=dict(
            gender='性別',
            age='年齢',
            gender_pop='男女別人口'
        ),
        title="px.histogram(orientation='h', nbins=120)"
)

fig.update_layout(
    bargap=0.02,
    yaxis_title='世代',
    xaxis_title='世代別人口'
)

fig.show()


# %%

# 1-8: add a orientation='h', nbins=20, text_auto=True
df = melted_horizontal_df.copy()

fig = px.histogram(df,
        y='age', x='gender_pop',
        color='gender',
        nbins=20,
        text_auto=True,
        orientation='h',
        labels=dict(
            gender='性別',
            age='年齢',
            gender_pop='男女別人口'
        ),
        title="px.histogram(orientation='h', nbins=20, text_auto=True)"
)

fig.update_layout(
    bargap=0.02,
    yaxis_title='世代',
    xaxis_title='世代別人口'
)

fig.show()
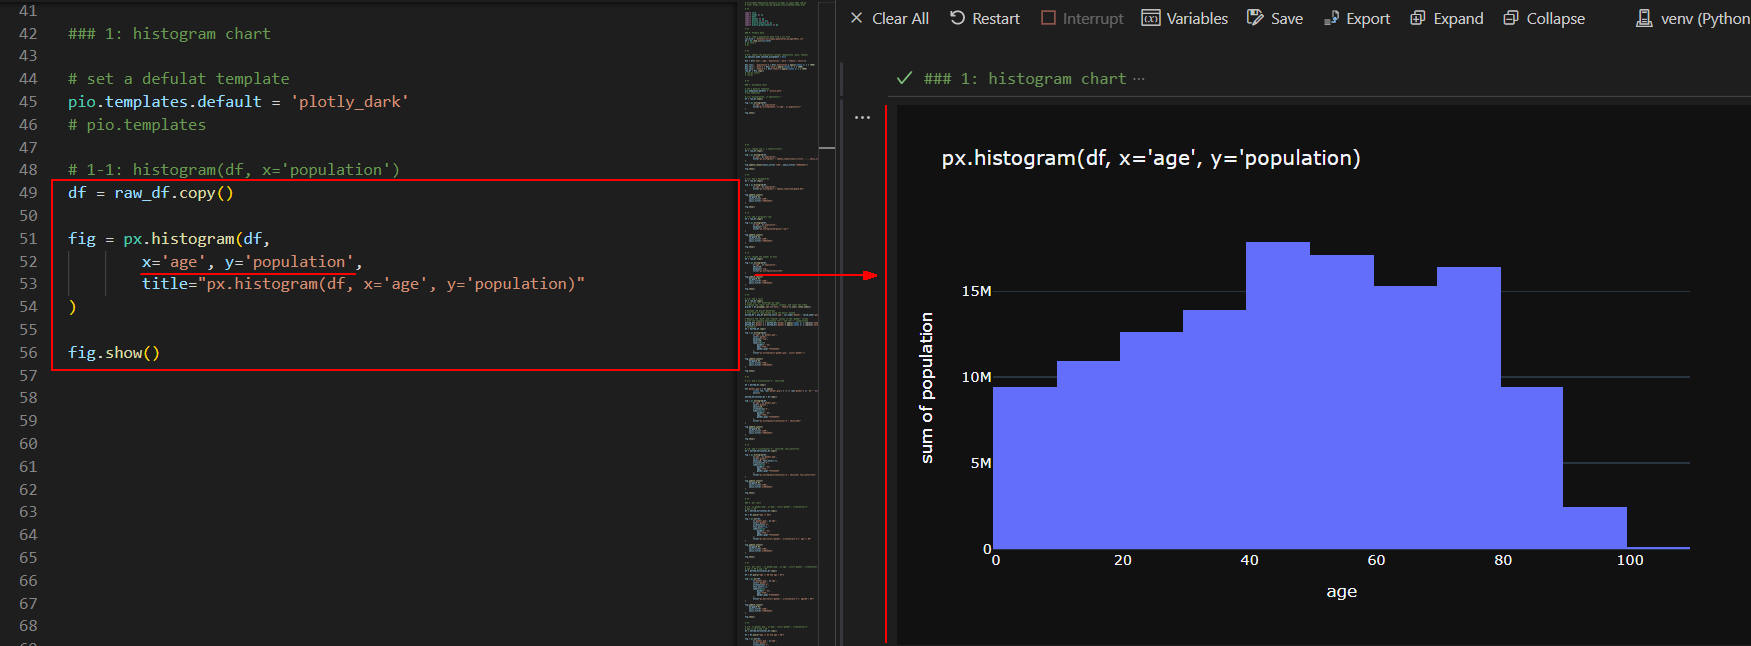 図4-1
図4-1では、Plotly Expressの「histogram()」メソッドで世代別の人口を表示しています。
図4-1
図4-1では、Plotly Expressの「histogram()」メソッドで世代別の人口を表示しています。
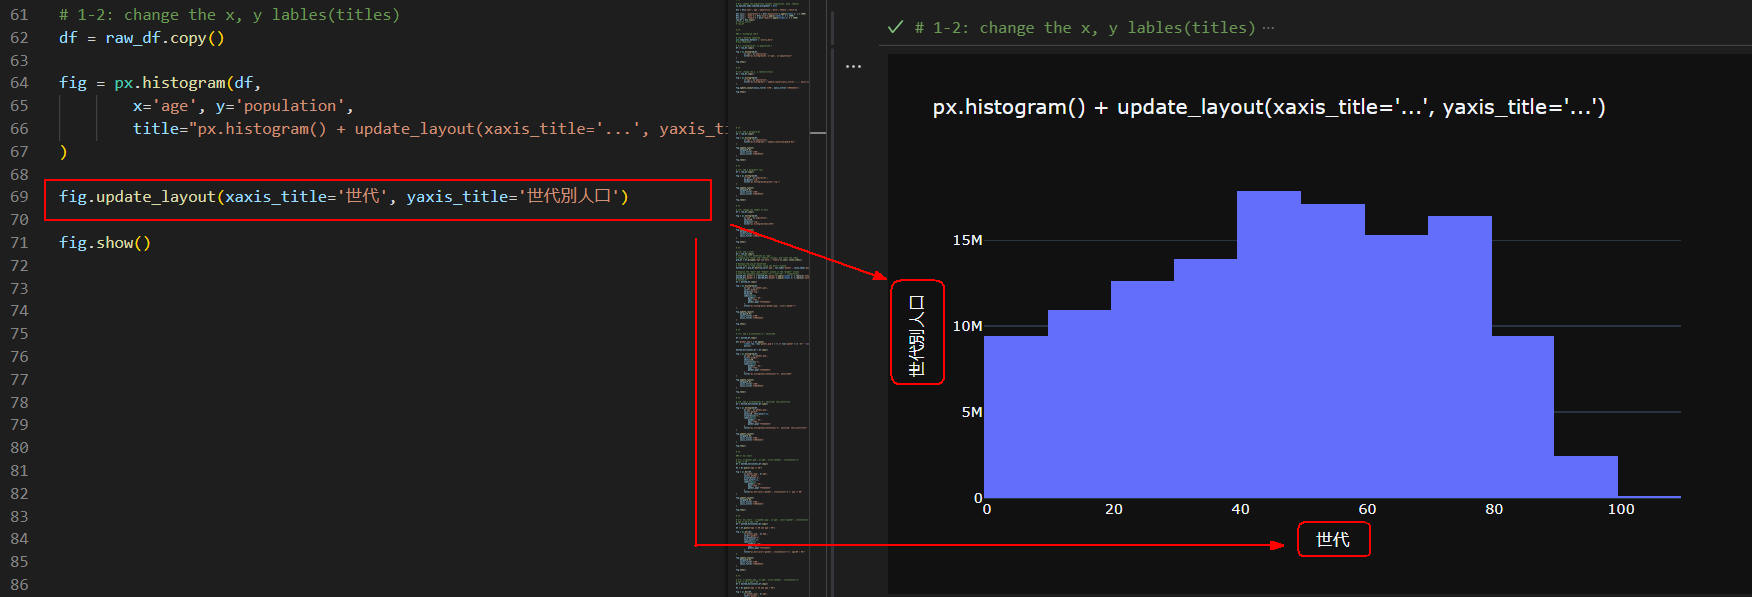 図4-2
図4-2では、Plotly ExpressのヒストグラムのX軸、Y軸のラベル(タイトル)を日本語に書き換えています。
X軸、Y軸のラベルを書き換えるには、
figureクラスの「update_layout()」メソッドを使用します。
図4-2
図4-2では、Plotly ExpressのヒストグラムのX軸、Y軸のラベル(タイトル)を日本語に書き換えています。
X軸、Y軸のラベルを書き換えるには、
figureクラスの「update_layout()」メソッドを使用します。
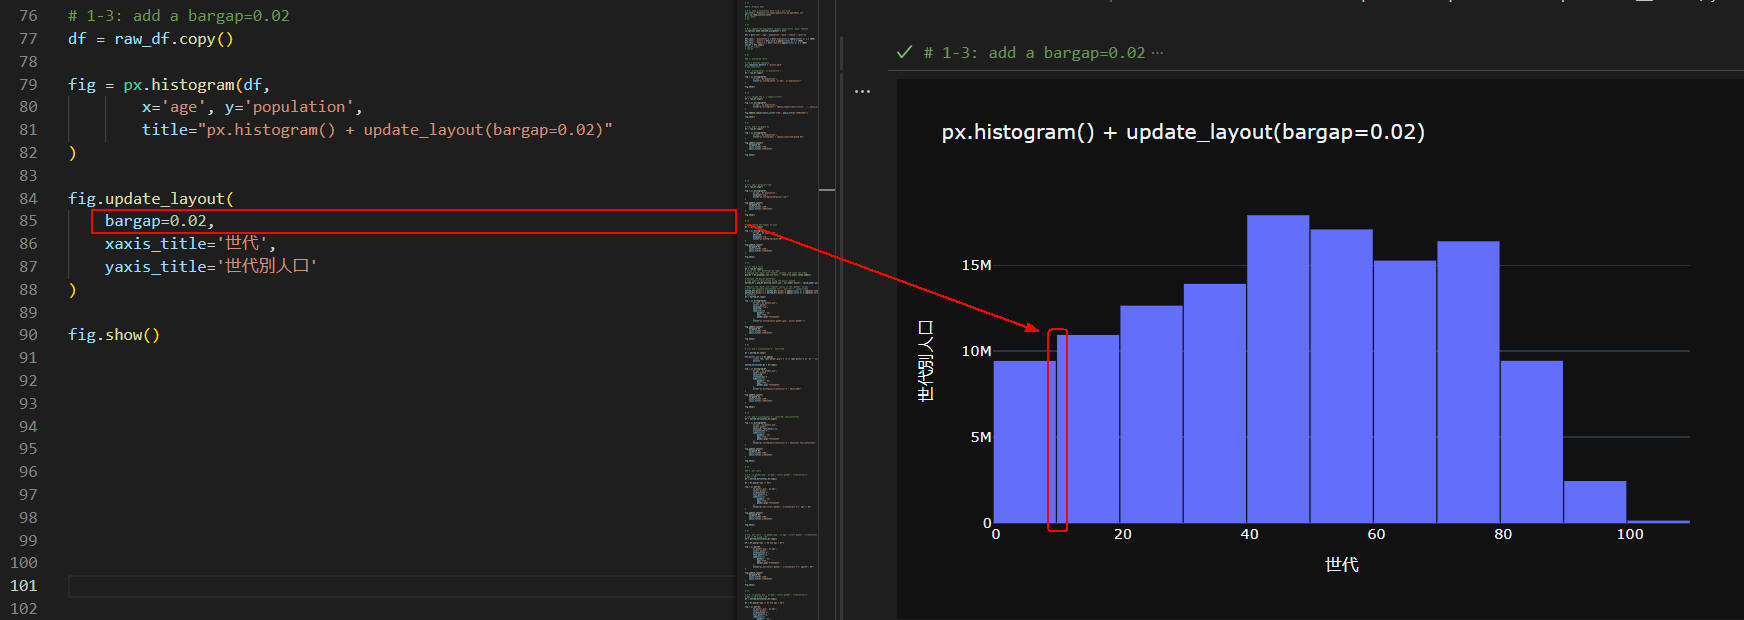 図4-3
図4-3では、figureクラスの「update_layout()」メソッドの引数に
「bargap=0.02」を追加して棒グラフの間にギャップ(隙間)を挿入しています。
これで棒グラフが見やすくなります。
図4-3
図4-3では、figureクラスの「update_layout()」メソッドの引数に
「bargap=0.02」を追加して棒グラフの間にギャップ(隙間)を挿入しています。
これで棒グラフが見やすくなります。
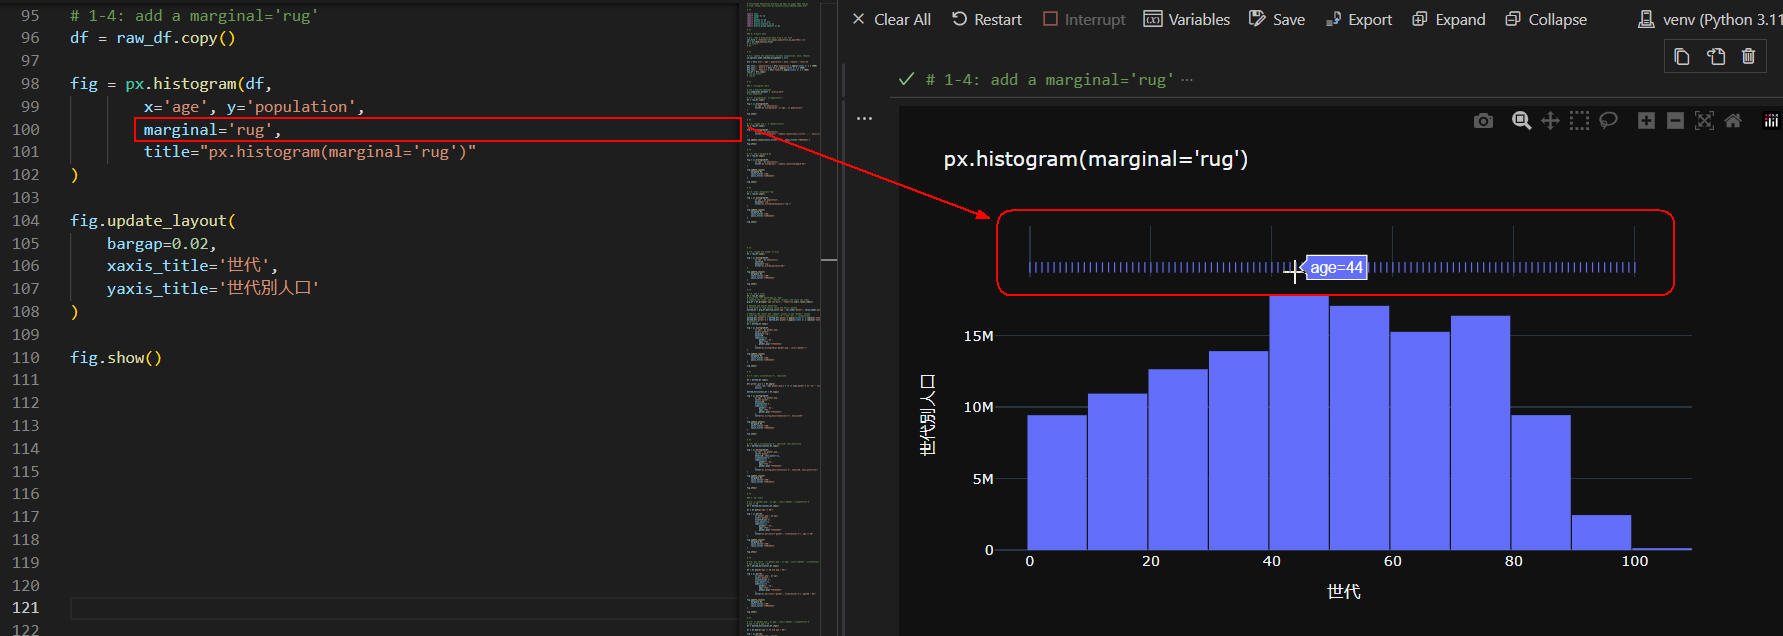 図4-4
図4-4では、Plotly Expressの「histogram()」メソッドの引数に
「 marginal='rug'」を追加しています。
このオプションを追加すると、
X軸やY軸に対応するデータ点の小さな線(ラグ)を表示することができます。
ラグにマウスをホバリングさせると、
ホバーテキストに「年齢」が表示されます。
ここでは「age=44」が表示されています。
図4-4
図4-4では、Plotly Expressの「histogram()」メソッドの引数に
「 marginal='rug'」を追加しています。
このオプションを追加すると、
X軸やY軸に対応するデータ点の小さな線(ラグ)を表示することができます。
ラグにマウスをホバリングさせると、
ホバーテキストに「年齢」が表示されます。
ここでは「age=44」が表示されています。
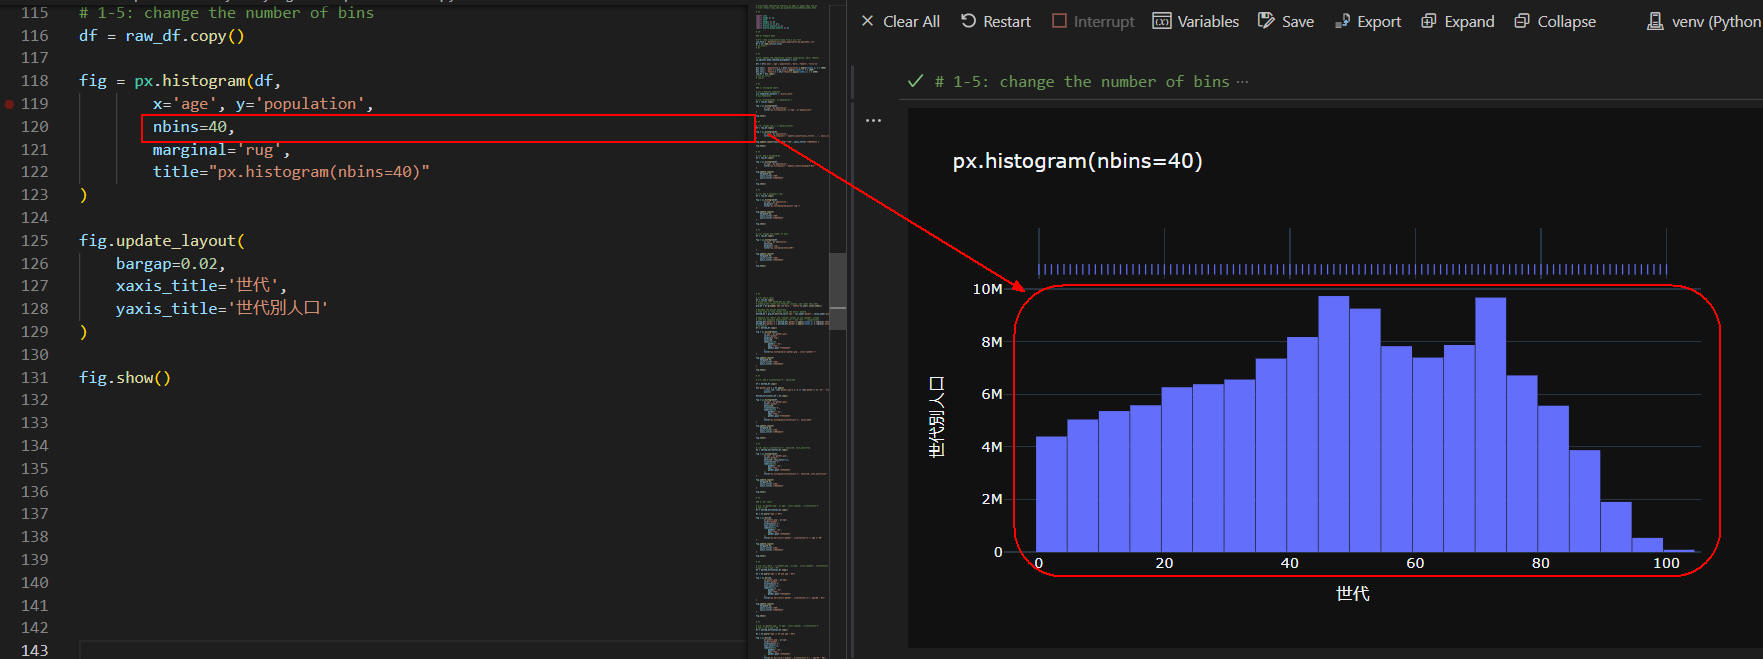 図4-5
図4-5では、Plotly Expressの「histogram()」メソッドの引数に
「nbins=40」を追加しています。
ビンは、X軸またはY軸に沿って、
データを分割するために使用される幅の範囲です。
ここでは、X軸に沿って40個のビンを作成することを指示しています。
つまり、世代が「5歳」間隔になり、より詳細なヒストグラムが作成されます。
縦棒の年齢を知りたいときは、図4-4のようにラグにマウスをホバリングさせます。
ホバーテキストには「年齢」が表示されます。
図4-5
図4-5では、Plotly Expressの「histogram()」メソッドの引数に
「nbins=40」を追加しています。
ビンは、X軸またはY軸に沿って、
データを分割するために使用される幅の範囲です。
ここでは、X軸に沿って40個のビンを作成することを指示しています。
つまり、世代が「5歳」間隔になり、より詳細なヒストグラムが作成されます。
縦棒の年齢を知りたいときは、図4-4のようにラグにマウスをホバリングさせます。
ホバーテキストには「年齢」が表示されます。
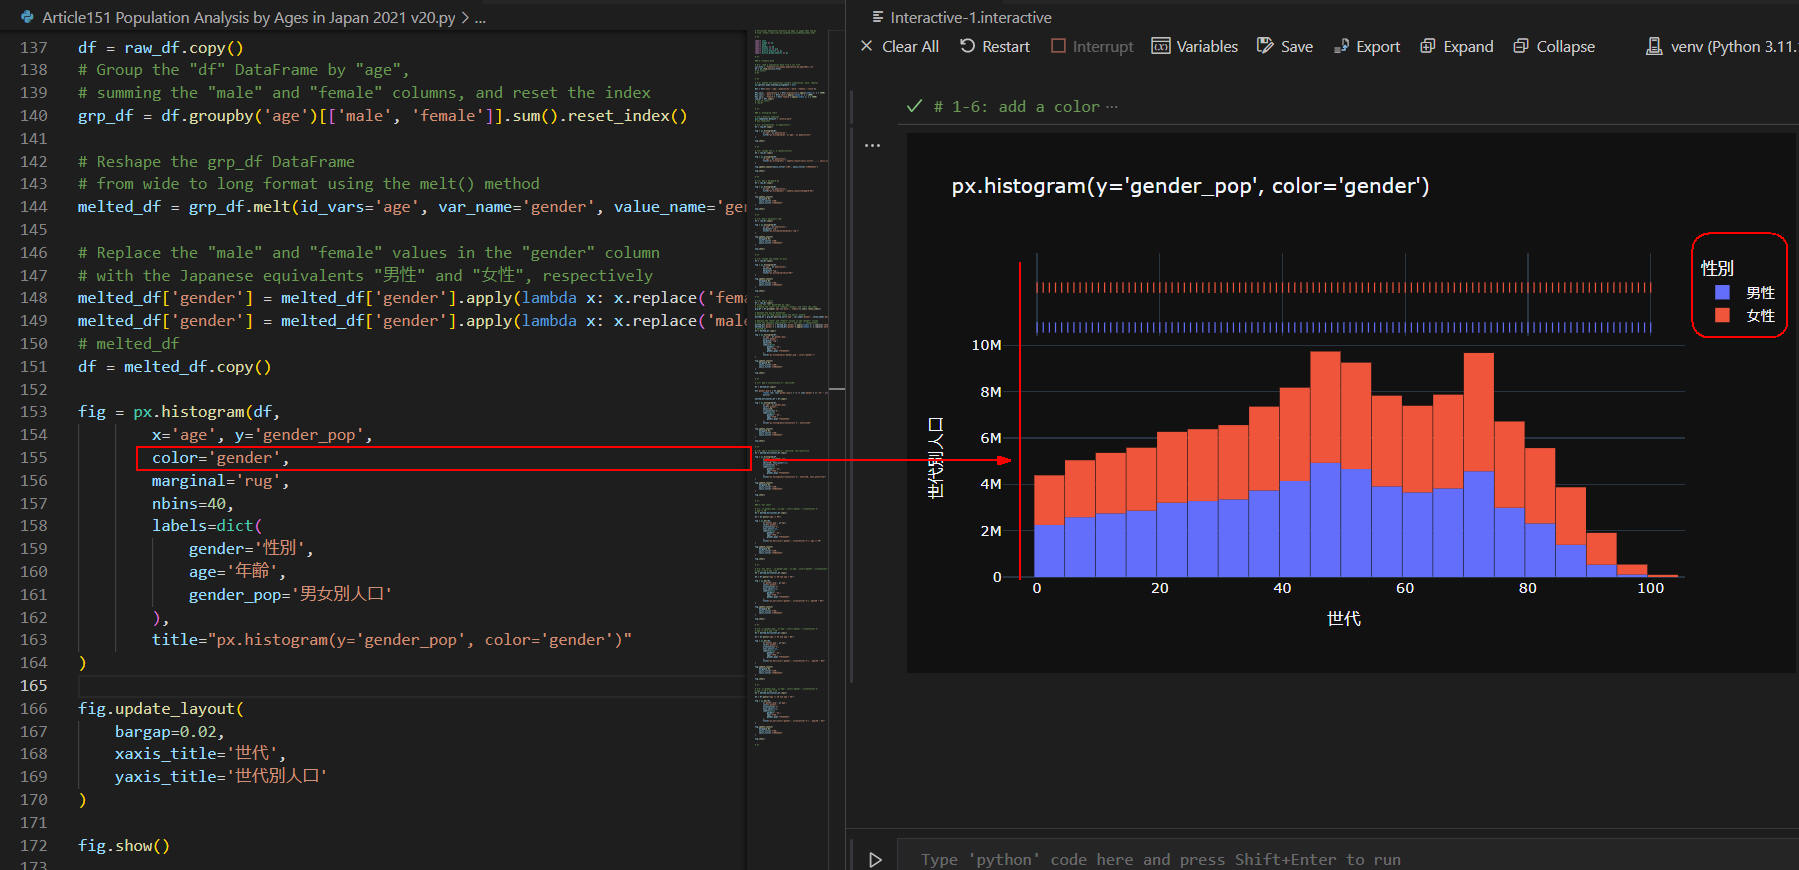 図4-6
図4-6では、Plotly Expressの「histogram()」メソッドに引数
「color='gender'」を追加しています。
この場合、ヒストグラムの縦棒が男女別に色分けされます。
ラグも男女別に分離されます。
実際の年齢を知りたいときは、
男女のラグにマウスをホバリングさせます。
図4-6
図4-6では、Plotly Expressの「histogram()」メソッドに引数
「color='gender'」を追加しています。
この場合、ヒストグラムの縦棒が男女別に色分けされます。
ラグも男女別に分離されます。
実際の年齢を知りたいときは、
男女のラグにマウスをホバリングさせます。
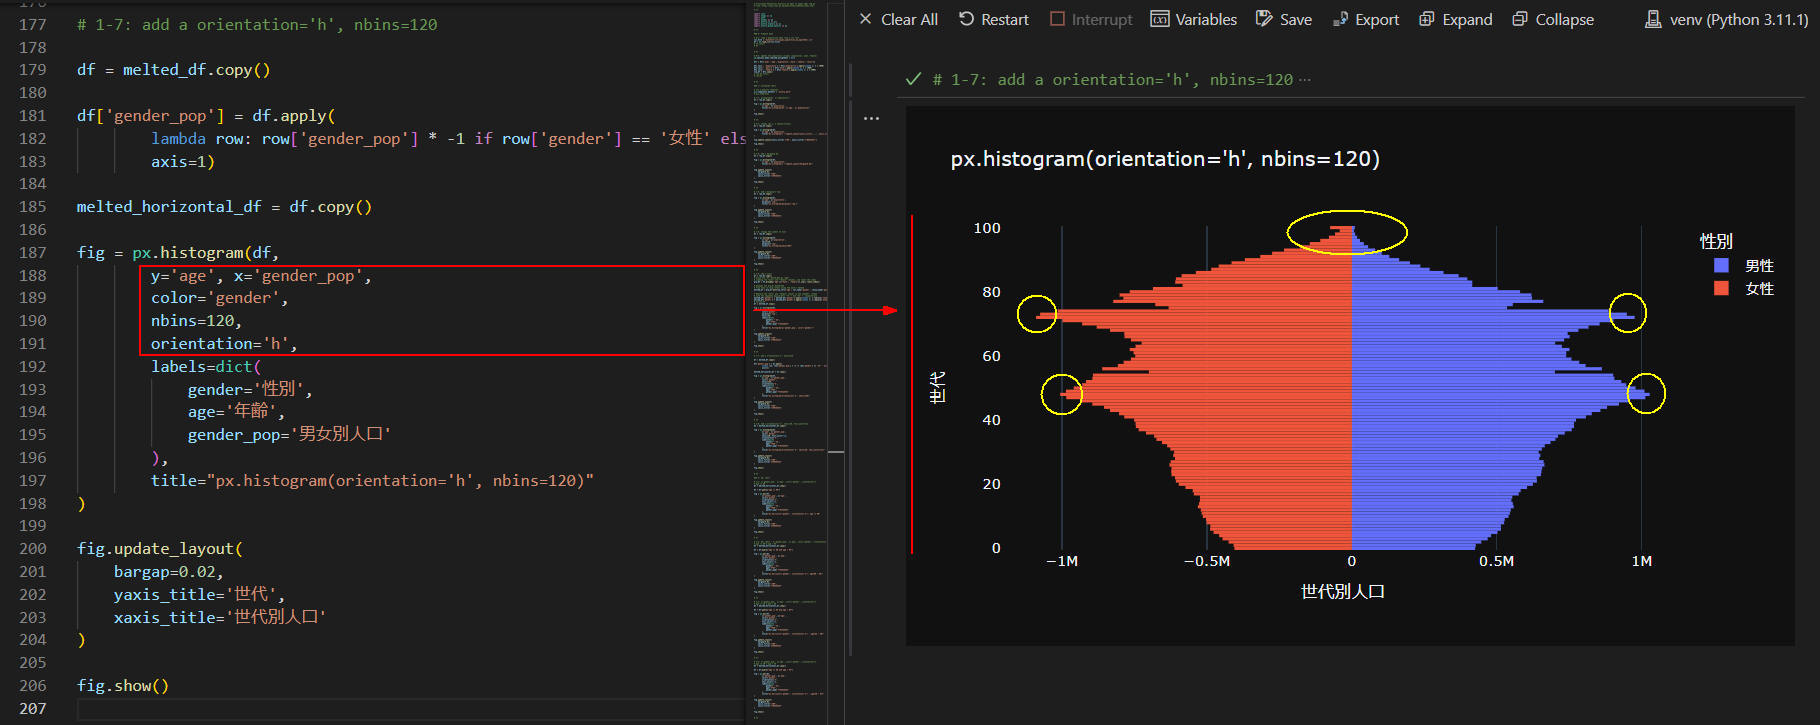 図4-7
図4-7では、Plotly Expressの「histogram()」メソッドの引数に
「orientation='h'」を追加して水平形のヒストグラムに切り替えています。
さらに、引数「nbins=120」を追加して1歳間隔で棒グラフを作成するようにしています。
ヒストグラムを水平形にするときは、
引数「x, y」を入れ替える必要があります。
ここでは、「y='age', x='gender_pop'」を指定しています。
この図では、どの年齢の人口が多いかが可視化されます。
実際の年齢を知りたいときは、マウスをホバリングさせます。
ホバーテキストには「年齢」が表示されます。
人口が一番多いのは、女性が「72歳」、男性が「48歳」です。
ちなみに、ヒストグラムはズームイン・ズームアウトできるので年齢を調べるときに便利です。
図4-7
図4-7では、Plotly Expressの「histogram()」メソッドの引数に
「orientation='h'」を追加して水平形のヒストグラムに切り替えています。
さらに、引数「nbins=120」を追加して1歳間隔で棒グラフを作成するようにしています。
ヒストグラムを水平形にするときは、
引数「x, y」を入れ替える必要があります。
ここでは、「y='age', x='gender_pop'」を指定しています。
この図では、どの年齢の人口が多いかが可視化されます。
実際の年齢を知りたいときは、マウスをホバリングさせます。
ホバーテキストには「年齢」が表示されます。
人口が一番多いのは、女性が「72歳」、男性が「48歳」です。
ちなみに、ヒストグラムはズームイン・ズームアウトできるので年齢を調べるときに便利です。
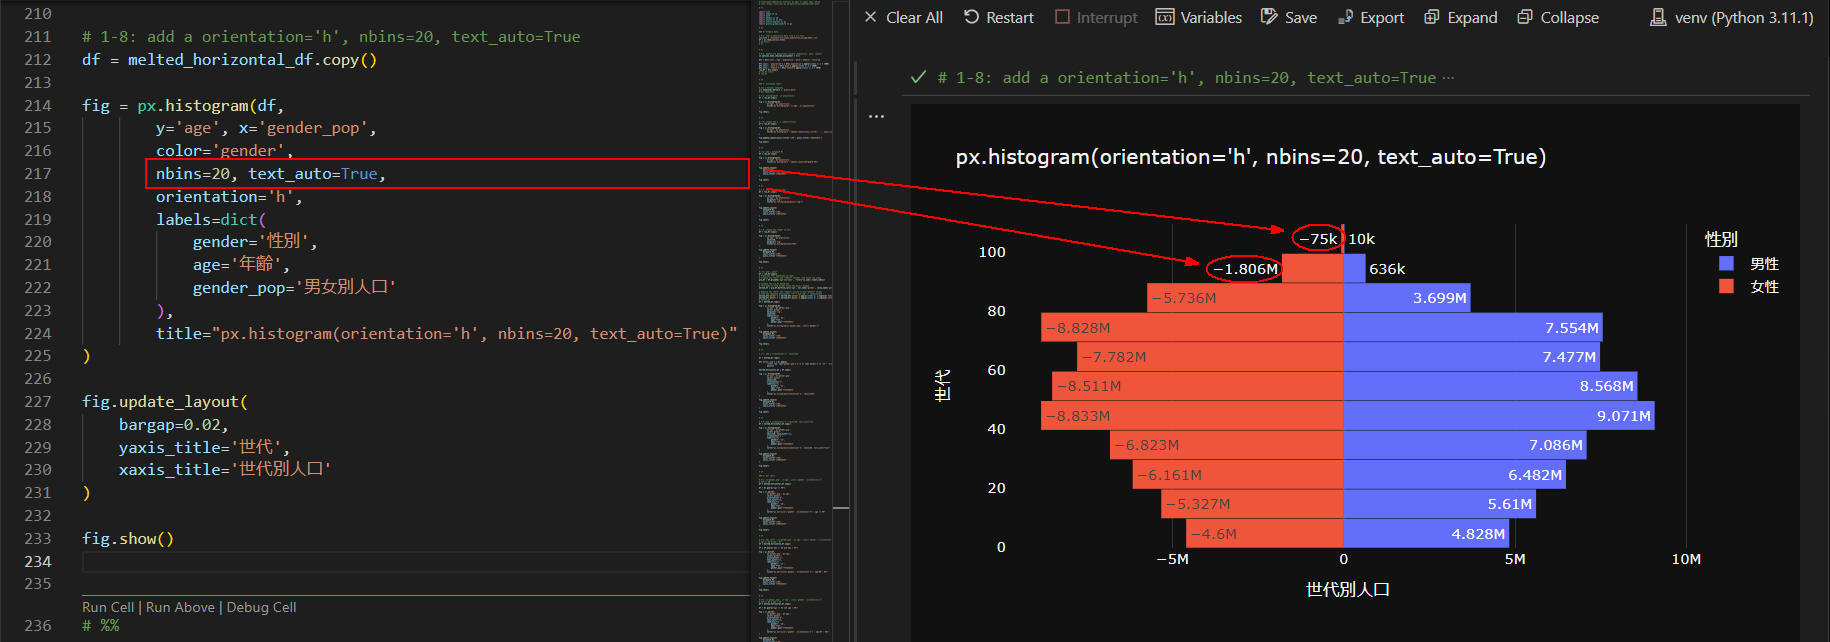 図4-8
図4-8では、Plotly Expressの「histogram()」メソッドの引数に
「text_auto=True」を追加して人口(人数)を表示させています。
"99k" および "999M" は、
グラフ上に表示される値をわかりやすくするために使用されている略語表現です。
"k" は "1000" を表し、"99k" は "99,000" を意味します。
"M" は "1,000,000" を表し、"999M" は "999,000,000" を意味します。
ちなみに、グラフを左右対称に表示させるために
女性の人口(人数)がマイナスになっています。
図4-8
図4-8では、Plotly Expressの「histogram()」メソッドの引数に
「text_auto=True」を追加して人口(人数)を表示させています。
"99k" および "999M" は、
グラフ上に表示される値をわかりやすくするために使用されている略語表現です。
"k" は "1000" を表し、"99k" は "99,000" を意味します。
"M" は "1,000,000" を表し、"999M" は "999,000,000" を意味します。
ちなみに、グラフを左右対称に表示させるために
女性の人口(人数)がマイナスになっています。
-
Plotly ExpressのBar(棒グラフ)で年齢別人口データを分析(可視化)する
ここでは、Plotly Expressの棒グラフで年齢別人口データを可視化します。
前出のヒストグラムでは、年齢を世代ごとにまとめて棒グラフを作成しましたが、
ここでは各年齢ごとの棒グラフを作成して細かく分析します。
### 3: bar chart

# 3-1: x='gender_pop', y='age', color='gender', orientation='h'
# age >= 90
df = melted_horizontal_df.copy()

df = df.query("age >= 90")

fig = px.bar(df,
        x='gender_pop', y='age',
        color='gender',
        orientation='h',
        text_auto=True,
        labels=dict(
            gender='性別',
            age='年齢',
            gender_pop='男女別人口'
        ),
        title="px.bar(color='gender', orientation='h'): age >= 90"
)

fig.update_layout(
    bargap=0.02,
    yaxis_title='世代',
    xaxis_title='世代別人口'
)

fig.show()


# %%

# 3-2: bar chart : x='gender_pop', y='age', color='gender', orientation='h'
# age >= 80 & age < 95
df = melted_horizontal_df.copy()

df = df.query("age >= 80 and age < 95")

fig = px.bar(df,
        x='gender_pop', y='age',
        color='gender',
        orientation='h',
        text_auto=True,
        labels=dict(
            gender='性別',
            age='年齢',
            gender_pop='男女別人口'
        ),
        title="px.bar(color='gender', orientation='h'): age(80 ~ 95)"
)

fig.update_layout(
    bargap=0.02,
    yaxis_title='世代',
    xaxis_title='世代別人口'
)

fig.show()


# %%

# 3-3: x='gender_pop', y='age', color='gender', orientation='h'
# age >= 65 & age < 80
df = melted_horizontal_df.copy()

df = df.query("age >= 65 and age < 80")

fig = px.bar(df,
        x='gender_pop', y='age',
        color='gender',
        orientation='h',
        text_auto=True,
        labels=dict(
            gender='性別',
            age='年齢',
            gender_pop='男女別人口'
        ),
        title="px.bar(color='gender', orientation='h') : age(65 ~ 80)"
)

fig.update_layout(
    bargap=0.02,
    yaxis_title='世代',
    xaxis_title='世代別人口'
)

fig.show()


# %%

# 3-4: x='gender_pop', y='age', color='gender', orientation='h'
# age >= 40 % age < 55
df = melted_horizontal_df.copy()

df = df.query("age >= 40 and age < 55")

fig = px.bar(df,
        x='gender_pop', y='age',
        color='gender',
        orientation='h',
        text_auto=True,
        labels=dict(
            gender='性別',
            age='年齢',
            gender_pop='男女別人口'
        ),
        title="px.bar(color='gender', orientation='h') : age(40 ~ 55)"
)

fig.update_layout(
    bargap=0.02,
    yaxis_title='世代',
    xaxis_title='世代別人口'
)

fig.show()
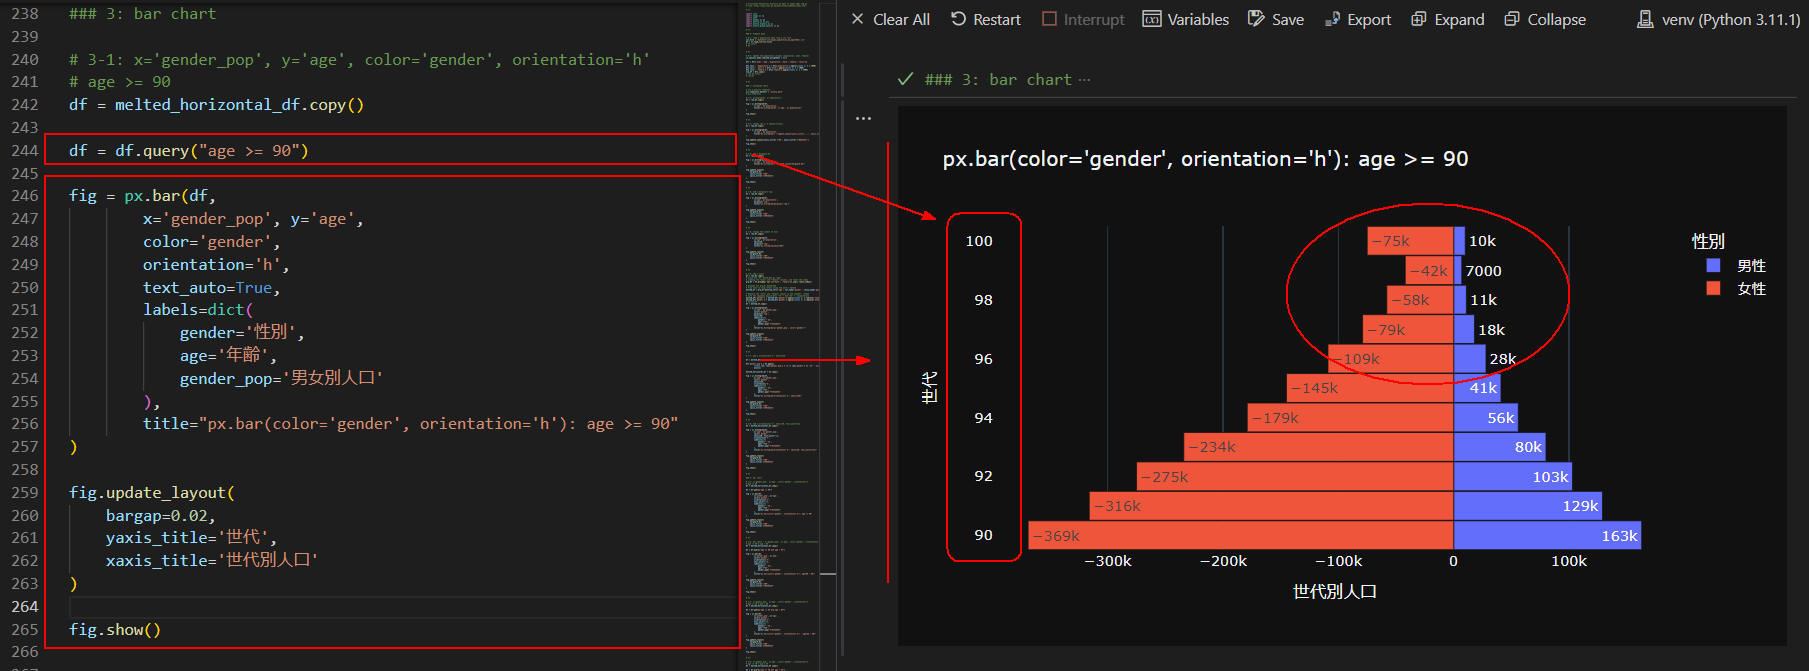 図5-1
図5-1では、年齢が90歳以上の人の棒グラフを作成しています。
棒グラフには、年齢ごとの人口(人数)が表示されています。
「99k」と表示されているときは「0を3個」追加してください。
「99M」と表示されているときは「0を6個」追加してください。
この図から、100歳以上の女性は「75,000人」、
100歳以上の男性は「10,000人」いることが分かります。
図5-1
図5-1では、年齢が90歳以上の人の棒グラフを作成しています。
棒グラフには、年齢ごとの人口(人数)が表示されています。
「99k」と表示されているときは「0を3個」追加してください。
「99M」と表示されているときは「0を6個」追加してください。
この図から、100歳以上の女性は「75,000人」、
100歳以上の男性は「10,000人」いることが分かります。
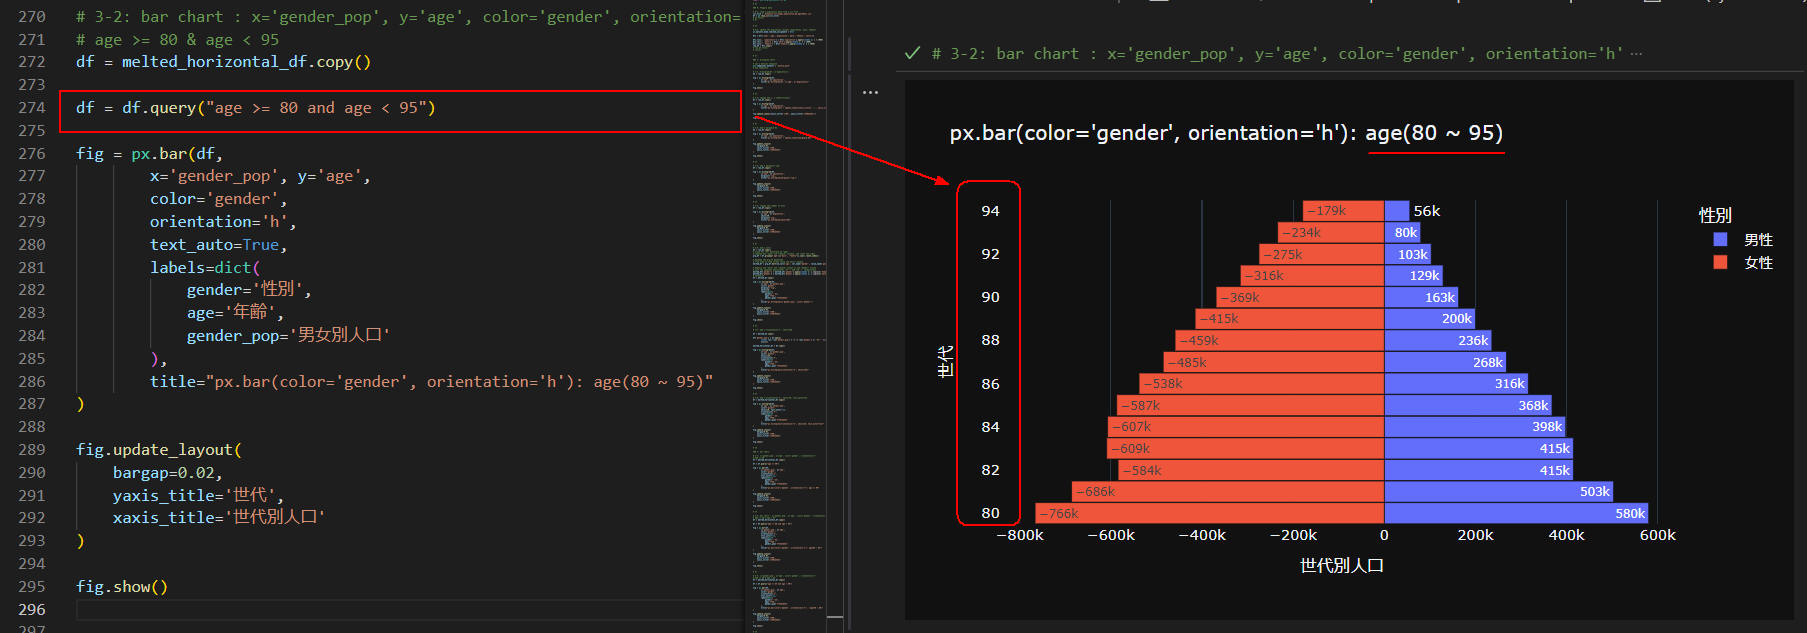 図5-2
図5-2では、年齢が「80歳~95歳」の人の人口をグラフに表示しています。
女性の83歳、84歳、85歳の人が82歳の人よりも多くなっています。
太平洋戦争が影響している可能性がありますが、
要因を追求する必要がありそうです。
図5-2
図5-2では、年齢が「80歳~95歳」の人の人口をグラフに表示しています。
女性の83歳、84歳、85歳の人が82歳の人よりも多くなっています。
太平洋戦争が影響している可能性がありますが、
要因を追求する必要がありそうです。
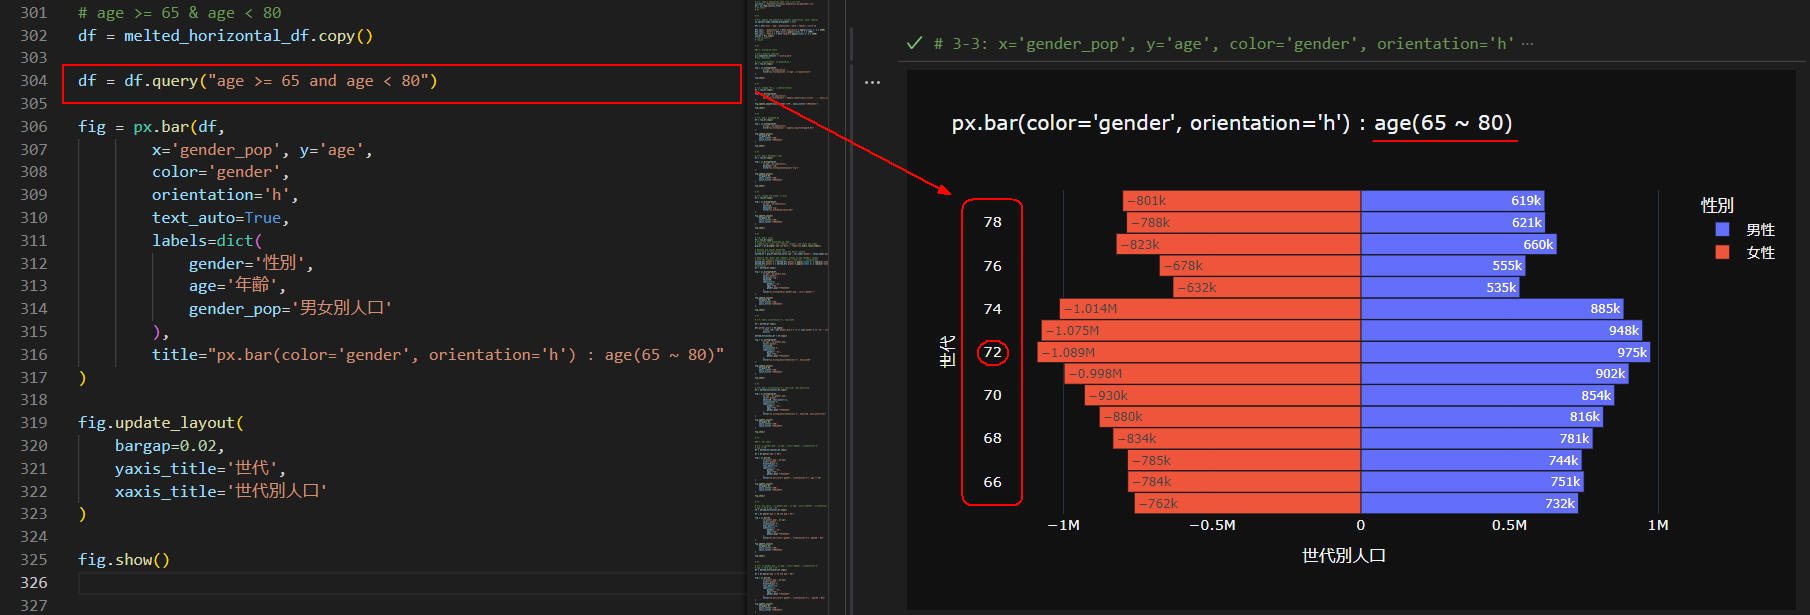 図5-3
図5-3では、年齢が「65歳~80歳」の人の人口をグラフに表示しています。
この世代で一番人口が多いのが、女性、男性とも72歳です。
女性(1,089,000人), 男性(975,000人)になっています。
図5-3
図5-3では、年齢が「65歳~80歳」の人の人口をグラフに表示しています。
この世代で一番人口が多いのが、女性、男性とも72歳です。
女性(1,089,000人), 男性(975,000人)になっています。
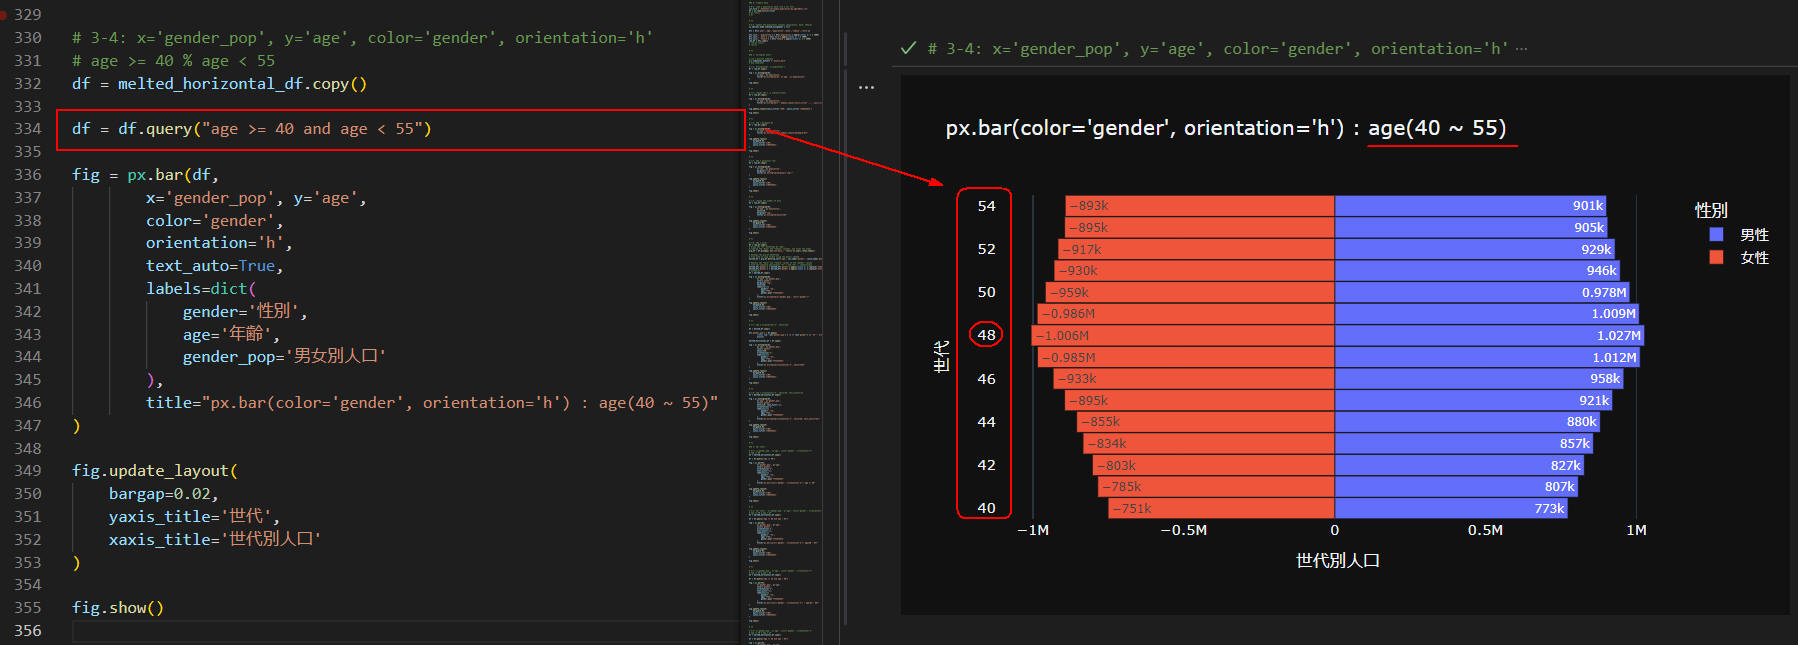 図5-4
図5-4では、年齢が「40歳~55歳」の人の人口をグラフに表示しています。
この世代で一番人口が多いのが、女性、男性とも48歳です。
女性(1,060,000人), 男性(1,027,000人)になっています。
図5-4
図5-4では、年齢が「40歳~55歳」の人の人口をグラフに表示しています。
この世代で一番人口が多いのが、女性、男性とも48歳です。
女性(1,060,000人), 男性(1,027,000人)になっています。
-
全てのコードを掲載
ここでは、本記事で解説している全てのコードを掲載しています。
リスト6-1: Article151.py
# Article151 Population Analysis by Ages in Japan 2021 v20.py
# link: https://www.stat.go.jp/data/jinsui/2021np/index.html

# %%

import json
import numpy as np
import math
import pandas as pd
import plotly.io as pio
import plotly.express as px
import plotly.graph_objects as go

# %%

### 0: Prepare data

# 0-1: read a population data from a csv file
csv_file = r'https://money-or-ikigai.com/Menu/Python/Article/data/map/japan_population_by_age(2021).csv'
# csv_file = 'datasets/csv/japan_population_by_age(2021).csv'
df = pd.read_csv(csv_file)
# df.info()
# df


# %%

# 0-2: update the population columns (population, male, female)
pd.options.mode.chained_assignment = None

dfx = df[['year','age','population','male','female','ratio']]

dfx.loc[:, 'population'] = dfx['population'].apply(lambda x: x * 1000)
dfx.loc[:, 'male'] = dfx['male'].apply(lambda x: x * 1000)
dfx.loc[:, 'female'] = dfx['female'].apply(lambda x: x * 1000)
raw_df = dfx.copy()
# raw_df.info()
# raw_df


# %%

### 1: histogram chart

# set a defulat template
pio.templates.default = 'plotly_dark'
# pio.templates

# 1-1: histogram(df, x='population')
df = raw_df.copy()

fig = px.histogram(df,
        x='age', y='population',
        title="px.histogram(df, x='age', y='population)"
)

fig.show()


# %%

# 1-2: change the x, y lables(titles)
df = raw_df.copy()

fig = px.histogram(df,
        x='age', y='population',
        title="px.histogram() + update_layout(xaxis_title='...', yaxis_title='...') "
)

fig.update_layout(xaxis_title='世代', yaxis_title='世代別人口')

fig.show()


# %%

# 1-3: add a bargap=0.02
df = raw_df.copy()

fig = px.histogram(df,
        x='age', y='population',
        title="px.histogram() + update_layout(bargap=0.02)"
)

fig.update_layout(
    bargap=0.02,
    xaxis_title='世代',
    yaxis_title='世代別人口'
)

fig.show()


# %%

# 1-4: add a marginal='rug'
df = raw_df.copy()

fig = px.histogram(df,
        x='age', y='population',
        marginal='rug',
        title="px.histogram(marginal='rug')"
)

fig.update_layout(
    bargap=0.02,
    xaxis_title='世代',
    yaxis_title='世代別人口'
)

fig.show()


# %%

# 1-5: change the number of bins
df = raw_df.copy()

fig = px.histogram(df,
        x='age', y='population',
        nbins=40,
        marginal='rug',
        title="px.histogram(nbins=40)"
)

fig.update_layout(
    bargap=0.02,
    xaxis_title='世代',
    yaxis_title='世代別人口'
)

fig.show()


# %%

# 1-6: add a color
df = raw_df.copy()
# Group the "df" DataFrame by "age",
# summing the "male" and "female" columns, and reset the index
grp_df = df.groupby('age')[['male', 'female']].sum().reset_index()

# Reshape the grp_df DataFrame
# from wide to long format using the melt() method
melted_df = grp_df.melt(id_vars='age', var_name='gender', value_name='gender_pop')

# Replace the "male" and "female" values in the "gender" column
# with the Japanese equivalents "男性" and "女性", respectively
melted_df['gender'] = melted_df['gender'].apply(lambda x: x.replace('female','女性'))
melted_df['gender'] = melted_df['gender'].apply(lambda x: x.replace('male','男性'))
# melted_df
df = melted_df.copy()

fig = px.histogram(df,
        x='age', y='gender_pop',
        color='gender',
        marginal='rug',
        nbins=40,
        labels=dict(
            gender='性別',
            age='年齢',
            gender_pop='男女別人口'
        ),
        title="px.histogram(y='gender_pop', color='gender')"
)

fig.update_layout(
    bargap=0.02,
    xaxis_title='世代',
    yaxis_title='世代別人口'
)

fig.show()


# %%

# 1-7: add a orientation='h', nbins=120

df = melted_df.copy()

df['gender_pop'] = df.apply(
        lambda row: row['gender_pop'] * -1 if row['gender'] == '女性' else row['gender_pop'],
        axis=1)

melted_horizontal_df = df.copy()

fig = px.histogram(df,
        y='age', x='gender_pop',
        color='gender',
        nbins=120,
        orientation='h',
        labels=dict(
            gender='性別',
            age='年齢',
            gender_pop='男女別人口'
        ),
        title="px.histogram(orientation='h', nbins=120)"
)

fig.update_layout(
    bargap=0.02,
    yaxis_title='世代',
    xaxis_title='世代別人口'
)

fig.show()


# %%

# 1-8: add a orientation='h', nbins=20, text_auto=True
df = melted_horizontal_df.copy()

fig = px.histogram(df,
        y='age', x='gender_pop',
        color='gender',
        nbins=20, text_auto=True,
        orientation='h',
        labels=dict(
            gender='性別',
            age='年齢',
            gender_pop='男女別人口'
        ),
        title="px.histogram(orientation='h', nbins=20, text_auto=True)"
)

fig.update_layout(
    bargap=0.02,
    yaxis_title='世代',
    xaxis_title='世代別人口'
)

fig.show()


# %%

### 3: bar chart

# 3-1: x='gender_pop', y='age', color='gender', orientation='h'
# age >= 90
df = melted_horizontal_df.copy()

df = df.query("age >= 90")

fig = px.bar(df,
        x='gender_pop', y='age',
        color='gender',
        orientation='h',
        text_auto=True,
        labels=dict(
            gender='性別',
            age='年齢',
            gender_pop='男女別人口'
        ),
        title="px.bar(color='gender', orientation='h'): age >= 90"
)

fig.update_layout(
    bargap=0.02,
    yaxis_title='世代',
    xaxis_title='世代別人口'
)

fig.show()


# %%

# 3-2: bar chart : x='gender_pop', y='age', color='gender', orientation='h'
# age >= 80 & age < 95
df = melted_horizontal_df.copy()

df = df.query("age >= 80 and age < 95")

fig = px.bar(df,
        x='gender_pop', y='age',
        color='gender',
        orientation='h',
        text_auto=True,
        labels=dict(
            gender='性別',
            age='年齢',
            gender_pop='男女別人口'
        ),
        title="px.bar(color='gender', orientation='h'): age(80 ~ 95)"
)

fig.update_layout(
    bargap=0.02,
    yaxis_title='世代',
    xaxis_title='世代別人口'
)

fig.show()


# %%

# 3-3: x='gender_pop', y='age', color='gender', orientation='h'
# age >= 65 & age < 80
df = melted_horizontal_df.copy()

df = df.query("age >= 65 and age < 80")

fig = px.bar(df,
        x='gender_pop', y='age',
        color='gender',
        orientation='h',
        text_auto=True,
        labels=dict(
            gender='性別',
            age='年齢',
            gender_pop='男女別人口'
        ),
        title="px.bar(color='gender', orientation='h') : age(65 ~ 80)"
)

fig.update_layout(
    bargap=0.02,
    yaxis_title='世代',
    xaxis_title='世代別人口'
)

fig.show()


# %%

# 3-4: x='gender_pop', y='age', color='gender', orientation='h'
# age >= 40 % age < 55
df = melted_horizontal_df.copy()

df = df.query("age >= 40 and age < 55")

fig = px.bar(df,
        x='gender_pop', y='age',
        color='gender',
        orientation='h',
        text_auto=True,
        labels=dict(
            gender='性別',
            age='年齢',
            gender_pop='男女別人口'
        ),
        title="px.bar(color='gender', orientation='h') : age(40 ~ 55)"
)

fig.update_layout(
    bargap=0.02,
    yaxis_title='世代',
    xaxis_title='世代別人口'
)

fig.show()