仮想通貨BOTの基本:GMOコインのレバレッジ取引用11銘柄の相関分析を「Matplotlib/Sns」で視覚化しよう
本記事では、GMOコインのレバレッジ取引用11銘柄の相関分析を「Matplotlib/Sns」で視覚化します。
さらに、「Plotly Express(PX)」で相関分析をインタラクティブに行う方法についても解説します。
DashとPXを連携させると、Webアプリから相関図を作成することも可能になります。
仮想通貨の相関分析は「単純リターン(Simple Return)」、「累積リターン(Cumulative Return)」、
「累積ログリターン(Cumulative Log Return)」などで行うのが一般的ですが、
ここでは「累積ログリターン」を使用して分析します。
リスト: 相関分析を単純リターン、累積リターン、累積ログリターンで行う例
# 単純リターン(Simple Returns)
simple_returns = close_df.pct_change()

# 累積リターン(Cumulative Returns)
cumulative_returns = (1 + simple_returns).cumprod() - 1

# 累積ログリターン(Cumulative Log Returns)
log_returns = np.log(1 + simple_returns)
cumulative_log_returns = log_returns.cumsum()

# 相関分析(Correlation Analysis)
corr_simple = simple_returns.corr()
corr_cumulative = cumulative_returns.corr()
corr_cumulative_log = cumulative_log_returns.corr()

print("Correlation of Simple Returns:\n", corr_simple)
print("Correlation of Cumulative Returns:\n", corr_cumulative)
print("Correlation of Cumulative Log Returns:\n", corr_cumulative_log)
相関分析はこれらの他に「移動平均(Moving Averages)」、「ボラティリティ(Volatility)」、
「価格水準(Price Levels)」、「取引量(Trading Volume)」、「テクニカル指標(Techninal Indicators)」
で行うこともできます。これらの相関分析についは、後日別記事にて解説します。
参考までにGMOコインでは、レバレッジ取引は11銘柄をサポートしています。本記事執筆時点では国内の取引所最多です。
【GMOコインでサポートしているレバレッジ取引用銘柄】
ビットコイン(BTC/JPY)、イーサリアム(ETH/JPY)、ビットコインキャッシュ(BCH/JPY)、リップル(XRP/JPY)、ライトコイン(LTC/JPY)、
ポルカドット(DOT/JPY)、コスモス(ATOM/JPY)、カルダノ(ADA/JPY)、チェーンリンク(LINK/JPY)、ドージコイン(DOGE/JPY)、ソラナ(SOL/JPY)
仮想通貨の取引には「現物取引」と「レバレッジ取引」がありますが、BOTで自動トレードを行うときは「レバレッジ取引」が有利です。
たとえば、GMOコインの場合、以下のようなメリットがあります。
- 日本国内では最大2倍までレバレッジがかけられる
- レバレッジ取引ではショートポジション(売り)から入ることができる(つまり上昇・下降どちらのトレンドでも稼げる)
- 現物取引は売買ごとに手数料(taker, maker)がかかるが、レバレッジ取引では売買手数料は無料(ただし、レバレッジ取引ではポジションをロールオーバーさせるとレバレッジ手数料がかかる)
仮想通貨のBOTを6本走らせる場合リスクを分散させるという意味で、
ビットコイン(BTC/JPY)と相関関係が高いビットコインキャッシュ(BCH/JPY)、イーサリアム(ETH/JPY)、
そして逆にビットコインと相関関係が低いコスモス(ATOM/JPY)、ポルカドット(DOT/JPY)、チェーンリンク(LINK/JPY)
の6種類の仮想通貨を組み合わせるという戦略もあります。
本シリーズでは、MicrosoftのVisual Studio Code(VS Code)を使用します。
説明文の左側に図の画像が表示されていますが縮小されています。
画像を拡大するにはマウスを画像上に移動してクリックします。
画像が拡大表示されます。拡大された画像を閉じるには右上の[X]をクリックします。
画像の任意の場所をクリックして閉じることもできます。
【免責事項】
当記事や当サイトの情報を参考に仮想通貨のBOT(自動トレードプログラム)を動かす場合は、すべて自己責任でお願いいたします。
当サイトの情報を参考にして発生したいかなる損害も責任を負いません。
 図A
図A
 図B
図B
 図C
図C
 図D
図D
仮想通貨BOTの基本:GMOコインのレバレッジ取引用11銘柄の相関分析を「Matplotlib/Sns」で視覚化しよう
-
ユーザー定義関数「get_ticker_info()」を作成する
ここでは、GMOコインのPublic API(ticker)を使用して仮想通貨のシンボルを取得するユーザー定義関数「get_ticker_info()」を作成します。
この関数からは戻り値としてPandasのDataFrameが返されます。
DataFrameは列(ask, bid, high, last, low, symbol, timestamp, volume)から構成されています。
リスト1:
# [0-1] Define the get_ticker_info() function

######################################
def get_ticker_info() -> pd.DataFrame:
    # info_df = get_ticker_info()
    global data

    url = 'https://api.coin.z.com/public/v1/ticker'

    response = requests.get(url)
    data = response.json()

    df = pd.DataFrame()

    if data.get('status') == 0:
        df = pd.DataFrame(data.get('data', []))

    return df
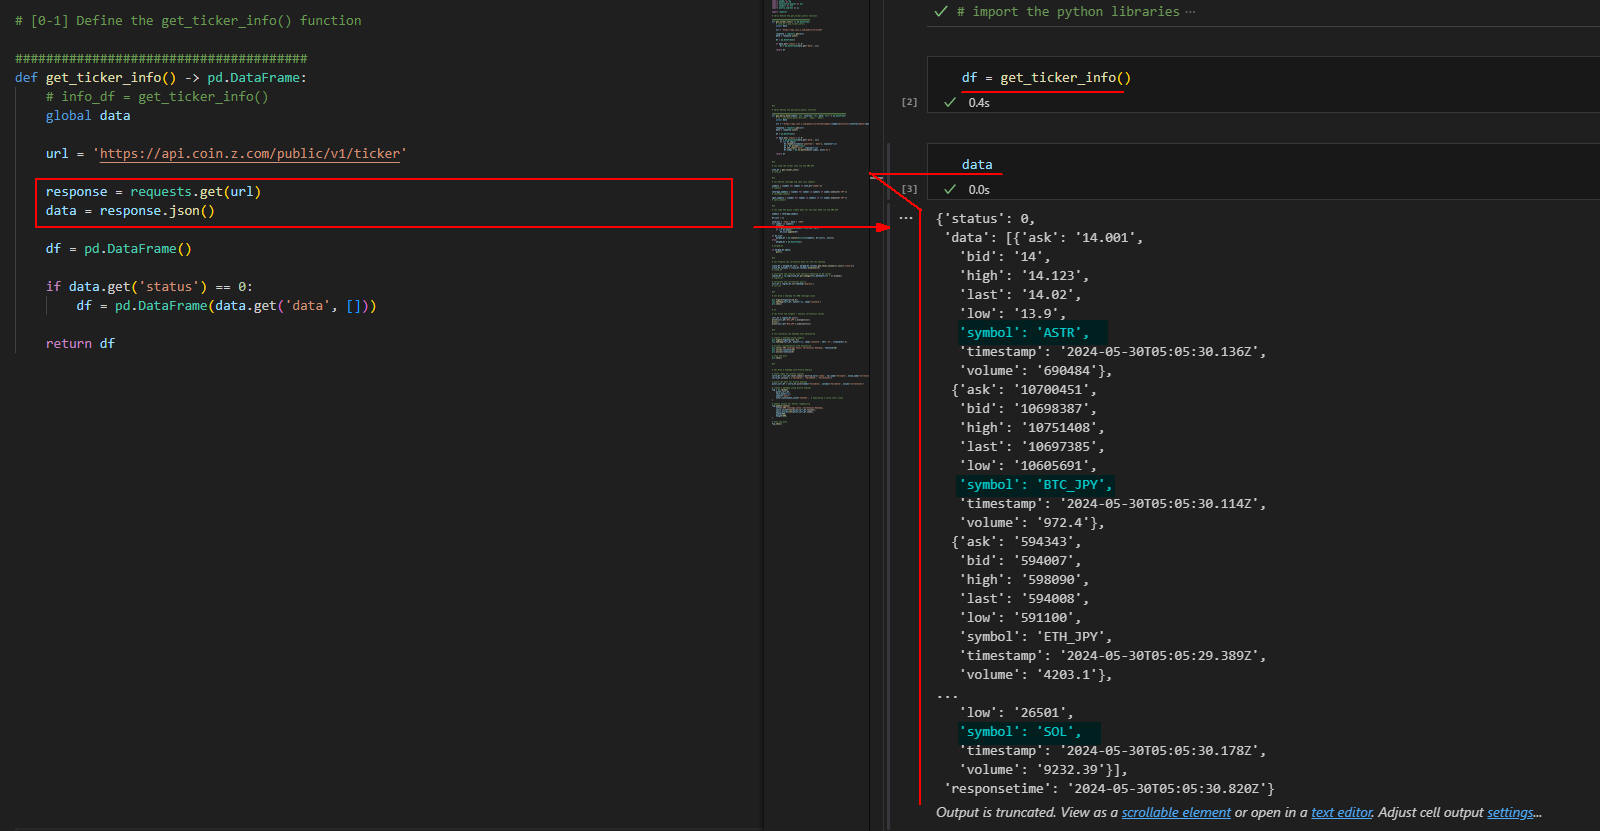 図1-1
図1-1では、Public API(ticker)経由で返されたデータ(data)を表示しています。
このデータは「json」形式で格納されています。
ここで取得したデータは、PandasのDataFrameに格納します。
図1-1
図1-1では、Public API(ticker)経由で返されたデータ(data)を表示しています。
このデータは「json」形式で格納されています。
ここで取得したデータは、PandasのDataFrameに格納します。
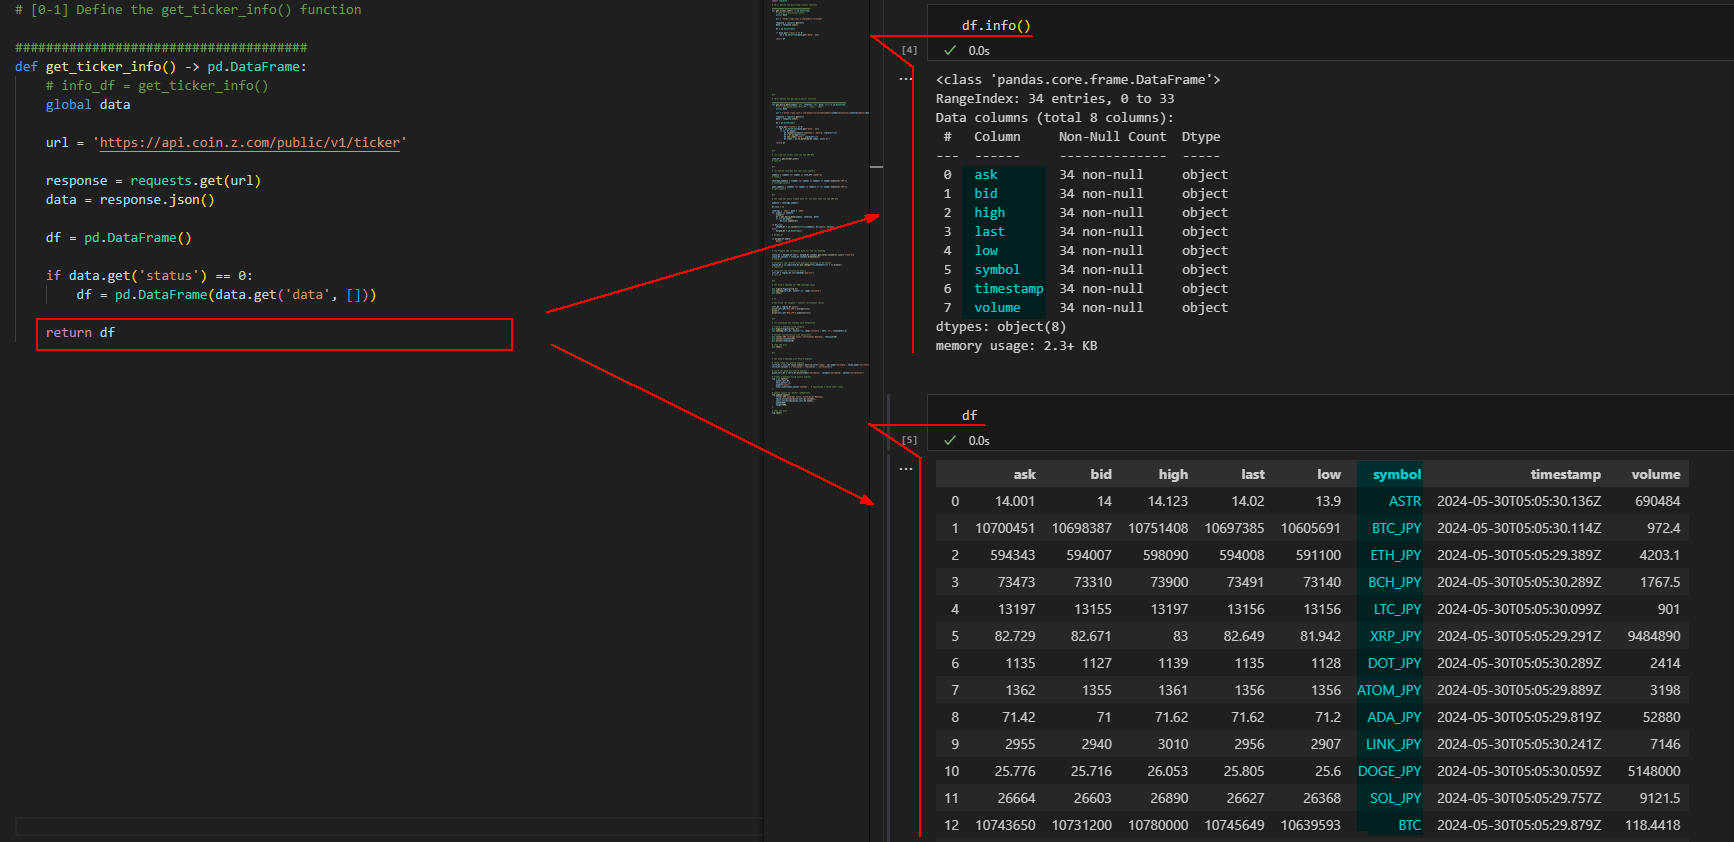 図1-2
図1-2では、PandasのDataFrameの構造と内容を表示しています。
DataFrameは列(ask, bid, high, last, low, symbol, timestamp, volume)から構成されています。
図1-2
図1-2では、PandasのDataFrameの構造と内容を表示しています。
DataFrameは列(ask, bid, high, last, low, symbol, timestamp, volume)から構成されています。
-
ユーザー定義関数「get_daily_data()」を作成する
ここでは、GMOコインのPublic API(klines)を使用して仮想通貨の過去の取引データをダウンロードする
ユーザー定義関数「get_daily_data()」を作成します。
この関数からは仮想通貨の取引データがPandasのDataFrameに格納されて返されます。
DataFrameは列(open, high, low, close, volume)から構成されます。
列(date)はインデックス(index)として設定されています。
リスト2:
# [0-2] Define the get_daily_data() function

##########################################################################
def get_daily_data(symbol: str, interval: str, date: str) -> pd.DataFrame:
    # df = get_daily_data('BTC_JPY', '1day', '2024')
    global data

    url = f'https://api.coin.z.com/public/v1/klines?symbol={symbol}&interval={interval}&date={date}'

    response = requests.get(url)
    data = response.json()

    df = pd.DataFrame()

    if data.get('status') == 0:
        df = pd.DataFrame(data.get('data', []))
        if not df.empty:
            df.rename(columns={'openTime': 'date'}, inplace=True)
            df = df.astype(float)
            df.set_index('date', inplace=True)
            df.index = pd.to_datetime(df.index, unit='ms')

    return df
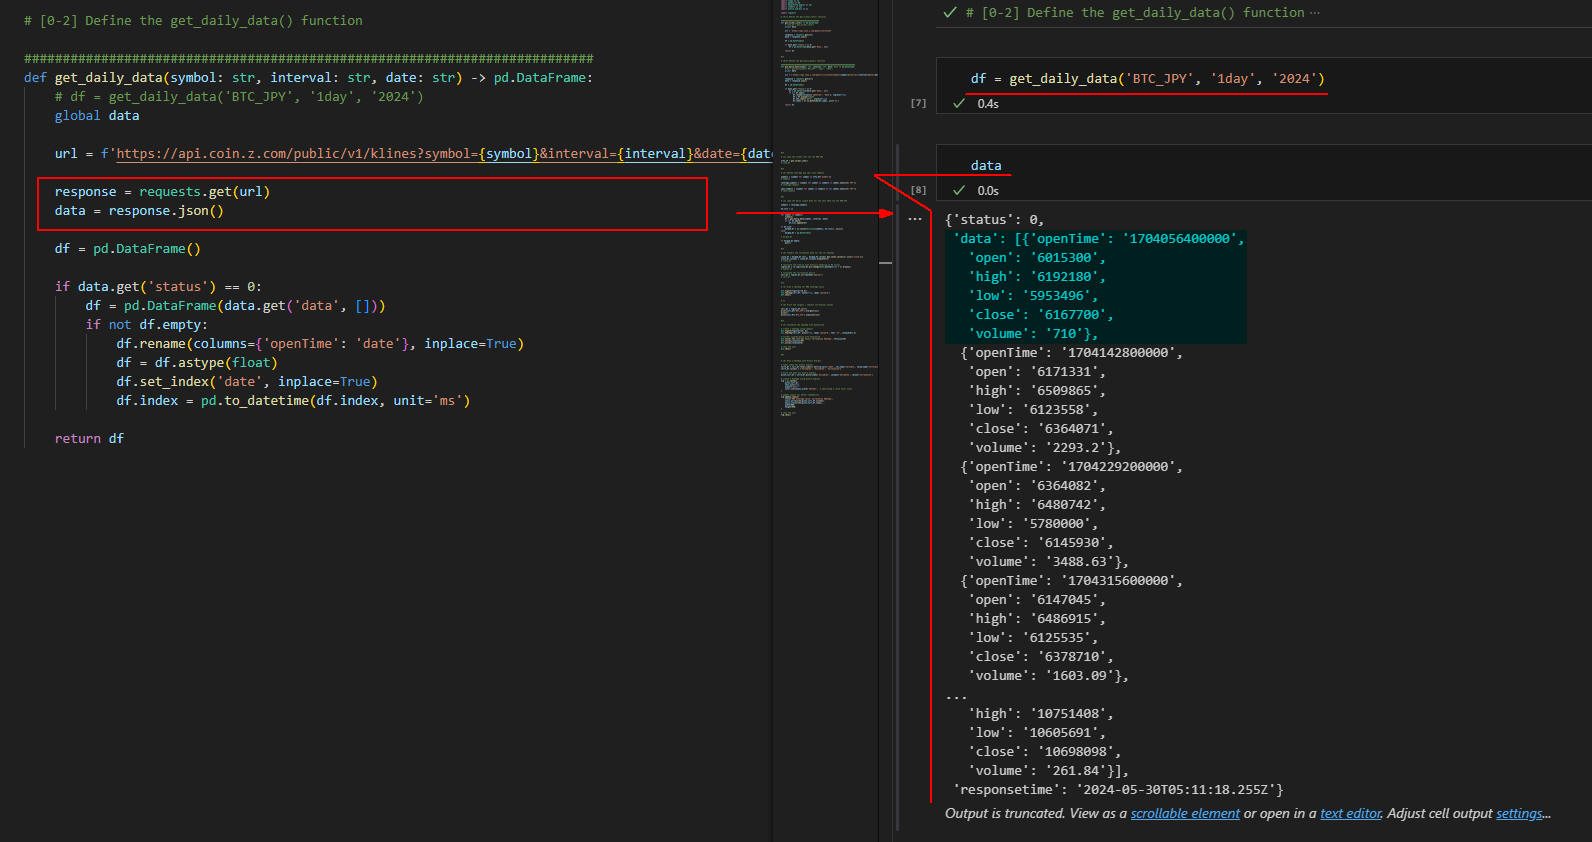 図2-1
図2-1では、Public API(klines)経由で返されたデータ(data)を表示しています。
このデータは「json」形式で格納されています。
データには「2024年度」の「日次」データが格納されています。
このデータはPandasのDataFrameに格納します。
図2-1
図2-1では、Public API(klines)経由で返されたデータ(data)を表示しています。
このデータは「json」形式で格納されています。
データには「2024年度」の「日次」データが格納されています。
このデータはPandasのDataFrameに格納します。
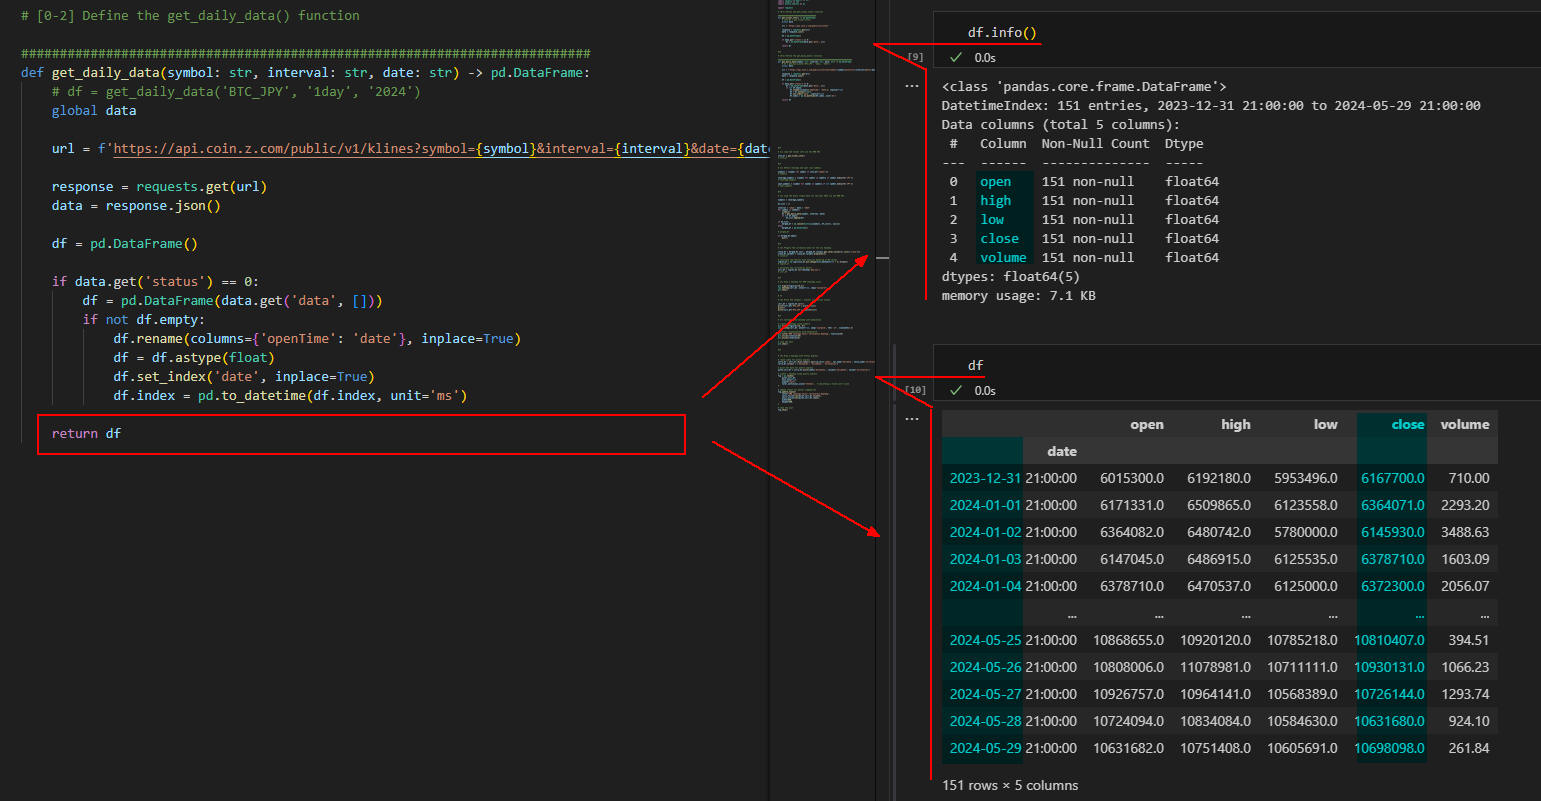 図2-2
図2-2では、Public API(klines)経由で返されたデータをPandasのDataFrameに格納したものを表示しています。
DataFrameは列(open, high, low, close, volume)から構成されています。
なお、列(openTime)は「date」に変更しています。
日付(date)は、「unix」形式で格納されているので「to_datetime()」メソッドで通常の日付に変換しています。
列(date)は、Pandasのインデックス(index)として設定しています。
図2-2
図2-2では、Public API(klines)経由で返されたデータをPandasのDataFrameに格納したものを表示しています。
DataFrameは列(open, high, low, close, volume)から構成されています。
なお、列(openTime)は「date」に変更しています。
日付(date)は、「unix」形式で格納されているので「to_datetime()」メソッドで通常の日付に変換しています。
列(date)は、Pandasのインデックス(index)として設定しています。
-
GMOコインで取引できる仮想通貨のすべてのシンボルを取得する
ここでは、関数「 get_ticker_info()」を呼び出して、
GMOコインがサポートする仮想通貨の全てのシンボルを取得しています。
リスト3:
# [1] Load the ticker info via the GMO API

info_df = get_ticker_info()
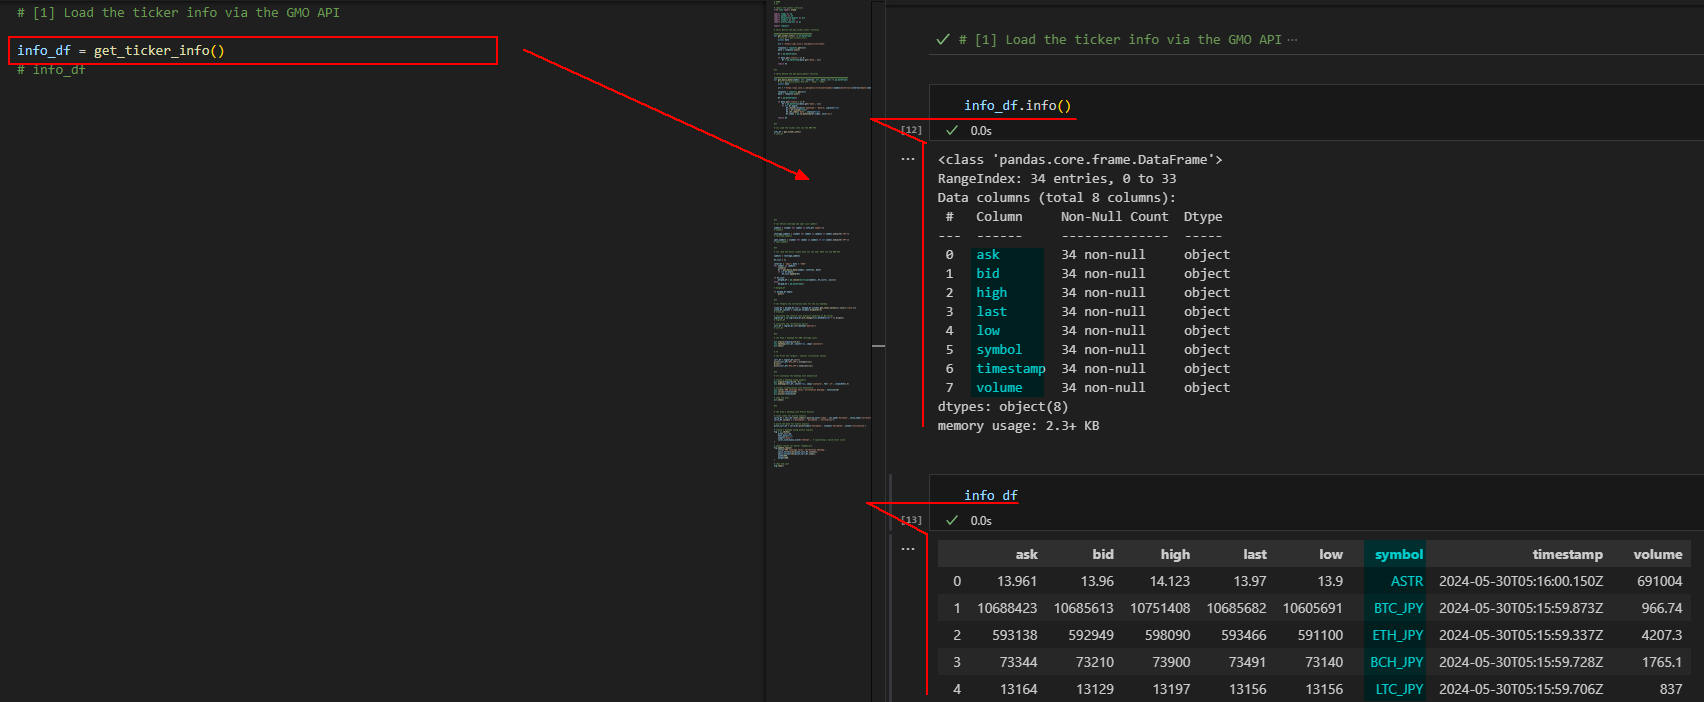 図3-1
図3-1では、DataFrameの構造と内容を表示しています。
DataFrameは列(ask, bid, high, last, low, symbol, timestamp, volume)から構成されています。
図3-1
図3-1では、DataFrameの構造と内容を表示しています。
DataFrameは列(ask, bid, high, last, low, symbol, timestamp, volume)から構成されています。
-
GMOコインの仮想通貨のシンボルを「現物取引」と「レバレッジ取引」に分離する
ここでは、PandasのDataFrameに格納されている仮想通貨のシンボル(symbol)を
「現物取引用」と「レバレッジ取引用」に分離しています。
レバレッジ取引用のシンボルには「_JPY」が付加されています。
たとえば、ビットコイン(Bitcoin)のシンボルは「BTC_JPY」になります。
リスト4:
# [2] Define leverage and spot coin symbols

symbols = [symbol for symbol in info_df['symbol']]

leverage_symbols = [symbol for symbol in symbols if symbol.endswith('JPY')]

spot_symbols = [symbol for symbol in symbols if not symbol.endswith('JPY')]
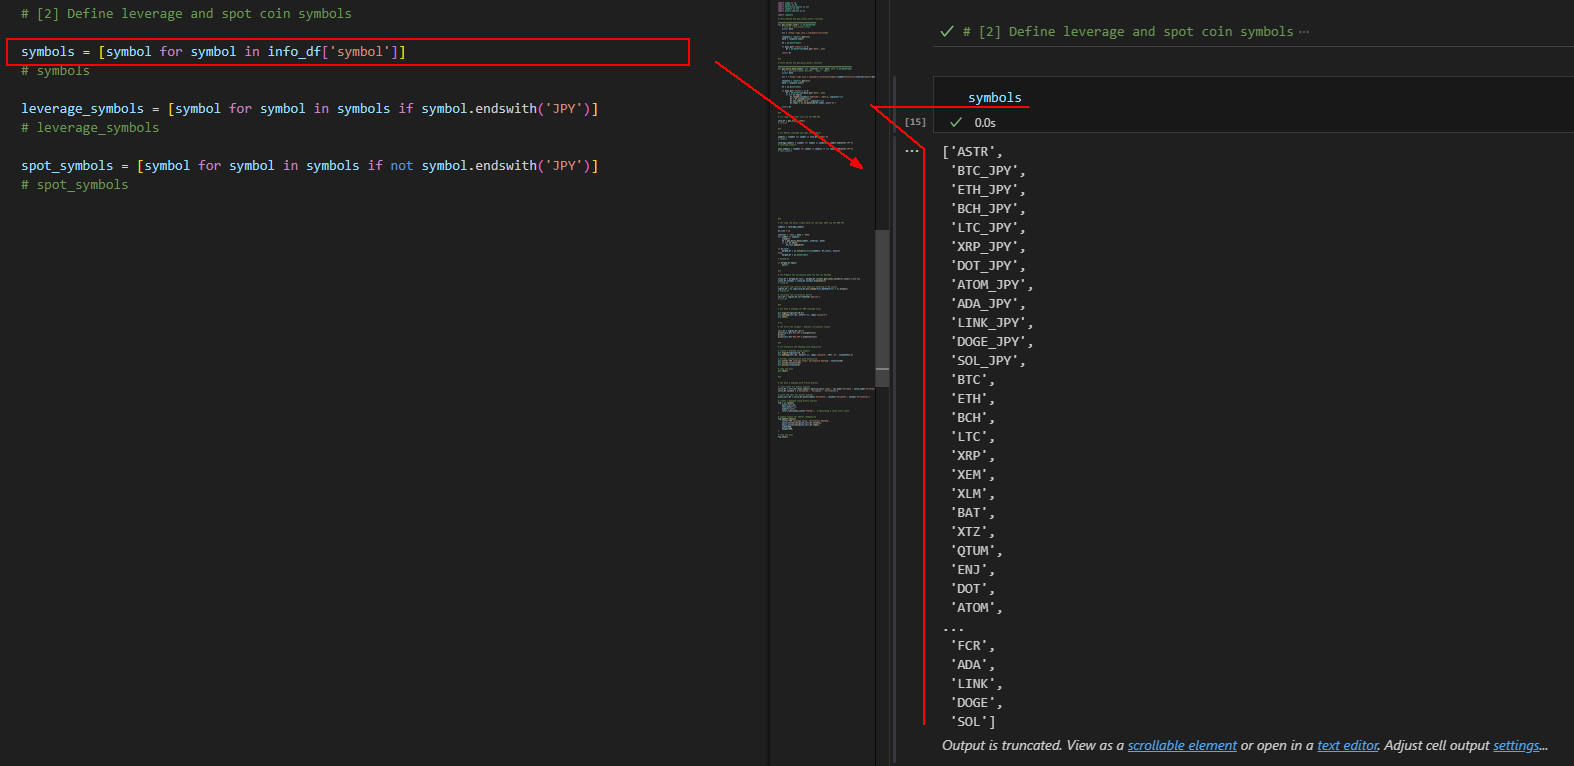 図4-1
図4-1では、Pythonのlist形式の変数「symbols」の内容を表示しています。
この変数には「現物・レバレッジ」のシンボルが混在して格納されています。
図4-1
図4-1では、Pythonのlist形式の変数「symbols」の内容を表示しています。
この変数には「現物・レバレッジ」のシンボルが混在して格納されています。
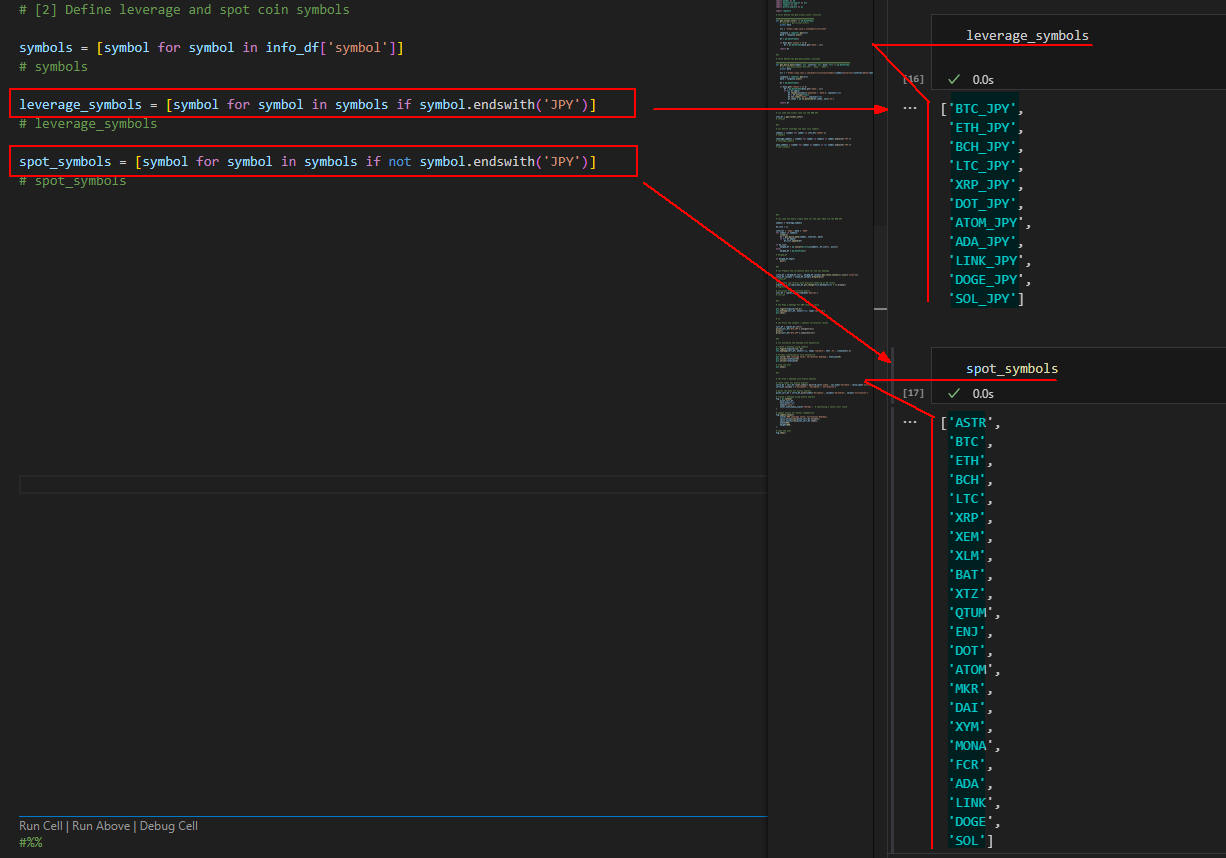 図4-2
図4-2では、「現物(spot_symbols)」と「レバレッジ(leverage_symbols)」のシンボルが格納されている
Pythonのlist形式の変数の内容を表示しています。
図4-2
図4-2では、「現物(spot_symbols)」と「レバレッジ(leverage_symbols)」のシンボルが格納されている
Pythonのlist形式の変数の内容を表示しています。
-
GMOコインのレバレッジ取引用11銘柄の取引データをダウンロードする
ここでは、関数「get_daily_data()」を呼び出してレバレッジ取引の2024年度のデータをダウンロードしています。
ダウンロードしたデータは、PandasのDataFrameに格納されています。
この関数の引数「symbol」には、レバレッジ取引用のシンボル(BTC_JPY, ETH_JPY, BCH_JPY,...)を指定しています。
引数「intervval」には「1day」を指定しています。この場合、日次の取引データが取得できます。
引数「date」には、「2024」を指定しています。この場合、2024年度の取引データが取得できます。
全ての仮想通貨の取引データを取得したら、Pandasの「concat()」メソッドで連結しています。
これで全ての仮想通貨の取引データがDataFrameに併合(merge)されます。
なお、DataFrameの列は階層化されて作成されます。
詳細は、図5-1,図5-2を参照してください。
リスト5:
# [3] Load the daily crypto data for the year 2024 via the GMO API

symbols = leverage_symbols

df_list = []

interval = '1day'; date = '2024'
for symbol in symbols:
    sleep(3)
    df = get_daily_data(symbol, interval, date)
    if not df.empty:
        df_list.append(df)

if df_list:
    merged_df = pd.concat(dict(zip(symbols, df_list)), axis=1)
else:
    merged_df = pd.DataFrame()

if merged_df.empty:
    quit()
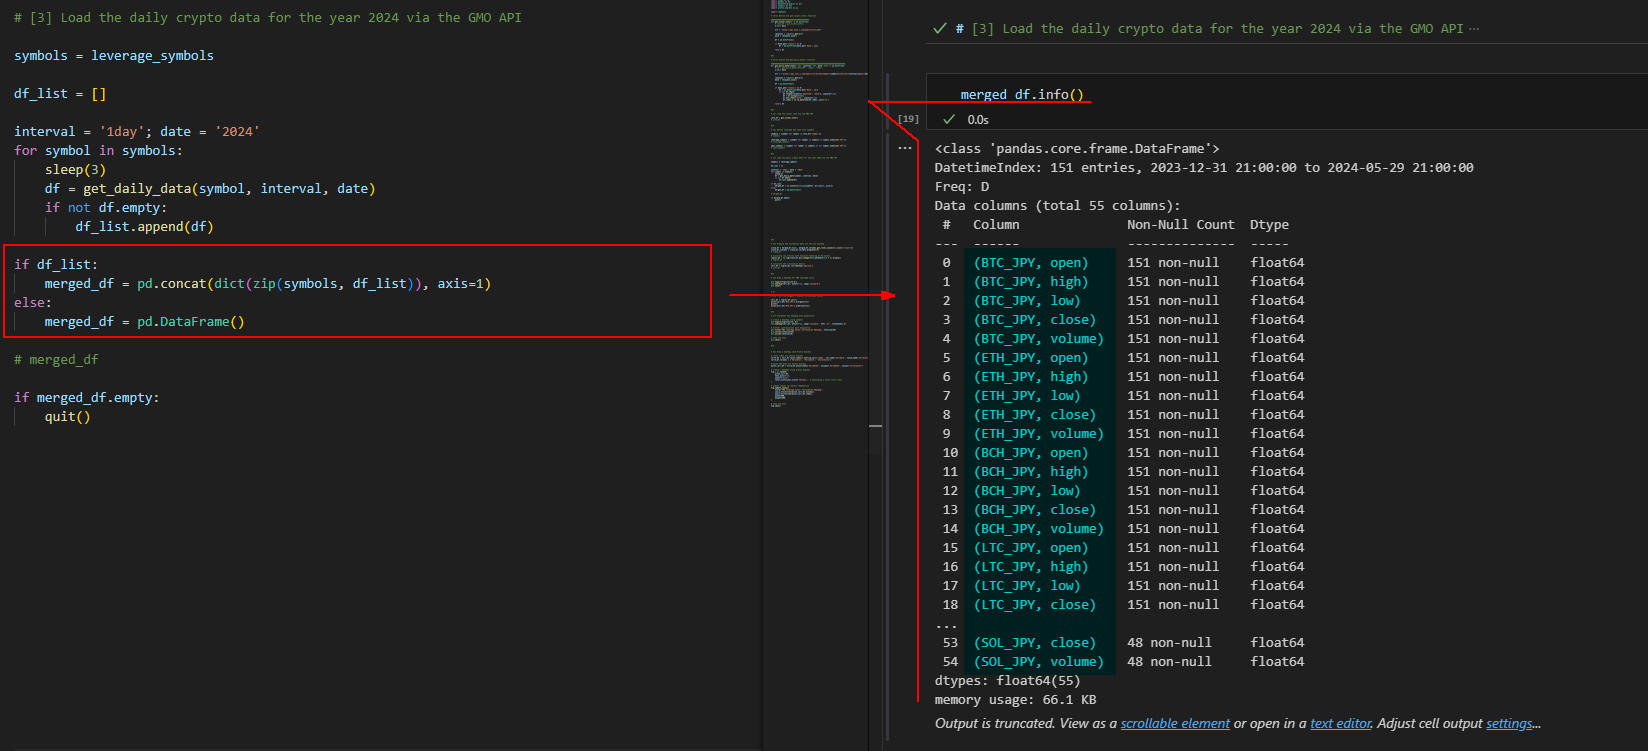 図5-1
図5-1では、PandasのDataFrameの構造を表示しています。
DataFrameの列は階層化(シンボル名、列名)されています。
上位の列名(BTC_JPY, ETH_JPY, BCH_JPY,...)は仮想通貨のシンボルが名前になっています。
下位の列名には、仮想通貨の「open, high, low, close, volume」が格納されています。
図5-1
図5-1では、PandasのDataFrameの構造を表示しています。
DataFrameの列は階層化(シンボル名、列名)されています。
上位の列名(BTC_JPY, ETH_JPY, BCH_JPY,...)は仮想通貨のシンボルが名前になっています。
下位の列名には、仮想通貨の「open, high, low, close, volume」が格納されています。
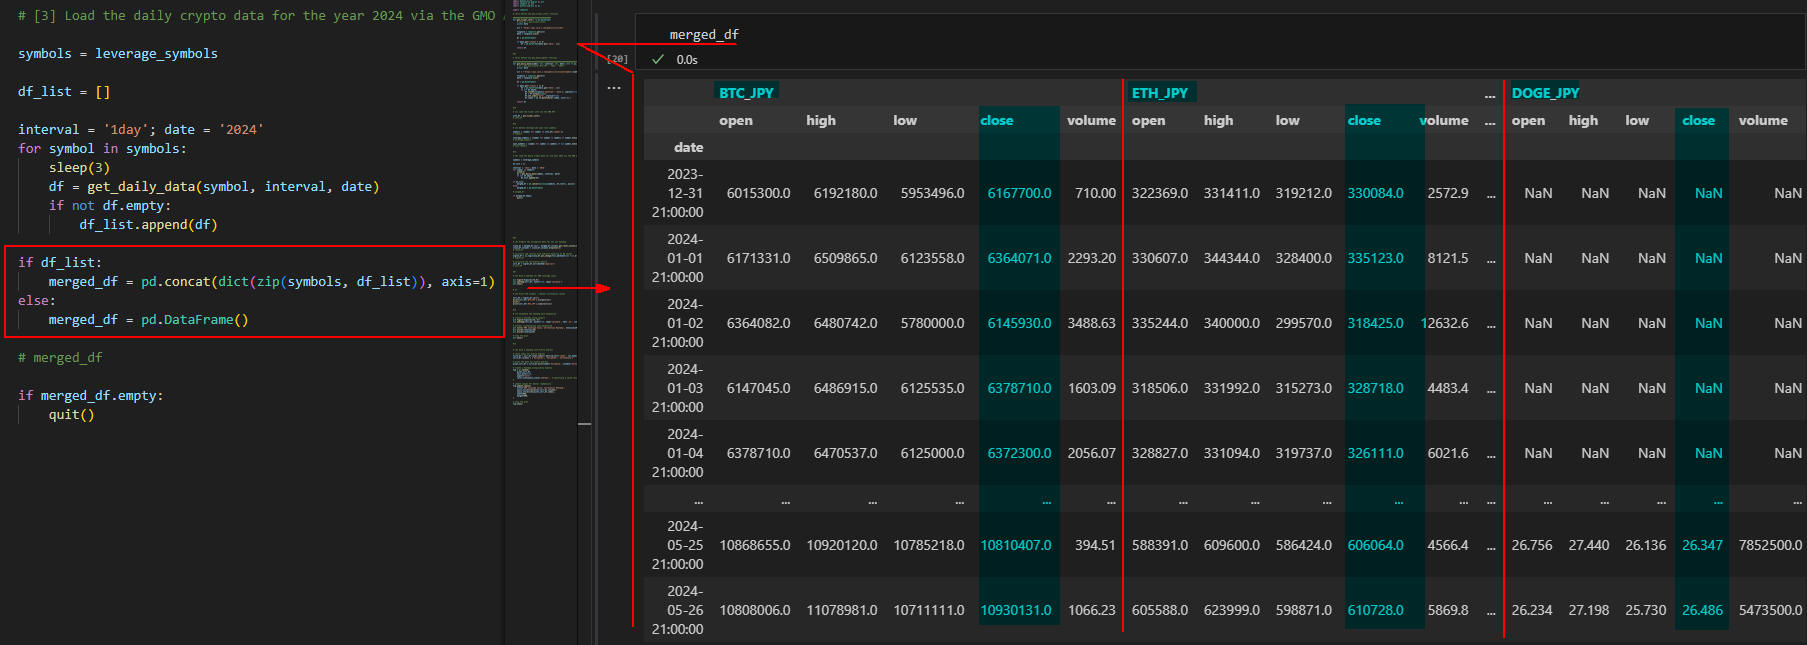 図5-2
図5-2では、DataFrameの内容を表示しています。
DataFrameの列名が階層化されているのが分かります。
図5-2
図5-2では、DataFrameの内容を表示しています。
DataFrameの列名が階層化されているのが分かります。
-
相関図を作成するために取引データを加工・編集する
ここでは、DataFrameの列名から下位の列名(open, high, low, close, volume)を削除して
通常の階層化されていない列名に変換しています。
DataFrameの列(BTC_JPY, ETH_JPY, DOGE_JPY,...)には、仮想通貨の「close:終値」が格納されています。
つまり、それぞれの仮想通貨の「終値」が格納されています。
さらに、それぞれの仮想通貨の「累積ログリターン」を計算してDataFrameに格納しています。
最期にDataFrameの「corr()」メソッドを実行して相関値を格納しています。
リスト6:
# [4] Prepare the correation data for the sns heatmap

close_df = merged_df.loc[:, merged_df.columns.get_level_values(1).isin(['close'])]
close_df.columns = close_df.columns.droplevel(1)

# calculate log returns with explicit handling of NA values
logret_df = np.log(close_df.pct_change(fill_method=None) + 1).dropna()

# calculate the correlation matrix
corr_df = logret_df.corr(method='pearson')
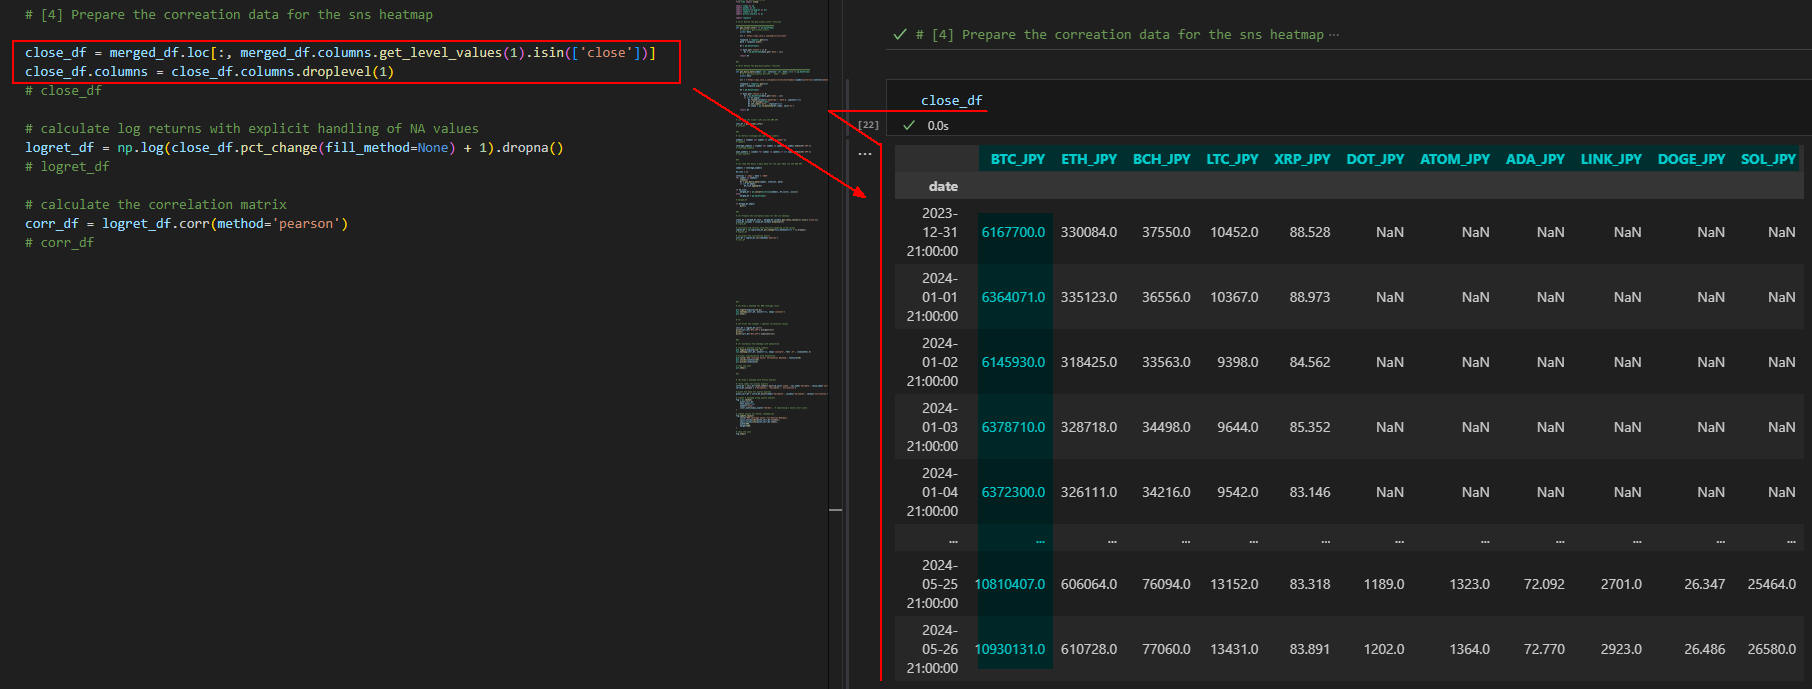 図6-1
図6-1では、DataFrameの列名を階層構造から通常の列名に変換したあとのDataFrameを表示しています。
それぞれの列には、仮想通貨の「終値」が格納されています。
図6-1
図6-1では、DataFrameの列名を階層構造から通常の列名に変換したあとのDataFrameを表示しています。
それぞれの列には、仮想通貨の「終値」が格納されています。
 図6-2
図6-2では、仮想通貨の累積ログリターンを計算して値を格納したあとのDataFrameを表示しています。
それぞれの列には、仮想通貨の「累積ログリターン」が格納されています。
図6-2
図6-2では、仮想通貨の累積ログリターンを計算して値を格納したあとのDataFrameを表示しています。
それぞれの列には、仮想通貨の「累積ログリターン」が格納されています。
 図6-3
図6-3では、「累積ログリターン」を元に計算した「相関値」が格納されているDataFrameを表示しています。
それぞれの列には、仮想通貨の「相関値」が格納されています。
図6-3
図6-3では、「累積ログリターン」を元に計算した「相関値」が格納されているDataFrameを表示しています。
それぞれの列には、仮想通貨の「相関値」が格納されています。
-
Snsで相関図を作成する
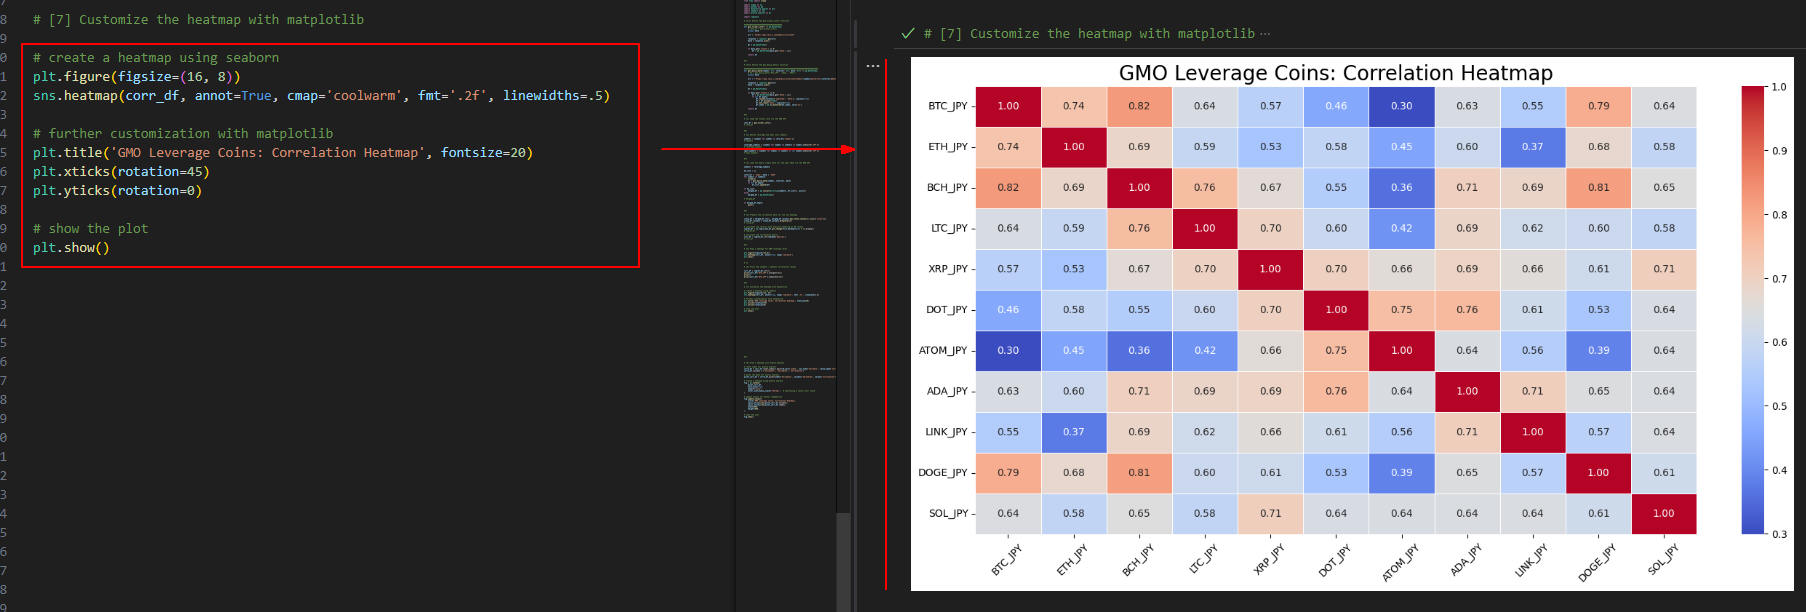
ここでは、Snsで仮想通貨(レバレッジ取引専用)の相関図を作成しています。
Snsの「heatmap()」メソッドの引数に「cmap='coolwarm'」を指定しているので相関図(マトリックス)が「寒色」から「暖色」にスケーリングされます。
つまり、「相関値」が「1」に近いほど「暖色」、「0」に近いほど「寒色」で表示されます。
リスト7:
# [5] Draw a heatmap for GMO leverage coins

plt.figure(figsize=(16,8))
sns.heatmap(corr_df, annot=True, cmap='coolwarm')
plt.show()

# [6] Print the largest / smalest correlation values

corr_df = logret_df.corr()
print(corr_df['BTC_JPY'].nlargest(11))
print()
print(corr_df['BTC_JPY'].nsmallest(11))
 図7-1
図7-1には、仮想通貨(レバレッジ取引専用)の相関図が表示されています。
たとえば、「BTC_JPY」の場合、「BCH_JPY, DOGE_JPY, ETH_JPY,...」の順番に「累積ログリターン」に相関関係があることが分かります。
図7-1
図7-1には、仮想通貨(レバレッジ取引専用)の相関図が表示されています。
たとえば、「BTC_JPY」の場合、「BCH_JPY, DOGE_JPY, ETH_JPY,...」の順番に「累積ログリターン」に相関関係があることが分かります。
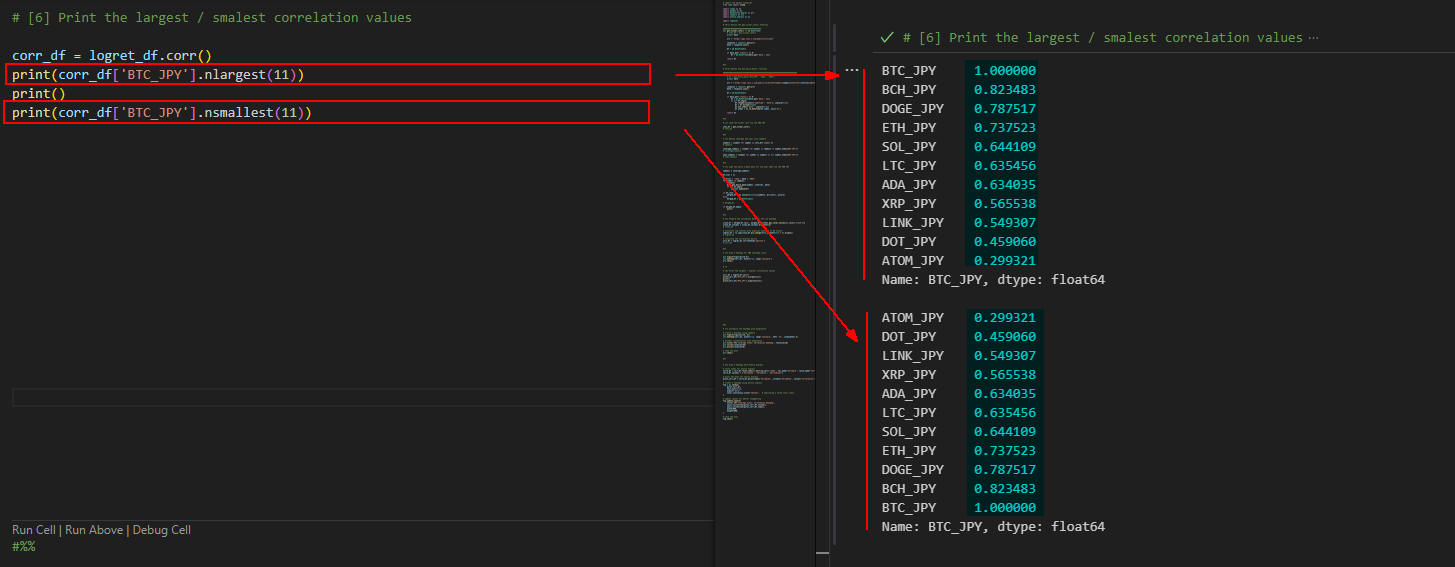 図7-2
図7-2では、「BTC_JPY」の相関関係を「高い順」と「低い順」に並べ替えて表示しています。
数値が高いほど相関関係があることを意味します。
「BTC_JPY」の場合、「BCH_JPY, DOGE_JPY, ETH_JPY,...」の順に相関関係が高いことが分かります。
逆に「ATOM_JPY, DOT_JPY, LINK_JPY,...」の順に相関関係が低いことが分かります。
図7-2
図7-2では、「BTC_JPY」の相関関係を「高い順」と「低い順」に並べ替えて表示しています。
数値が高いほど相関関係があることを意味します。
「BTC_JPY」の場合、「BCH_JPY, DOGE_JPY, ETH_JPY,...」の順に相関関係が高いことが分かります。
逆に「ATOM_JPY, DOT_JPY, LINK_JPY,...」の順に相関関係が低いことが分かります。
-
相関図をMatplotlib/Snsでカスタマイズする
ここでは、MatplotlibとSnsを組み合わせて相関図をカスタマイズしています。
リスト8:
# [7] Customize the heatmap with matplotlib

# create a heatmap using seaborn
plt.figure(figsize=(16, 8))
sns.heatmap(corr_df, annot=True, cmap='coolwarm', fmt='.2f', linewidths=.5)

# further customization with matplotlib
plt.title('GMO Leverage Coins: Correlation Heatmap', fontsize=20)
plt.xticks(rotation=45)
plt.yticks(rotation=0)

# show the plot
plt.show()
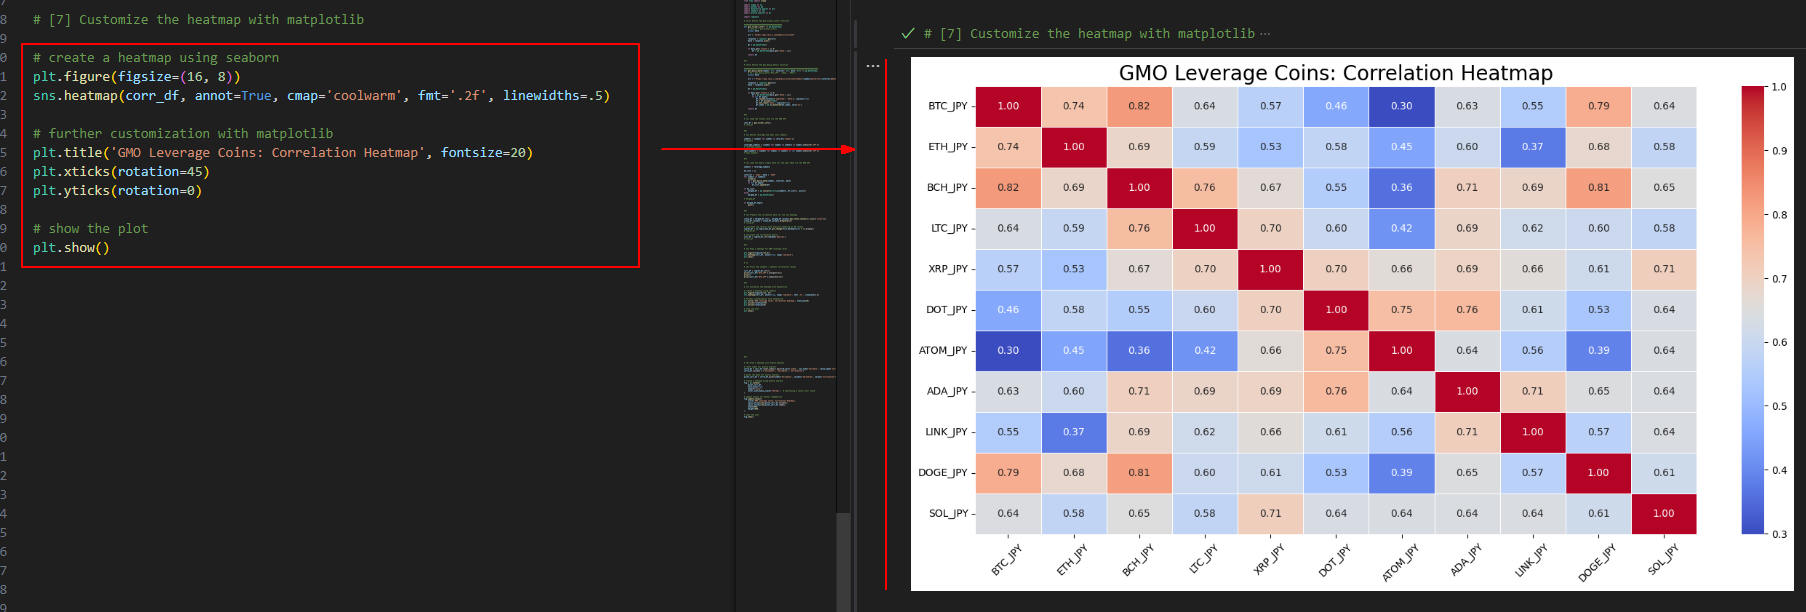 図8-1
図8-1では、仮想通貨(レバレッジ取引専用)の相関図を表示しています。
この図にはタイトルが追加されています。
また、X軸のラベルが45度斜めに表示されています。
図8-1
図8-1では、仮想通貨(レバレッジ取引専用)の相関図を表示しています。
この図にはタイトルが追加されています。
また、X軸のラベルが45度斜めに表示されています。
-
相関図をPlotly Expressで作成する
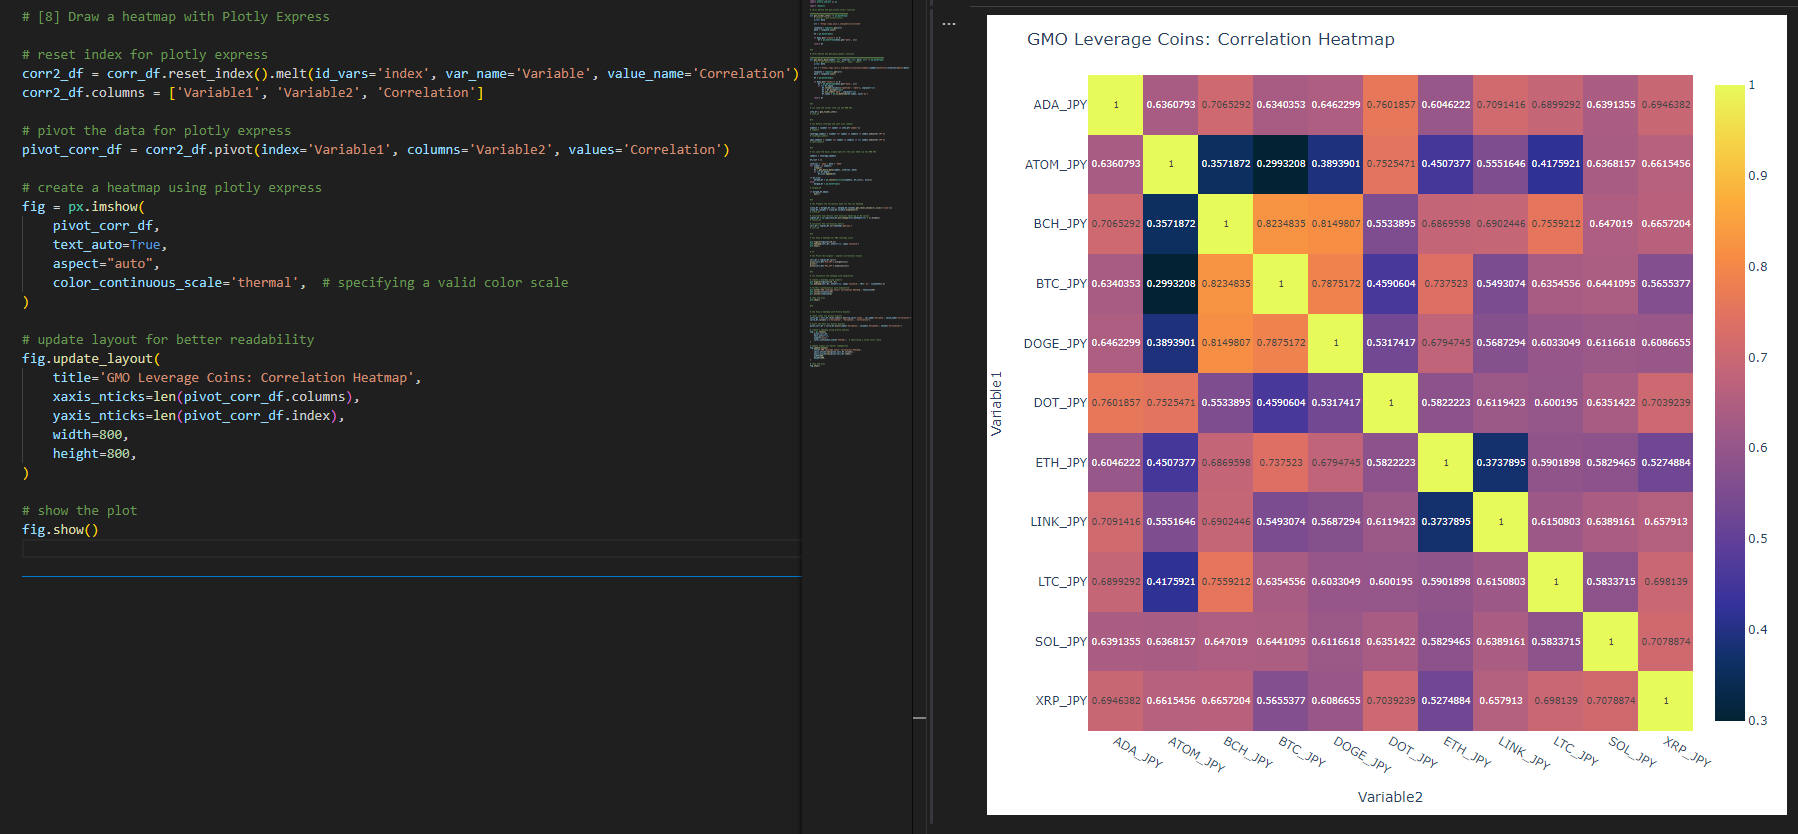
ここでは、Plotly Express(PX)を使用して相関図を作成しています。
PXを使うとインタラクティブな相関図を作成することができます。
また、Dashと連動させるとWebアプリから相関図を表示させることができます。
リスト9:
# [8] Draw a heatmap with Plotly Express

# reset index for plotly express
corr2_df = corr_df.reset_index().melt(id_vars='index', var_name='Variable', value_name='Correlation')
corr2_df.columns = ['Variable1', 'Variable2', 'Correlation']

# pivot the data for plotly express
pivot_corr_df = corr2_df.pivot(index='Variable1', columns='Variable2', values='Correlation')

# create a heatmap using plotly express
fig = px.imshow(
    pivot_corr_df,
    text_auto=True,
    aspect="auto",
    color_continuous_scale='thermal',  # specifying a valid color scale
)

# update layout for better readability
fig.update_layout(
    title='GMO Leverage Coins: Correlation Heatmap',
    xaxis_nticks=len(pivot_corr_df.columns),
    yaxis_nticks=len(pivot_corr_df.index),
    width=800,
    height=800,
)

# show the plot
fig.show()
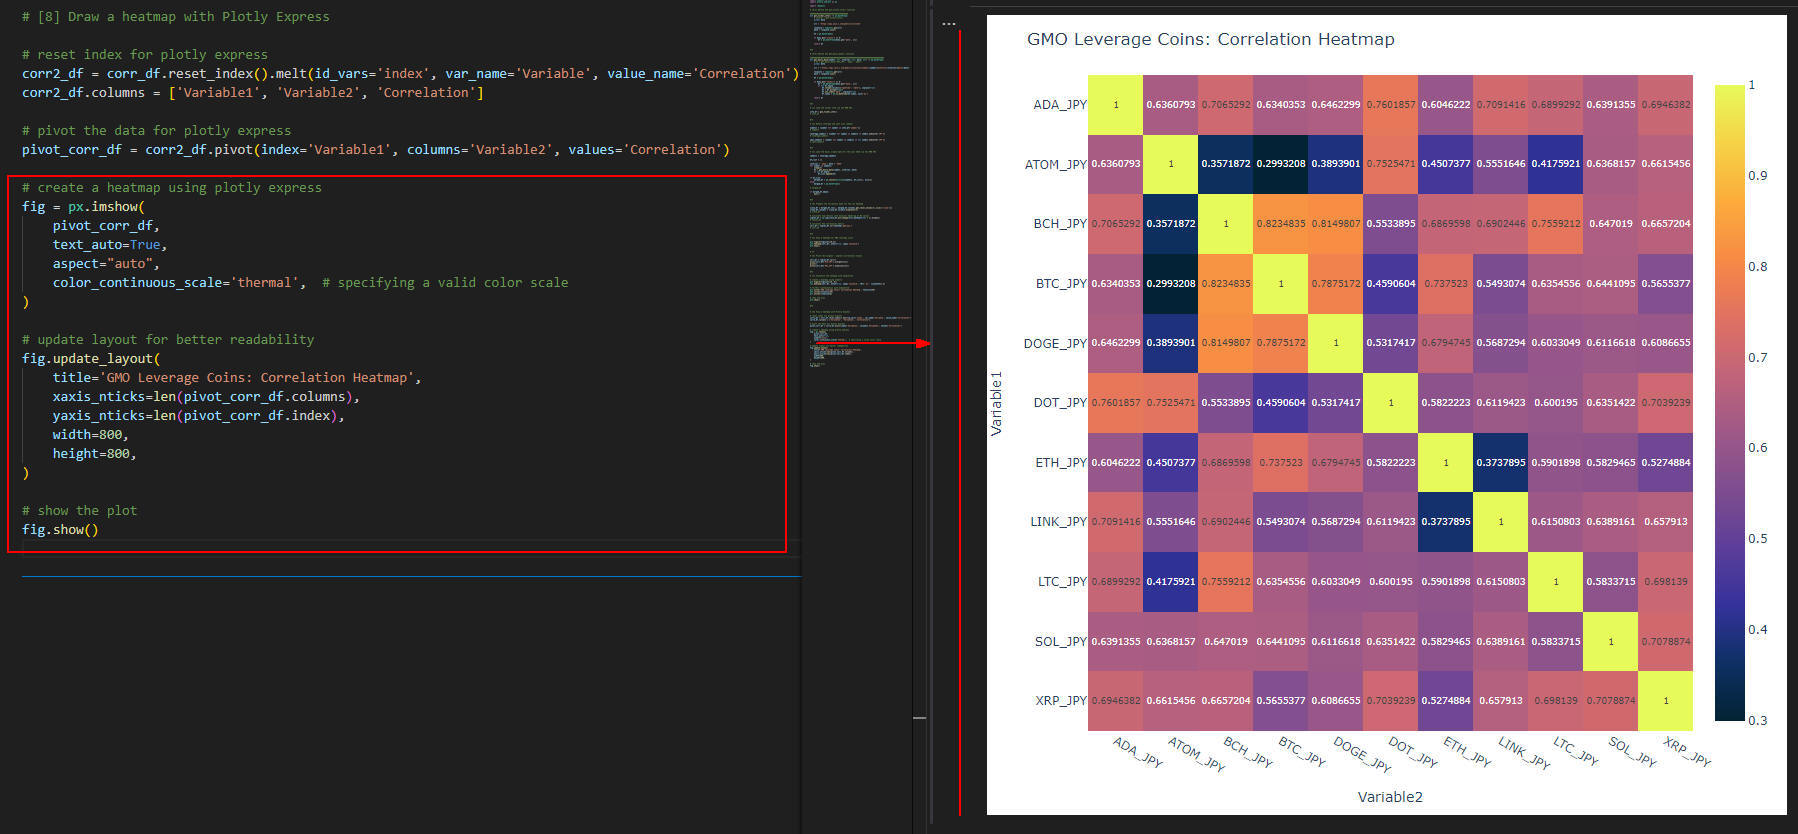 図9-1
図9-1では、Plotly Express(PX)で作成した相関図を表示しています。
図9-1
図9-1では、Plotly Express(PX)で作成した相関図を表示しています。
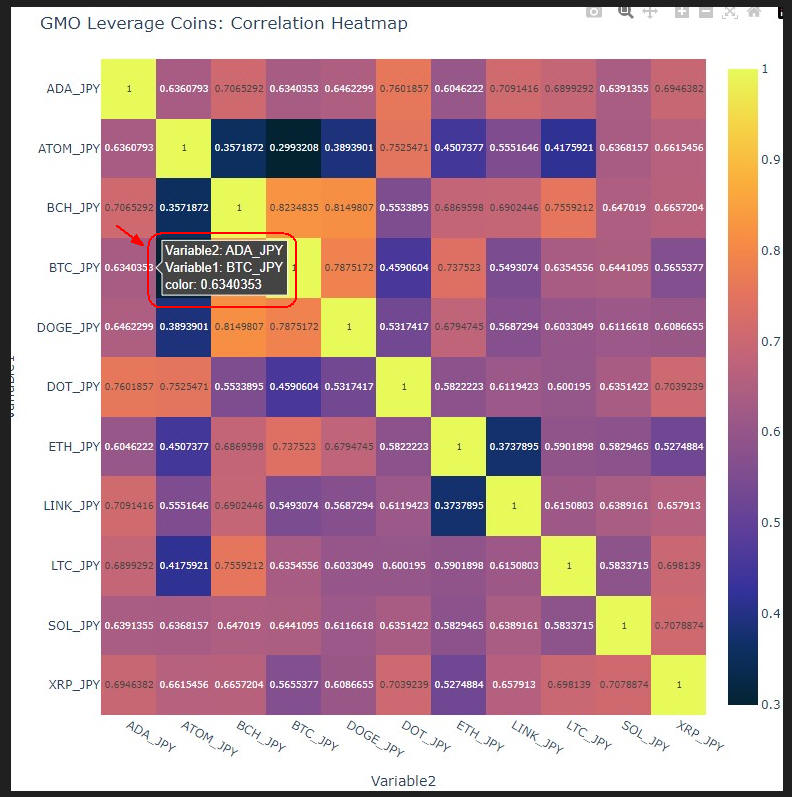 図9-2
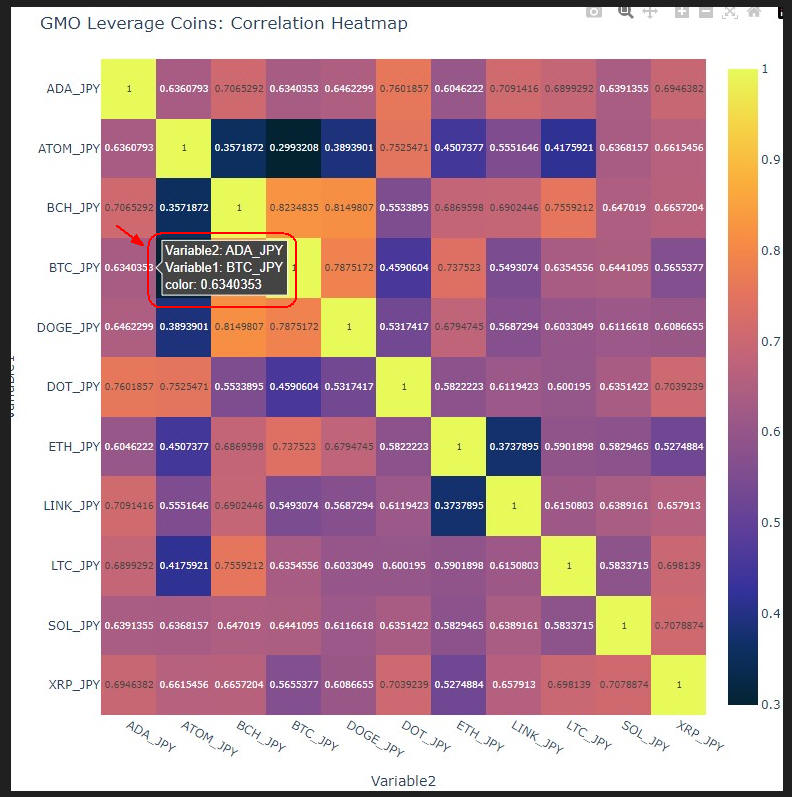
図9-2では、「ADA_JPY vs BTC_JPY」のセルにマウスをホバリングさせて「ラベル情報」を表示させています。
図9-2
図9-2では、「ADA_JPY vs BTC_JPY」のセルにマウスをホバリングさせて「ラベル情報」を表示させています。
-
この記事で紹介している全てのソースコードを掲載
ここでは、本記事で解説している全てのコードを掲載しています。
コード内にコメント「#%%」が挿入されていますが、 これはセル単位でコードを実行するときに必要になります。
コードをセル単位で実行するには、セル(「#%%」で囲まれた部分」)を選択して[Ctrl + Enter]で実行します。
すると、VS Codeの右側の「インタラクティブ・ウィンドウ」に実行結果が表示されます。
「インタラクティブ・ウィンドウ」からは、Pythonのコードを入力して[Shift + Enter」で実行させることもできます。
リスト10:
# Article159

# %%

# import the python libraries
from time import sleep

import numpy as np
import pandas as pd
import matplotlib.pyplot as plt
import seaborn as sns
import plotly.express as px

import requests

# [0-1] Define the get_ticker_info() function

######################################
def get_ticker_info() -> pd.DataFrame:
    # info_df = get_ticker_info()
    global data

    url = 'https://api.coin.z.com/public/v1/ticker'

    response = requests.get(url)
    data = response.json()

    df = pd.DataFrame()

    if data.get('status') == 0:
        df = pd.DataFrame(data.get('data', []))

    return df


#%%

# [0-2] Define the get_daily_data() function

##########################################################################
def get_daily_data(symbol: str, interval: str, date: str) -> pd.DataFrame:
    # df = get_daily_data('BTC_JPY', '1day', '2024')
    global data

    url = f'https://api.coin.z.com/public/v1/klines?symbol={symbol}&interval={interval}&date={date}'

    response = requests.get(url)
    data = response.json()

    df = pd.DataFrame()

    if data.get('status') == 0:
        df = pd.DataFrame(data.get('data', []))
        if not df.empty:
            df.rename(columns={'openTime': 'date'}, inplace=True)
            df = df.astype(float)
            df.set_index('date', inplace=True)
            df.index = pd.to_datetime(df.index, unit='ms')

    return df


#%%

# [1] Load the ticker info via the GMO API

info_df = get_ticker_info()
# info_df


#%%

# [2] Define leverage and spot coin symbols

symbols = [symbol for symbol in info_df['symbol']]
# symbols

leverage_symbols = [symbol for symbol in symbols if symbol.endswith('JPY')]
# leverage_symbols

spot_symbols = [symbol for symbol in symbols if not symbol.endswith('JPY')]
# spot_symbols


#%%

# [3] Load the daily crypto data for the year 2024 via the GMO API

symbols = leverage_symbols

df_list = []

interval = '1day'; date = '2024'
for symbol in symbols:
    sleep(3)
    df = get_daily_data(symbol, interval, date)
    if not df.empty:
        df_list.append(df)

if df_list:
    merged_df = pd.concat(dict(zip(symbols, df_list)), axis=1)
else:
    merged_df = pd.DataFrame()

# merged_df

if merged_df.empty:
    quit()


#%%

# [4] Prepare the correation data for the sns heatmap

close_df = merged_df.loc[:, merged_df.columns.get_level_values(1).isin(['close'])]
close_df.columns = close_df.columns.droplevel(1)
# close_df

# calculate log returns with explicit handling of NA values
logret_df = np.log(close_df.pct_change(fill_method=None) + 1).dropna()
# logret_df

# calculate the correlation matrix
corr_df = logret_df.corr(method='pearson')
# corr_df


#%%

# [5] Draw a heatmap for GMO leverage coins

plt.figure(figsize=(16,8))
sns.heatmap(corr_df, annot=True, cmap='coolwarm')
plt.show()


# %%

# [6] Print the largest / smalest correlation values

corr_df = logret_df.corr()
print(corr_df['BTC_JPY'].nlargest(11))
print()
print(corr_df['BTC_JPY'].nsmallest(11))


#%%

# [7] Customize the heatmap with matplotlib

# create a heatmap using seaborn
plt.figure(figsize=(16, 8))
sns.heatmap(corr_df, annot=True, cmap='coolwarm', fmt='.2f', linewidths=.5)

# further customization with matplotlib
plt.title('GMO Leverage Coins: Correlation Heatmap', fontsize=20)
plt.xticks(rotation=45)
plt.yticks(rotation=0)

# show the plot
plt.show()


#%%


# [8] Draw a heatmap with Plotly Express

# reset index for plotly express
corr2_df = corr_df.reset_index().melt(id_vars='index', var_name='Variable', value_name='Correlation')
corr2_df.columns = ['Variable1', 'Variable2', 'Correlation']

# pivot the data for plotly express
pivot_corr_df = corr2_df.pivot(index='Variable1', columns='Variable2', values='Correlation')

# create a heatmap using plotly express
fig = px.imshow(
    pivot_corr_df,
    text_auto=True,
    aspect="auto",
    color_continuous_scale='thermal',  # specifying a valid color scale
)

# update layout for better readability
fig.update_layout(
    title='GMO Leverage Coins: Correlation Heatmap',
    xaxis_nticks=len(pivot_corr_df.columns),
    yaxis_nticks=len(pivot_corr_df.index),
    width=800,
    height=800,
)

# show the plot
fig.show()