ビットコインの未来の価格を予測する
ここでは第3回目の「記事(Article124)」で作成したLSTMモデルを使用して、
ビットコインの未来の価格を予測します。
Visual Studio Code (VS Code)を起動したら、
シリーズ第4回目の「記事(Article125)」で作成したプログラムファイル(*.py)を開いて行359-451をコピペして追加します。
行362では予測する未来の日数を設定します。
ここでは明日から5日間の価格を予測するように設定しています。
行364-366ではビットコインの未来の価格を予測しています。
予測した価格は正規化されているので通常の価格に戻しています。
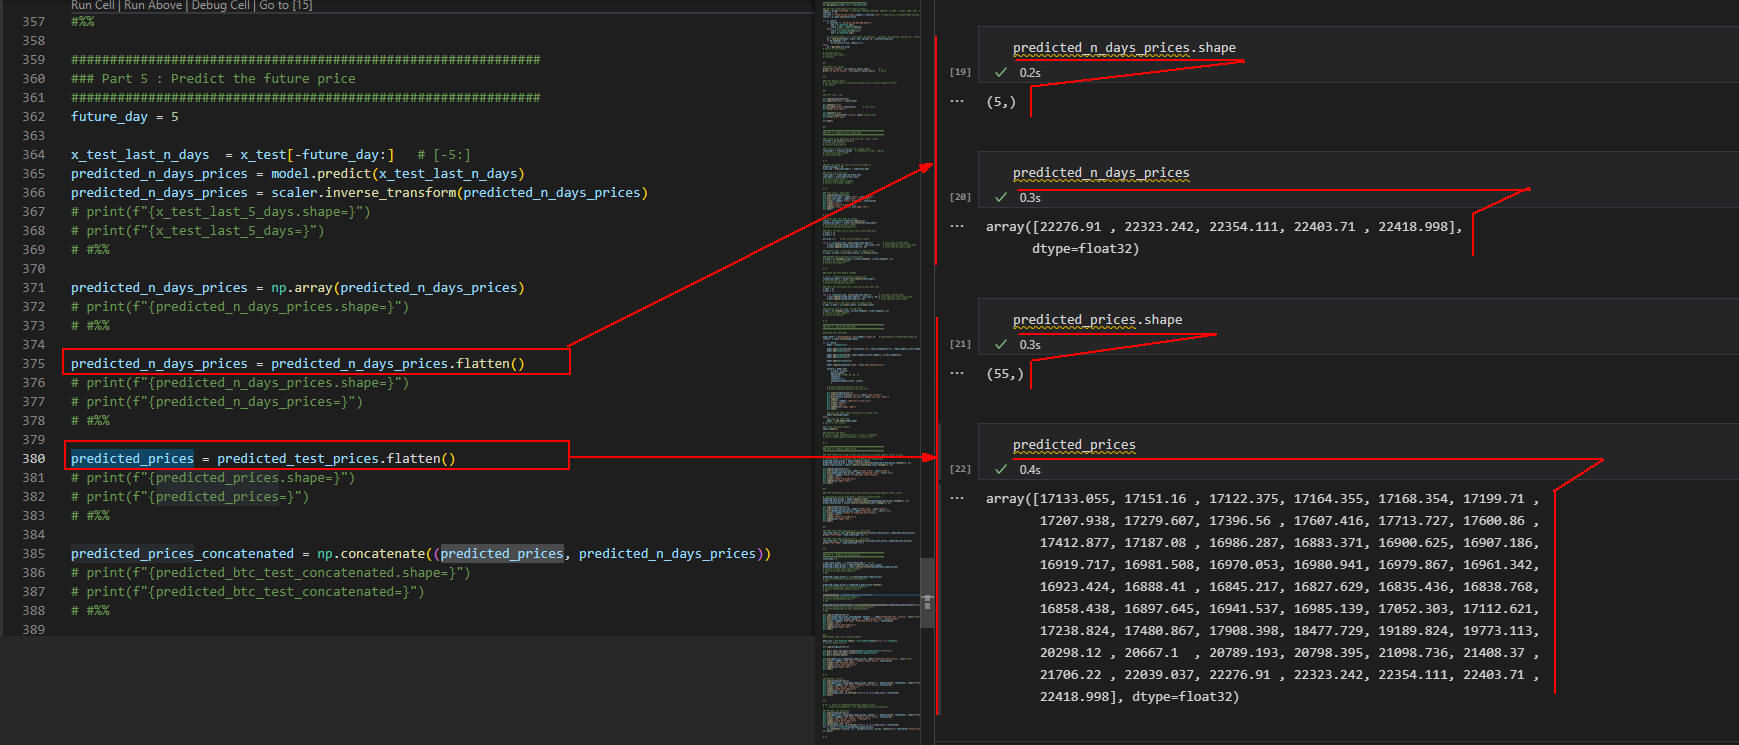
行371-380では予測した価格を連結するために、3次元の配列を1次元の配列に変換しています。
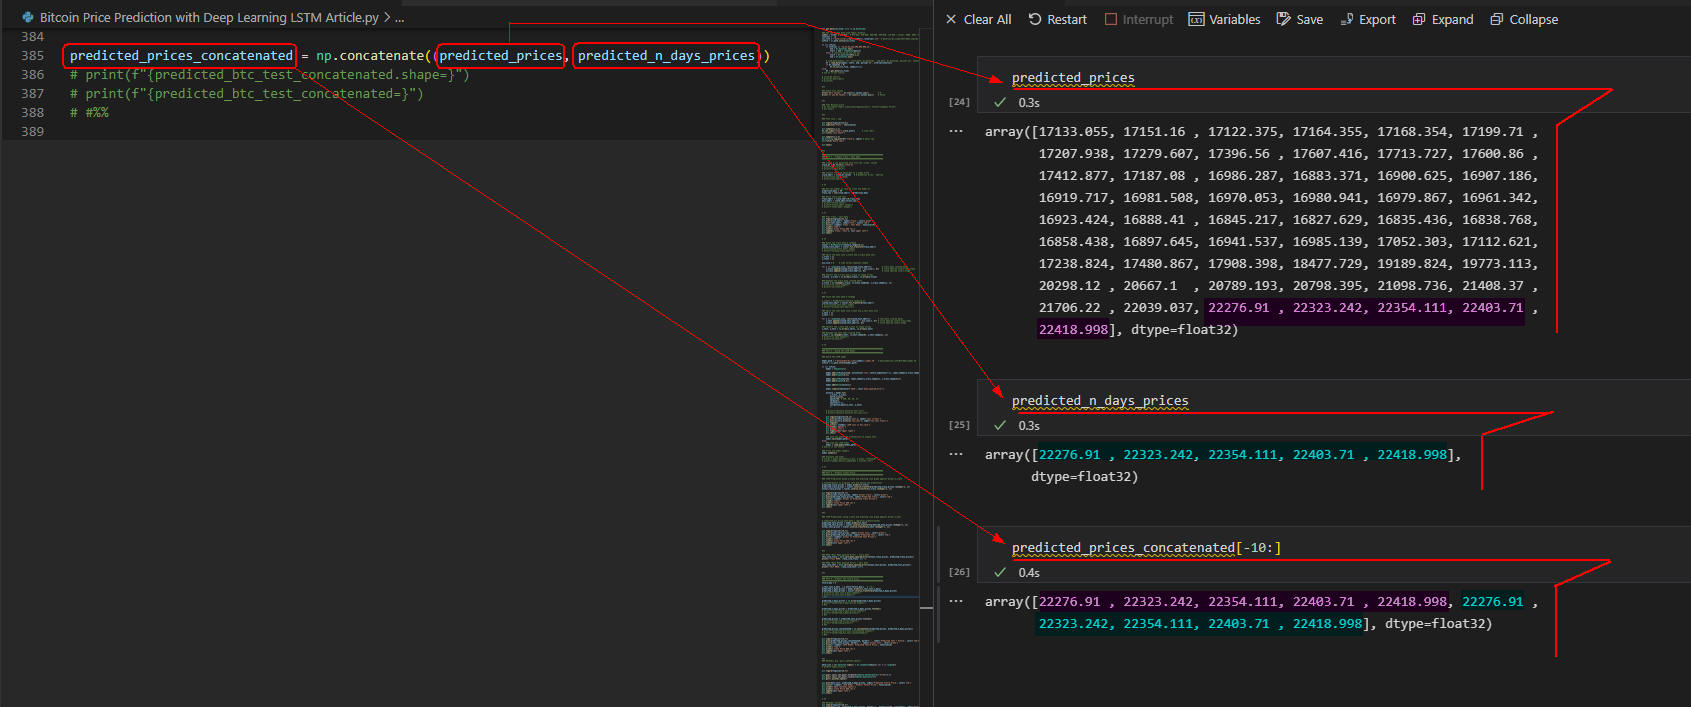
行385では過去の予測価格と未来の予測価格を結合(連結)しています。
行390-397では予測価格(未来の価格も含む)と実価格をグラフに表示しています。
行403ではグラフに表示する未来の日付を生成して変数に保存しています。
行406-417では未来の価格をグラフに表示しています。
グラフにの日付は「plt.gcf().autofmt_xdate()」を使用して表示しています。
行423-430では未来の価格をグラフに表示しています。
ここではグラフの日付を「plt.xticks()」で表示しています。
行439-449ではグラフに注釈として予測金額を表示しています。
注釈は「plt.annotate()」で表示します。
* Article.py:
#############################################################
### Part 5 : Predict the future price
#############################################################
future_day = 5

x_test_last_n_days  = x_test[-future_day:]
predicted_n_days_prices = model.predict(x_test_last_n_days)
predicted_n_days_prices = scaler.inverse_transform(predicted_n_days_prices)
# print(f"{x_test_last_5_days.shape=}")
# print(f"{x_test_last_5_days=}")
# #%%

predicted_n_days_prices = np.array(predicted_n_days_prices)
# print(f"{predicted_n_days_prices.shape=}")
# #%%

predicted_n_days_prices = predicted_n_days_prices.flatten()
# print(f"{predicted_n_days_prices.shape=}")
# print(f"{predicted_n_days_prices=}")
# #%%

predicted_prices = predicted_test_prices.flatten()
# print(f"{predicted_prices.shape=}")
# print(f"{predicted_prices=}")
# #%%

predicted_prices_concatenated = np.concatenate((predicted_prices, predicted_n_days_prices))
# print(f"{predicted_btc_test_concatenated.shape=}")
# print(f"{predicted_btc_test_concatenated=}")
# #%%

plt.figure(figsize=(16,7))
plt.plot(predicted_prices_concatenated, marker='.', label='Predicted Test + Future', color='red')
plt.plot(actual_test_prices, marker='.', label='Actual Test', color='green')
plt.title(f'{symbol} LSTM Model: Predicted Future Price', fontsize=18)
plt.xlabel('Time')
plt.ylabel('Close Price USD ($)')
plt.legend(loc='best')
plt.show()


#%%
### Method1: gca, gcf().autofmt_xdate()

date_list = [dt.datetime.today() + dt.timedelta(days=i) for i in range(5)]
# print(f"{date_list=}")

plt.figure(figsize=(16,7))

plt.gca().xaxis.set_major_formatter(mdates.DateFormatter('%Y/%m/%d'))
plt.gca().xaxis.set_major_locator(mdates.DayLocator())
plt.gcf().autofmt_xdate()

plt.plot(date_list, predicted_n_days_prices, label='Predected Future Price', color='red')
plt.title(f'{symbol} LSTM Model : Predict Future Price', fontsize=18)
plt.xlabel('Date (autofmt_xdate)')
plt.ylabel('Close Price USD ($)')
plt.legend(loc='best')
plt.show()


# %%

### Method2: xticks()
plt.figure(figsize=(16,7))
plt.plot(date_list, predicted_n_days_prices, marker='*', markersize=20, linewidth=1, label='Predected Future Price', color='red')
plt.title(f'{symbol} LSTM Model : Predict Future Price', fontsize=18)
plt.xlabel('Date (xticks + marker)')
plt.ylabel('Close Price USD ($)')
plt.legend(loc='best')
plt.xticks(date_list, [d.strftime('%m/%d') for d in date_list], rotation=45)
plt.show()


#%%

# for i, price in enumerate(predicted_n_days_prices):
#     print(f'price=${price:,.2f}, date={date_list[i]:%Y/%m/%d}')

### Method3: plt.annotate()
plt.figure(figsize=(16,7))
plt.plot(date_list, predicted_n_days_prices, marker='.', markersize=20, linewidth=1, label='Predected Future Price', color='red')
plt.title(f'{symbol} LSTM Model : Predict Future Price', fontsize=18)
plt.xlabel('Date (xticks + marker + annotate)')
plt.ylabel('Close Price USD ($)')
plt.legend(loc='best')
plt.xticks(date_list, [d.strftime('%m/%d') for d in date_list], rotation=45)
for i, price in enumerate(predicted_n_days_prices):
    plt.annotate(f'${price:.2f}', xy=(date_list[i], price), xytext=(5,5), textcoords='offset points', ha='center', va='bottom', color='green', fontsize=12)
plt.show()


# %%
 図1-1
ここではビットコインの明日(※)から5日間の未来の価格を予測します。
明日(1/31)から5日間の未来の価格を予測するには、
検証用データ(Test)から直近の5日間(1/26~1/30)の実価格を取得して予測します。
変数「x_test_last_n_days」には検証データの「1/26~1/30」の実価格が正規化されて格納されています。
「model.predict()」で予測した未来の価格は変数「predicted_n_day_prices」に格納されます。
予測価格は正規化されているので「scaler.inverse_transform()」で通常の価格に戻します。
さらに戻した予測価格は結合するために1次元の配列変数に格納します。
ここでは「predicted_n_day_prices」と「predicted_prices」の型と内容を表示しています。
※Yahoo! Financeのデータは米国にあるので時差の関係で1日遅れになります。
したがって、日本時間の1/31は1/30となります。正確には地域により異なります。
 図1-2
ここでは変数「predicted_prices」と「predicted_n_days_prices」の内容を表示しています。
「predicted_prices」には検証データ(Test)の予測価格が格納されています。
「predicted_n_days_prices」には未来(1/31~2/4)の予測価格が格納されています。
「predicted_prices_concatenated」には、上記の2つの変数を結合したデータが格納されています。
 図1-3
ここでは「actual_test_prices」に格納されている実価格と、
「predicted_prices_concatenated」に格納されている予測価格(未来の予測価格も含む)をグラフに表示しています。
グラフの「丸」で囲ってある部分が未来の予測価格です。
本シリーズの全てのソースコードを掲載
ここでは、第1回目から第5回目までに解説したPythonの全てのコードを掲載しています。
# Bitcoin Price Prediction with Deep Learning LSTM Article.py
#%%

#############################################################
### Part 1 : Load / prepare crypto data
#############################################################

### Import the libraires
import os
os.environ['TF_CPP_MIN_LOG_LEVEL'] = '3'

import math
import numpy as np              # pip install numpy
import matplotlib.pyplot as plt # pip install matplotlib
import matplotlib.dates as mdates
import pandas as pd             # pip install pandas
import datetime as dt
from datetime import timedelta
from time import sleep

import yfinance as yf           # pip install yfinance

# pip install tensorflow-cpu
# pip install sklearn
# pip install scikit-learn

from sklearn.preprocessing import MinMaxScaler
from keras import models
from keras.layers import Dense, Dropout, LSTM
from keras.models import Sequential
from keras.models import load_model

from sklearn.metrics import mean_squared_error, mean_absolute_error, explained_variance_score, r2_score
from sklearn.metrics import mean_poisson_deviance, mean_gamma_deviance, accuracy_score

import warnings
warnings.simplefilter('ignore')

plt.style.use('fivethirtyeight')


# %%

######################################################################################################################################
def load_data(symbol: str, start_date: dt.datetime , end_date: dt.datetime, period='1d', interval='1d', prepost=True) -> pd.DataFrame:
    # valid periods: 1d,5d,1mo,3mo,6mo,1y,2y,5y,10y,ytd,max
    # fetch data by interval (including intraday if period < 60 days)
    # valid intervals: 1m,2m,5m,15m,30m,60m,90m,1h,1d,5d,1wk,1mo,3mo
    try:
        end_date = end_date + timedelta(days=1)
        start_date_str = dt.datetime.strftime(start_date, "%Y-%m-%d")
        end_date_str = dt.datetime.strftime(end_date, "%Y-%m-%d")
        print(f"Loading data for {symbol}: start_date={start_date_str}, end_date={end_date_str}, {period=}, {interval=}")
        df = yf.download(symbol, start=start_date_str, end=end_date_str, period=period, interval=interval, prepost=prepost)
        # Date     Open          High           Low         Close     Adj Close       Volume   Symbol : interval=1d,5d,1wk,1mo,3mo
        # Datetime Open          High           Low         Close     Adj Close       Volume   Symbol : interval=1m,2m,5m,15m,30m,60m,90m,1h

        # Add symbol
        df['Symbol'] = symbol

        # Reset index
        df.reset_index(inplace=True)

        # Rename Date or Datetime column name to Time
        if interval in '1m,2m,5m,15m,30m,60m,90m,1h':
            df.rename(columns={'Datetime': 'Time'}, inplace=True)
        else: # interval=1d,5d,1wk,1mo,3mo
            df.rename(columns={'Date': 'Time'}, inplace=True)

        # Convert column names to lower case
        df.columns = df.columns.str.lower()

        return df
    except:
        print('Error loading data for ' + symbol)
        return pd.DataFrame()

############################################
def get_data(csv_file: str) -> pd.DataFrame:
    print(f"Loading data for {symbol}: {csv_file} ")
    df = pd.read_csv(csv_file)
    # time,open,high,low,vlose,ddj close,volume,symbol
    df['time'] = pd.to_datetime(df['time'])
    # df.set_index('time', inplace=True)
    return df

### Get the crypto data from Yahoo! Finance
symbol = ticker ='BTC-USD'  # BTC-USD, ETH-USD, BCH-USD, XRP-USD, LTC-USD ; ticker: GOOG, AAPL, FB=>META, AMZN, MSFT
interval = '1d'
csv_file = f"data/csv/dl_crypto({symbol})_{interval}.csv"  # data/csv/dl_crypto(BTC-USD)_{1d|1m}.csv
isFile = os.path.isfile(csv_file)

if not isFile:
    if interval in '1m,2m,5m,15m,30m,60m,90m,1h':
        end = dt.datetime.now()
        start = end - timedelta(days=7)
    else: # interval=1d,5d,1wk,1mo,3mo
        start = dt.datetime(2014,1,1)
        end = dt.datetime.now()

    # load_data(symbol: str, start_date: dt.datetime , end_date: dt.datetime, period='1d', interval={'1m'|'1d'}, prepost=True) -> pd.DataFrame:
    df = load_data(symbol, start, end, period='1d', interval=interval)
    if df.shape[0] > 0:
        df.to_csv(csv_file, index=False)
else:
    df = get_data(csv_file)
# end of if not isFile:

# print(df.info())
# print(df.describe())
# print(df)


#%%

### Check null values
print('Null Values:', df.isnull().values.sum())         # 0
print('If any NA values:', df.isnull().values.any())    # False


#%%

### Plot Bitcoin price
# df.set_index("time").close.plot(figsize=(16,7), title=f"{symbol} Price")
# plt.show()


#%%

### Plot Line / Lag

plt.figure(figsize=(16,8))
plt.suptitle('Plots', fontsize=22)

plt.subplot(1,2,1)
df.set_index("time").close.plot()       # line chart
plt.title('Line Chart')

plt.subplot(1,2,2)
pd.plotting.lag_plot(df['close'], lag=1) # daily lag
plt.title('Daily Lag')

plt.show()


#%%

#############################################################
### Part 2 : Prepare Train / Test data
#############################################################

### Create a new dataframe with only the 'close' column
close_df = df.filter(['close'])
# print(type(close_df))
# print(f"{close_df=}")

### Convert filtered dataframe to a numpy array
close_ndarr = close_df.values   # N-dimension array : ndarray
# print(close_ndarr.shape)
# print(close_ndarr)


# %%

### Get the number of rows to train the model on
prediction_days = 60
train_len = len(close_ndarr) - prediction_days

### Split train and test
train_ndarr = close_ndarr[0:train_len]
test_ndarr = close_ndarr[train_len:]
# print(f"{train_len=}")
# print(f"{train_ndarr.shape}")
# print(f"{test_ndarr.shape}")


# %%

### Plot train / test data
plt.figure(figsize=(13,7))
plt.plot(train_ndarr, label='Train', color='green')
plt.plot(test_ndarr, label='Test', color='red')
plt.title(f'{symbol} Train / Test Data', fontsize=18)
plt.xlabel('Time')
plt.ylabel('Close Price USD ($)')
plt.legend(['Train','Test'], loc='best')
plt.show()


# %%

### Scale the train data & reshape
scaler = MinMaxScaler(feature_range=(0,1))
scaled_train_ndarr = scaler.fit_transform(train_ndarr)
# print(scaled_train_ndarr.shape)
# print(f"{scaled_train_ndarr=}")

### Split the data into x_train and y_train data sets
x_train = []
y_train = []

win_size = 5     # time series sequence length

for i in range(win_size, len(scaled_train_ndarr)):          # train_data (scaled data)
    x_train.append(scaled_train_ndarr[i - win_size:i, 0])   # slice ndarray [start:stop,step]
    y_train.append(scaled_train_ndarr[i, 0])                # slice ndarray [start,step]

### Convert the x_train and y_train to numpy arrays
x_train, y_train = np.array(x_train), np.array(y_train)

### Reshape the train data (scaled data)
x_train = np.reshape(x_train, (x_train.shape[0], x_train.shape[1], 1))
# print(f"{x_train.shape=}")
# print(f"{x_train=}")


# %%

### Scale the test data & reshape

# scaler = MinMaxScaler(feature_range=(0,1))
scaled_test_ndarr = scaler.fit_transform(test_ndarr)
# print(scaled_test_ndarr.shape)
# print(f"{scaled_test_ndarr=}")

### Split the test data into x_test and y_test data sets
x_test = []
y_test = []

for i in range(win_size, len(scaled_test_ndarr)):       # test_data (scaled data)
    x_test.append(scaled_test_ndarr[i - win_size:i, 0]) # slice ndarray [start:stop,step]
    y_test.append(scaled_test_ndarr[i, 0])              # slice ndarray [start,step]

### Convert the x_test and y_test to numpy arrays
x_test, y_test = np.array(x_test), np.array(y_test)

### Reshape the test data (scaled data)
x_test = np.reshape(x_test, (x_test.shape[0], x_test.shape[1], 1))
# print(f"{x_test.shape=}")
# print(f"{x_test=}")


# %%

#############################################################
### Part 3 : Build the LSTM model
#############################################################

### Build the LSTM model

model_path = f'data/model/dl_lstm({symbol})_model.h5'   # data/model/dl_lstm(BTC-USD)_model.h5
isFile = os.path.isfile(model_path)

if not isFile:
    model = Sequential()

    model.add(LSTM(units=128, activation='relu',return_sequences=True, input_shape=(x_train.shape[1], x_train.shape[2])))
    model.add(Dropout(0.2))

    model.add(LSTM(units=64, input_shape=(x_train.shape[1], x_train.shape[2])))
    model.add(Dropout(0.2))

    model.add(Dense(units=1))

    model.compile(optimizer='adam', loss='mean_squared_error')

    history = model.fit(
        x_train, y_train,
        batch_size=32,
        epochs=60, # 100, 60, 30, 10
        verbose=1,
        shuffle=False,
        validation_data=(x_test, y_test)
        )

    # print(f"{history.history['loss']=}")
    # print(f"{history.history['val_loss']=}")

    plt.figure(figsize=(16,7))
    plt.plot(history.history['loss'], label='loss (train)')
    plt.plot(history.history['val_loss'], label='val_loss (test)')
    plt.legend()
    plt.title(f'{symbol} LSTM Loss vs Val_loss')
    plt.xlabel('Epochs')
    plt.ylabel('Loss')
    plt.legend(loc='best')
    plt.show()

    ### Save the model and architecture to single file
    model.save(model_path)
else:
    ### Load the LSTM model
    model = load_model(model_path)
# end of if not isFile:

### Print the model summary
model.summary()

### Evaluate the model
# scores = model.evaluate(x_train, y_train, verbose=0)
# print(f"{model.metrics_names[0]} = {scores:.2%}")


# %%

#############################################################
### Part 4 : Predict Crypto Price
#############################################################

### LSTM Prediction using x_train and plotting line graph against Actual y_train

# Transformation to original form and making the predictions
predicted_train_prices = model.predict(x_train)
predicted_train_prices = scaler.inverse_transform(predicted_train_prices.reshape(-1, 1))
actual_train_prices = scaler.inverse_transform(y_train.reshape(-1, 1))

plt.figure(figsize=(16,7))
plt.plot(actual_train_prices, label='Actual Train', color='green')
plt.plot(predicted_train_prices, label='Predicted Train', color='red')
plt.title(f'{symbol} Actual vs Predicted Train Prices')
plt.xlabel('Time')
plt.ylabel('Close Price USD ($)')
plt.legend(loc='best')
plt.show()


#%%

### LSTM Predictions using x_test and plotting line graph against Actual y_test

# predicted_btc_price_test_data = regressor.predict(testX)
predicted_test_prices = model.predict(x_test)
predicted_test_prices = scaler.inverse_transform(predicted_test_prices.reshape(-1, 1))
actual_test_prices = scaler.inverse_transform(y_test.reshape(-1, 1))

plt.figure(figsize=(16,7))
plt.plot(actual_test_prices, label='Actual Test', color='green')
plt.plot(predicted_test_prices, label='Predicted Test', color='red')
plt.title(f'{symbol} Actual vs Predicted Test Prices')
plt.xlabel('Time')
plt.ylabel('Close Price USD ($)')
plt.legend(loc='best')
plt.show()


#%%

### RMSE (Root Mean Squared Error) - Train Data
rmse_lstm_train = math.sqrt(mean_squared_error(actual_train_prices, predicted_train_prices))
print(f"Train RMSE: {rmse_lstm_train:.3%} ")

### RMSE (Root Mean Squared Error) - Test Data
rmse_lstm_test = math.sqrt(mean_squared_error(actual_test_prices, predicted_test_prices))
print(f"Test RMSE: {rmse_lstm_test:.3%}")


#%%

#############################################################
### Part 5 : Predict the future price
#############################################################
future_day = 5

x_test_last_n_days  = x_test[-future_day:]   # [-5:]
predicted_n_days_prices = model.predict(x_test_last_n_days)
predicted_n_days_prices = scaler.inverse_transform(predicted_n_days_prices)
# print(f"{x_test_last_5_days.shape=}")
# print(f"{x_test_last_5_days=}")
# #%%

predicted_n_days_prices = np.array(predicted_n_days_prices)
# print(f"{predicted_n_days_prices.shape=}")
# #%%

predicted_n_days_prices = predicted_n_days_prices.flatten()
# print(f"{predicted_n_days_prices.shape=}")
# print(f"{predicted_n_days_prices=}")
# #%%

predicted_prices = predicted_test_prices.flatten()
# print(f"{predicted_prices.shape=}")
# print(f"{predicted_prices=}")
# #%%

predicted_prices_concatenated = np.concatenate((predicted_prices, predicted_n_days_prices))
# print(f"{predicted_btc_test_concatenated.shape=}")
# print(f"{predicted_btc_test_concatenated=}")
# #%%

plt.figure(figsize=(16,7))
plt.plot(predicted_prices_concatenated, marker='.', label='Predicted Test + Future', color='red')
plt.plot(actual_test_prices, marker='.', label='Actual Test', color='green')
plt.title(f'{symbol} LSTM Model: Predicted Future Price', fontsize=18)
plt.xlabel('Time')
plt.ylabel('Close Price USD ($)')
plt.legend(loc='best')
plt.show()


#%%
### Method1: gca, gcf().autofmt_xdate()

date_list = [dt.datetime.today() + dt.timedelta(days=i) for i in range(5)]
# print(f"{date_list=}")

plt.figure(figsize=(16,7))

plt.gca().xaxis.set_major_formatter(mdates.DateFormatter('%Y/%m/%d'))
plt.gca().xaxis.set_major_locator(mdates.DayLocator())
plt.gcf().autofmt_xdate()

plt.plot(date_list, predicted_n_days_prices, label='Predected Future Price', color='red')
plt.title(f'{symbol} LSTM Model : Predict Future Price', fontsize=18)
plt.xlabel('Date (autofmt_xdate)')
plt.ylabel('Close Price USD ($)')
plt.legend(loc='best')
plt.show()


# %%

### Method2: xticks()
plt.figure(figsize=(16,7))
plt.plot(date_list, predicted_n_days_prices, marker='*', markersize=20, linewidth=1, label='Predected Future Price', color='red')
plt.title(f'{symbol} LSTM Model : Predict Future Price', fontsize=18)
plt.xlabel('Date (xticks + marker)')
plt.ylabel('Close Price USD ($)')
plt.legend(loc='best')
plt.xticks(date_list, [d.strftime('%m/%d') for d in date_list], rotation=45)
plt.show()


#%%

# for i, price in enumerate(predicted_n_days_prices):
#     print(f'price=${price:,.2f}, date={date_list[i]:%Y/%m/%d}')

### Method3: plt.annotate()
plt.figure(figsize=(16,7))
plt.plot(date_list, predicted_n_days_prices, marker='.', markersize=20, linewidth=1, label='Predected Future Price', color='red')
plt.title(f'{symbol} LSTM Model : Predict Future Price', fontsize=18)
plt.xlabel('Date (xticks + marker + annotate)')
plt.ylabel('Close Price USD ($)')
plt.legend(loc='best')
plt.xticks(date_list, [d.strftime('%m/%d') for d in date_list], rotation=45)
for i, price in enumerate(predicted_n_days_prices):
    plt.annotate(f'${price:.2f}', xy=(date_list[i], price), xytext=(5,5), textcoords='offset points', ha='center', va='bottom', color='green', fontsize=12)
plt.show()


# %%