まずは本シリーズの第3回目の「LSTMモデルを作成する」を参考にしてGMOコインのLSTMモデルを作成してファイルに保存する
ここでは、GMOコインからダウンロードした仮想通貨(BTC, ETH, LTC)の価格データを読み込んでLSTMのモデルを作成してファイルに保存します。
GMOコインから仮想通貨の価格データをダウンロードしてCSVファイルに保存する方法は、
「BOT作成シリーズ(CSVクラス, APIクラス)」で解説しています。
Build LSTM Model.py:
# Build LSTM Model.py
#%%

### Import the libraires
import os
os.environ['TF_CPP_MIN_LOG_LEVEL'] = '3'

import math
import numpy as np
import matplotlib.pyplot as plt
import matplotlib.dates as mdates
import pandas as pd
import datetime as dt
from datetime import timedelta
from time import sleep

from sklearn.preprocessing import MinMaxScaler
from keras import models
from keras.layers import Dense, Dropout, LSTM
from keras.models import Sequential
from keras.models import load_model

from sklearn.metrics import mean_squared_error, mean_absolute_error, explained_variance_score, r2_score
from sklearn.metrics import mean_poisson_deviance, mean_gamma_deviance, accuracy_score

import warnings
warnings.simplefilter('ignore')
plt.style.use('fivethirtyeight')

# %%

############################################
def get_data(csv_file: str) -> pd.DataFrame:
    print(f"Loading data for {symbol}: {csv_file} ")
    df = pd.read_csv(csv_file)
    # price, side, size, timestamp
    df['time'] = pd.to_datetime(df['timestamp'])
    return df

### Get the crypto data from the csv file
symbol = 'BTC_JPY'  # BTC_JPY, ETH_JPY, LTC_JPY
csv_file = f"root/master({symbol}).csv" # root/master(BTC_JPY).csv
isFile = os.path.isfile(csv_file)
if not isFile:
    print(f"{csv_file} is not found => quit")
df = get_data(csv_file)

#%%

df.dropna(inplace=True)

### Check null values
print('Null Values:', df.isnull().values.sum())
print('If any NA values:', df.isnull().values.any())

### Plot Line / Lag

plt.figure(figsize=(16,8))
plt.suptitle('Plots', fontsize=22)

plt.subplot(1,2,1)
df.set_index("time").price.plot()       # line chart
plt.title('Line Chart')

plt.subplot(1,2,2)
pd.plotting.lag_plot(df['price'], lag=1) # secondly lag
plt.title('Secondly Lag')

plt.show()

#%%

### Prepare Train / Test data

### Create a new dataframe with only the 'price' column
close_df = df.filter(['price'])

### Convert filtered dataframe to a numpy array
close_ndarr = close_df.values   # N-dimension array : ndarray

### Get the number of rows to train the model on
prediction_days = int(close_ndarr.shape[0] * 0.2)
train_len = len(close_ndarr) - prediction_days

### Split train and test
train_ndarr = close_ndarr[0:train_len]
test_ndarr = close_ndarr[train_len:]

### Plot train / test data
plt.figure(figsize=(13,7))
plt.plot(train_ndarr, label='Train', color='green')
plt.plot(test_ndarr, label='Test', color='red')
plt.title(f'{symbol} Train / Test Data', fontsize=18)
plt.xlabel('Time')
plt.ylabel('Close Price Yen (¥)')
plt.legend(['Train','Test'], loc='best')
plt.show()

# %%

### Scale the train data & reshape
scaler = MinMaxScaler(feature_range=(0,1))
scaled_train_ndarr = scaler.fit_transform(train_ndarr)

### Split the data into x_train and y_train data sets
x_train = []
y_train = []

win_size = 60   # 5,10,30,60,... time series sequence length

for i in range(win_size, len(scaled_train_ndarr)):          # train_data (scaled data)
    x_train.append(scaled_train_ndarr[i - win_size:i, 0])   # slice ndarray [start:stop,step]
    y_train.append(scaled_train_ndarr[i, 0])                # slice ndarray [start,step]

### Convert the x_train and y_train to numpy arrays
x_train, y_train = np.array(x_train), np.array(y_train)

### Reshape the train data (scaled data)
x_train = np.reshape(x_train, (x_train.shape[0], x_train.shape[1], 1))

### Scale the test data & reshape

# scaler = MinMaxScaler(feature_range=(0,1))
scaled_test_ndarr = scaler.fit_transform(test_ndarr)

### Split the test data into x_test and y_test data sets
x_test = []
y_test = []

for i in range(win_size, len(scaled_test_ndarr)):       # test_data (scaled data)
    x_test.append(scaled_test_ndarr[i - win_size:i, 0]) # slice ndarray [start:stop,step]
    y_test.append(scaled_test_ndarr[i, 0])              # slice ndarray [start,step]

### Convert the x_test and y_test to numpy arrays
x_test, y_test = np.array(x_test), np.array(y_test)

### Reshape the test data (scaled data)
x_test = np.reshape(x_test, (x_test.shape[0], x_test.shape[1], 1))

# %%

### Build the LSTM model

model_path = f'root/lstm_model({symbol}).h5'   # root/lstm_model(BTC_JPY).h5
isFile = os.path.isfile(model_path)

if not isFile:
    model = Sequential()
    model.add(LSTM(units=128, activation='relu',return_sequences=True, input_shape=(x_train.shape[1], x_train.shape[2])))
    model.add(Dropout(0.2))
    model.add(LSTM(units=64, input_shape=(x_train.shape[1], x_train.shape[2])))
    model.add(Dropout(0.2))
    model.add(Dense(units=1))
    model.compile(optimizer='adam', loss='mean_squared_error')
    history = model.fit(
        x_train, y_train,
        batch_size=32,
        epochs=60, # 600, 100, 60, 30, 10
        verbose=1,
        shuffle=False,
        validation_data=(x_test, y_test)
        )

    plt.figure(figsize=(16,7))
    plt.plot(history.history['loss'], label='loss (train)')
    plt.plot(history.history['val_loss'], label='val_loss (test)')
    plt.legend()
    plt.title(f'{symbol} LSTM Loss vs Val_loss')
    plt.xlabel('Epochs')
    plt.ylabel('Loss')
    plt.legend(loc='best')
    plt.show()

    ### Save the model and architecture to single file
    model.save(model_path)
else:
    ### Load the LSTM model
    model = load_model(model_path)
# end of if not isFile:

### Print the model summary
model.summary()

# %%
 図1-1
図1-1ではビットコインの価格ファイル「master(BTC_JPY).csv」を取り込んで、PandasのDataFrameに格納しています。
DataFrameは「price, side, size, timestamp, time」の列(カラム)から構成されています。
ここでは「price」のカラムのみ使用します。
図1-1
図1-1ではビットコインの価格ファイル「master(BTC_JPY).csv」を取り込んで、PandasのDataFrameに格納しています。
DataFrameは「price, side, size, timestamp, time」の列(カラム)から構成されています。
ここでは「price」のカラムのみ使用します。
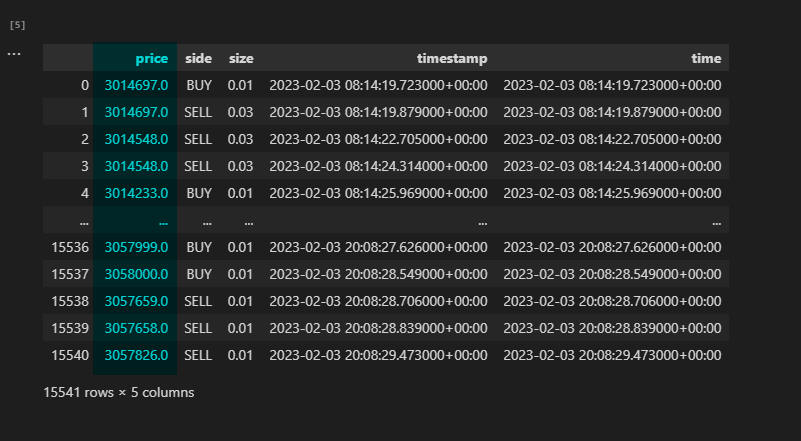 図1-2
図1-2では、DataFrameの先頭と最後のデータを5件づつ表示しています。
「price」のカラムにはビットコイン(BTC)の価格が表示されています。
1BTCが約300万円の価格になっています。
図1-2
図1-2では、DataFrameの先頭と最後のデータを5件づつ表示しています。
「price」のカラムにはビットコイン(BTC)の価格が表示されています。
1BTCが約300万円の価格になっています。
 図1-3
図1-3ではDataFrameに不正(NaN: Not a Number)な値がないかチェックしています。
「0」が表示されているので不正な値がないことが確認できました。
グラフにはビットコインの価格を線グラフとラググラフに表示しています。
ラググラフには秒単位の価格の散布図が表示されています。
図1-3
図1-3ではDataFrameに不正(NaN: Not a Number)な値がないかチェックしています。
「0」が表示されているので不正な値がないことが確認できました。
グラフにはビットコインの価格を線グラフとラググラフに表示しています。
ラググラフには秒単位の価格の散布図が表示されています。
 図1-4
図1-4ではビットコインの学習用データ(Train)と検証用データ(Test)をグラフに表示しています。
学習用データと検証用データは「8:2」の比率で分割しています。
図1-4
図1-4ではビットコインの学習用データ(Train)と検証用データ(Test)をグラフに表示しています。
学習用データと検証用データは「8:2」の比率で分割しています。
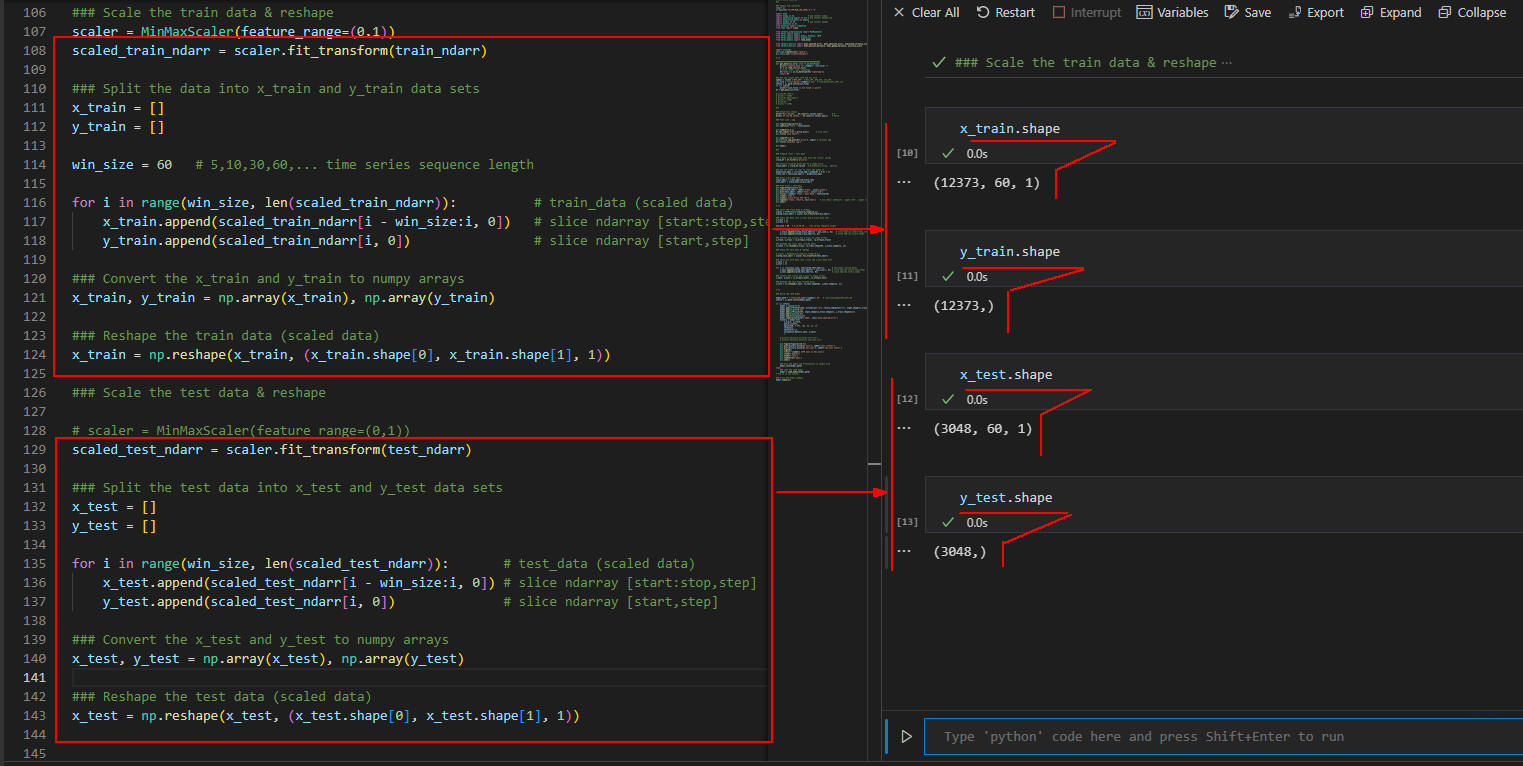 図1-5
図1-5では学習用(Train)データと検証用(Train)データを[x,y」に分割したときの「データ形式: shape」を表示しています。
学習用データには「12373」件のデータが格納されています。
検証用データには「3048」件のデータが格納されています。
ウィンドウ・サイズは「60」に設定しています。
図1-5
図1-5では学習用(Train)データと検証用(Train)データを[x,y」に分割したときの「データ形式: shape」を表示しています。
学習用データには「12373」件のデータが格納されています。
検証用データには「3048」件のデータが格納されています。
ウィンドウ・サイズは「60」に設定しています。
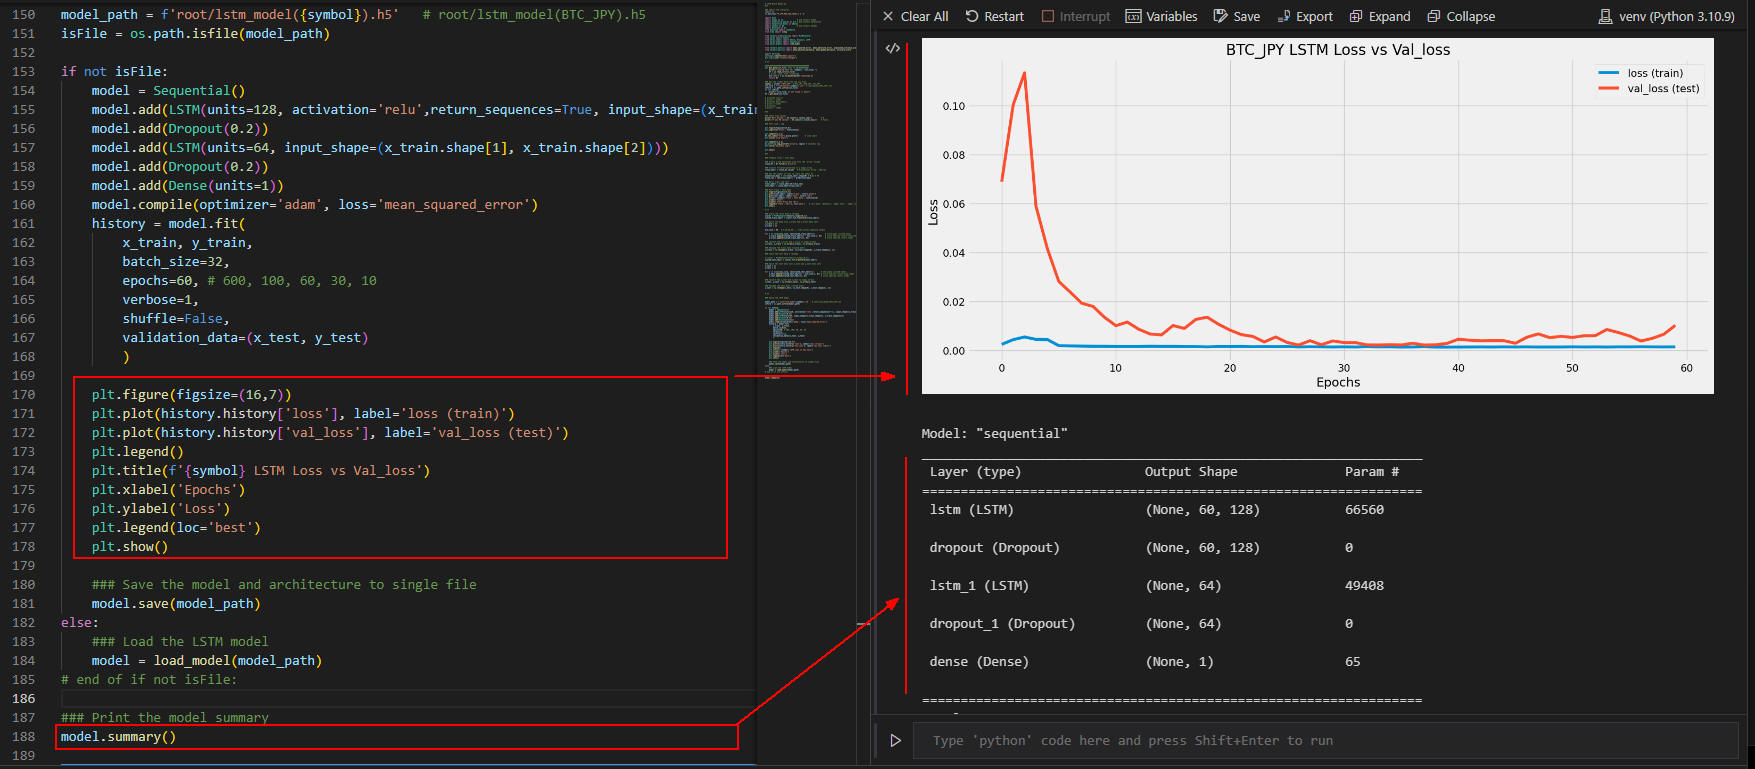 図1-6
図1-6では、LSTMモデルの学習時の欠損値をグラフで表示しています。
欠損値はほぼ理想的な値になっていると思います。
最後にLSTMモデルのサマリーを表示しています。
図1-6
図1-6では、LSTMモデルの学習時の欠損値をグラフで表示しています。
欠損値はほぼ理想的な値になっていると思います。
最後にLSTMモデルのサマリーを表示しています。
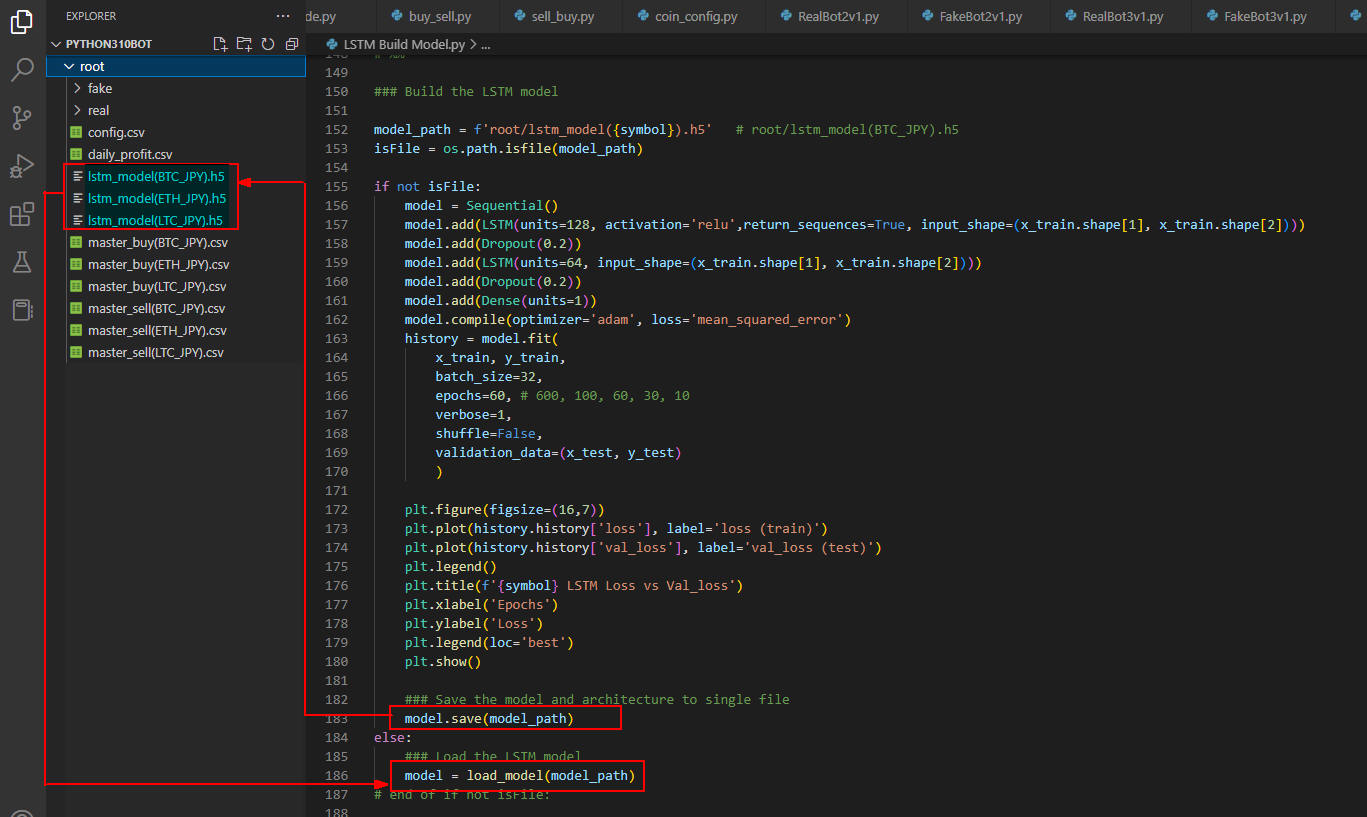 図1-7
図1-7では、LSTMモデルを作成したらファイルに保存しています。
LSTMモデルは仮想通貨ごとに作成します。
未来の価格を予測するときは、ここで保存したファイルをロードして行います。
図1-7
図1-7では、LSTMモデルを作成したらファイルに保存しています。
LSTMモデルは仮想通貨ごとに作成します。
未来の価格を予測するときは、ここで保存したファイルをロードして行います。
BOT作成の第10回目と第11回目で解説したBOTのBuySellクラスとSellBuyクラスにLSTMモデルを組み込む
ここではBOT作成シリーズの
第10回目「BOTのBuySellクラスを作成する」と
第11回目「BOTのSellBuyクラスを作成する」で解説している、
BuySellクラスとSellBuyクラスにLSTMモデルを組み込んで未来の価格を予測します。
ここで予測した未来の価格は、未来のトレンドを判断するときに使います。
Add the LSTM Model into the Python Class Module.py:
# Add the LSTM Model into the Python Class Module.py
#%%

### Import the libraires
import os
os.environ['TF_CPP_MIN_LOG_LEVEL'] = '3'

import math
import numpy as np
import matplotlib.pyplot as plt
import matplotlib.dates as mdates
import pandas as pd
import datetime as dt
from datetime import timedelta
from time import sleep

from sklearn.preprocessing import MinMaxScaler
from keras import models
from keras.layers import Dense, Dropout, LSTM
from keras.models import Sequential
from keras.models import load_model

from sklearn.metrics import mean_squared_error, mean_absolute_error, explained_variance_score, r2_score
from sklearn.metrics import mean_poisson_deviance, mean_gamma_deviance, accuracy_score

import warnings
warnings.simplefilter('ignore')
plt.style.use('fivethirtyeight')

# %%

###################################
def get_trend(prices: list) -> str:
    trend = 0
    for i in range(1, len(prices)):
        if prices[i] > prices[i-1]:
            trend += 1
        elif prices[i] < prices[i-1]:
            trend -= 1
    return 'up' if trend > 0 else 'down'

############################################
def get_data(csv_file: str) -> pd.DataFrame:
    print(f"Loading data for {symbol}: {csv_file} ")
    df = pd.read_csv(csv_file)
    # time,open,close,low,high,price,buy_price,side,size,symbol,psar,psar_trend,st,st_trend,ci
    df['time'] = pd.to_datetime(df['time'])
    return df

### Load the Data
symbol = 'BTC_JPY'  # BTC_JPY, ETH_JPY, LTC_JPY
csv_file = f"root/master_buy({symbol}).csv"  # root/master_buy(BTC_JPY).csv
isFile = os.path.isfile(csv_file)
if not isFile:
    print(f"{csv_file} is not found => quit")
df = get_data(csv_file)

#%%

### Prepare Train / Test data

### Create a new dataframe with only the 'close' column
close_df = df.filter(['close'])

### Convert filtered dataframe to a numpy array
close_ndarr = close_df.values   # N-dimension array : ndarray

### Get the number of rows to train the model on
prediction_days = int(close_ndarr.shape[0] * 0.2)
train_len = len(close_ndarr) - prediction_days

### Split train and test
train_ndarr = close_ndarr[0:train_len]
test_ndarr = close_ndarr[train_len:]

# %%

### Scale the train data & reshape
scaler = MinMaxScaler(feature_range=(0,1))
scaled_train_ndarr = scaler.fit_transform(train_ndarr)

### Split the data into x_train and y_train data sets
x_train = []
y_train = []

win_size = 60   # 5,10,30,60,... time series sequence length

for i in range(win_size, len(scaled_train_ndarr)):          # train_data (scaled data)
    x_train.append(scaled_train_ndarr[i - win_size:i, 0])   # slice ndarray [start:stop,step]
    y_train.append(scaled_train_ndarr[i, 0])                # slice ndarray [start,step]

### Convert the x_train and y_train to numpy arrays
x_train, y_train = np.array(x_train), np.array(y_train)

### Reshape the train data (scaled data)
x_train = np.reshape(x_train, (x_train.shape[0], x_train.shape[1], 1))

### Scale the test data & reshape
# scaler = MinMaxScaler(feature_range=(0,1))
scaled_test_ndarr = scaler.fit_transform(test_ndarr)

### Split the test data into x_test and y_test data sets
x_test = []
y_test = []

for i in range(win_size, len(scaled_test_ndarr)):       # test_data (scaled data)
    x_test.append(scaled_test_ndarr[i - win_size:i, 0]) # slice ndarray [start:stop,step]
    y_test.append(scaled_test_ndarr[i, 0])              # slice ndarray [start,step]

### Convert the x_test and y_test to numpy arrays
x_test, y_test = np.array(x_test), np.array(y_test)

### Reshape the test data (scaled data)
x_test = np.reshape(x_test, (x_test.shape[0], x_test.shape[1], 1))

# %%

### Load the LSTM model
model_path = f'root/lstm_model({symbol}).h5'   # root/lstm_model(BTC_JPY).h5
isFile = os.path.isfile(model_path)

if not isFile:
    print(f"{model_path} file not found: quit python")
    quit()

model = load_model(model_path)

### Predict the future price
future_time = 10  # 3, 5, 7...
x_test_last_n_minutes  = x_test[-future_time:]   # [-10:]
predicted_n_minutes_prices = model.predict(x_test_last_n_minutes)
predicted_n_minutes_prices = scaler.inverse_transform(predicted_n_minutes_prices)
predicted_n_minutes_prices = np.array(predicted_n_minutes_prices)
predicted_n_minutes_prices = predicted_n_minutes_prices.flatten()

#%%

### Plot predicted prices
start_min = 1
time_list = [start_min + i for i in range(future_time)]

plt.figure(figsize=(16,7))
plt.plot(time_list, predicted_n_minutes_prices, marker='.', markersize=20, linewidth=1, label='Predected Future Price', color='red')
plt.title(f'{symbol} LSTM Model : Predict Future Price', fontsize=18)
plt.xlabel('Time (xticks + marker + annotate)')
plt.ylabel('Close Price Yen (¥)')
plt.legend(loc='best')
plt.xticks(time_list, [f'{t} min' for t in time_list], rotation=45)
for i, price in enumerate(predicted_n_minutes_prices):
    plt.annotate(f'¥{price:,.0f}', xy=(time_list[i], price), xytext=(5,5), textcoords='offset points', ha='center', va='bottom', color='green', fontsize=12)
plt.show()

trend  = get_trend(predicted_n_minutes_prices)

print(f"The trend of prices is {trend}")

# %%
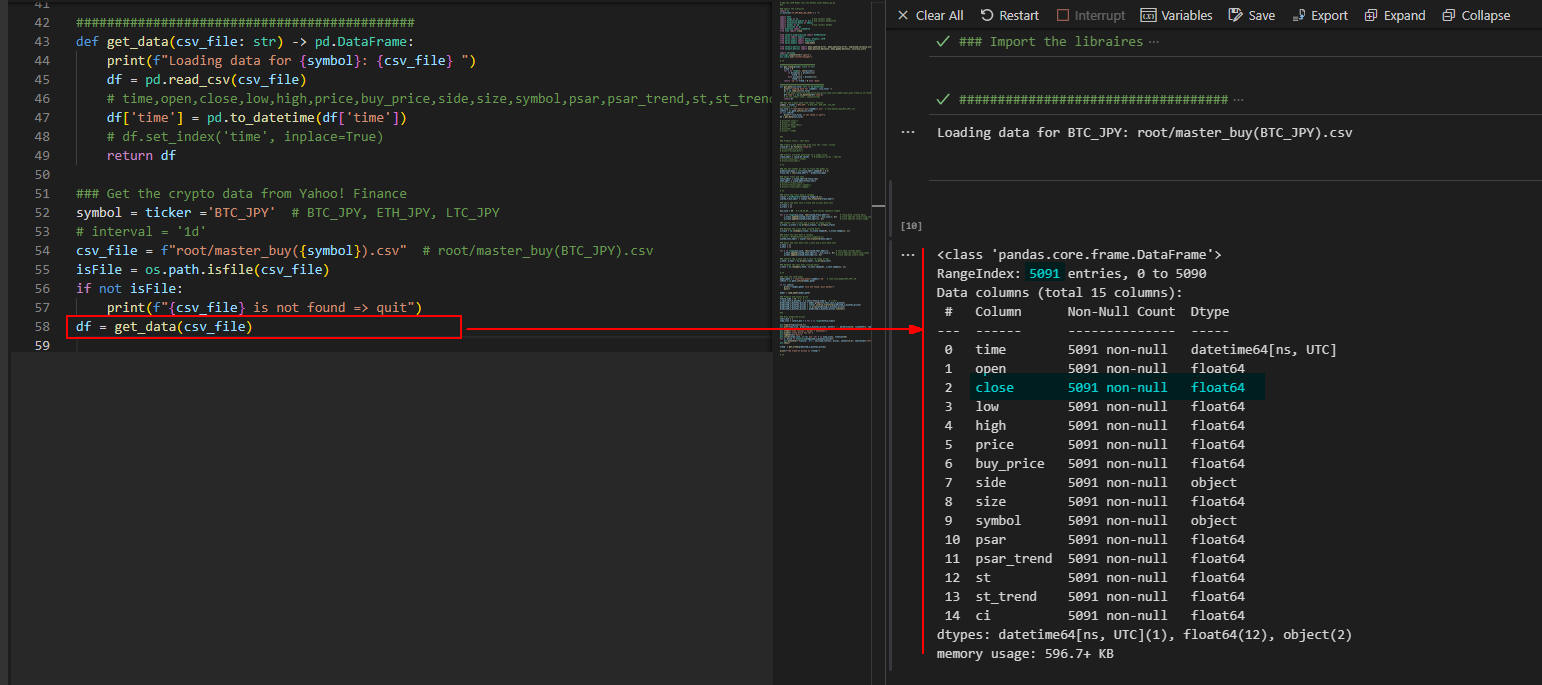 図2-1
図2-1ではビットコインの直近の価格データが格納されているCSVファイルを取り込んでPandasのDataFrameに格納しています。
ここではビットコイン(BTC)の買い注文のファイルを取り込んでいます。
DataFrameは「time, open, close, low, high,...」等の列(カラム)から構成されますが、「close」のカラムのみ使用します。
GMOコインから仮想通貨の価格データをダウンロードしてCSVファイルに保存する方法は、
「BOT作成シリーズ(CSVクラス, APIクラス)」で解説しています。
図2-1
図2-1ではビットコインの直近の価格データが格納されているCSVファイルを取り込んでPandasのDataFrameに格納しています。
ここではビットコイン(BTC)の買い注文のファイルを取り込んでいます。
DataFrameは「time, open, close, low, high,...」等の列(カラム)から構成されますが、「close」のカラムのみ使用します。
GMOコインから仮想通貨の価格データをダウンロードしてCSVファイルに保存する方法は、
「BOT作成シリーズ(CSVクラス, APIクラス)」で解説しています。
 図2-2
図2-2では、DataFrameの先頭と最後のデータを5件づつ表示しています。
「close」にはビットコインの終値が格納されています。
図2-2
図2-2では、DataFrameの先頭と最後のデータを5件づつ表示しています。
「close」にはビットコインの終値が格納されています。
 図2-3
図2-3では学習用データ(Train)と検証用データ(Test)のデータ形式(Shape)を表示しています。
学習用データには4073件、検証用データには1018件のデータが格納されています。
図2-3
図2-3では学習用データ(Train)と検証用データ(Test)のデータ形式(Shape)を表示しています。
学習用データには4073件、検証用データには1018件のデータが格納されています。
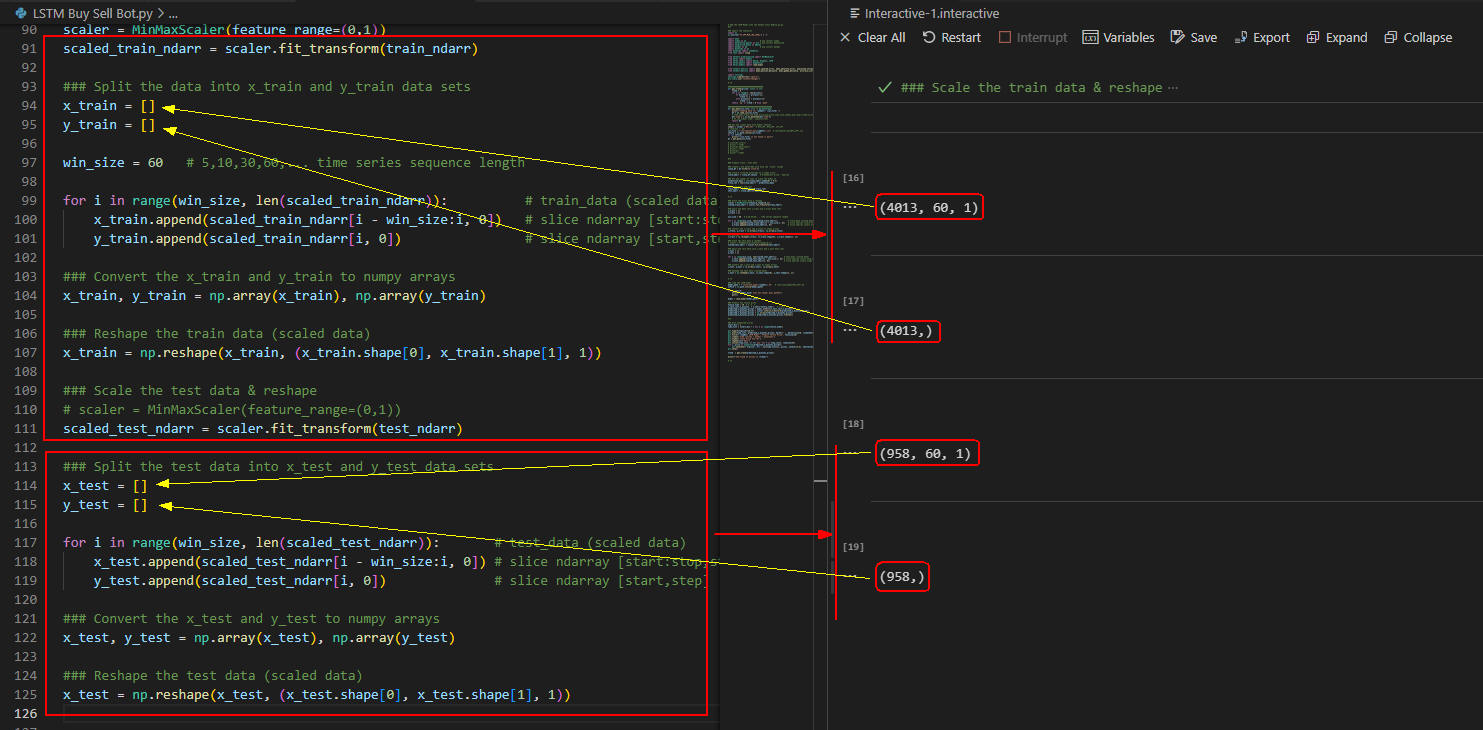 図2-4
図2-4では、学習用データと検証用データを「x, y」に分割したときのデータ形式(Shape)を表示しています。
学習用データには4013件、検証用データには958件のデータが格納されています。
図2-4
図2-4では、学習用データと検証用データを「x, y」に分割したときのデータ形式(Shape)を表示しています。
学習用データには4013件、検証用データには958件のデータが格納されています。
 図2-5
図2-5ではビットコインの直近の10件の終値(実価格)を表示しています。
この価格を元にビットコインの未来の価格を予測します。
図2-5
図2-5ではビットコインの直近の10件の終値(実価格)を表示しています。
この価格を元にビットコインの未来の価格を予測します。
 図2-6
図2-6では、ビットコインの未来の価格をグラフに表示しています。
グラフには未来の予測価格が1分単位で表示されています。
最後に未来の予測価格のトレンド(up/down)を表示しています。
ここでは「up」が表示されているのでLSTMモデルは価格が上昇すると判断していることになります。
図2-6
図2-6では、ビットコインの未来の価格をグラフに表示しています。
グラフには未来の予測価格が1分単位で表示されています。
最後に未来の予測価格のトレンド(up/down)を表示しています。
ここでは「up」が表示されているのでLSTMモデルは価格が上昇すると判断していることになります。