-
ここでは、ユーザー定義関数「get_top_n_crypto_market_cap()」を呼び出して、
仮想通貨の時価総額の上位10位までのデータを取得します。
上位10位までのデータを取得するには、関数の引数に「top=10」を指定します。
時価総額を米ドルで取得するには、関数の引数に「currency='usd'」を指定します。
時価総額を日本円で取得するには、「currency='jpy'」を指定します。
リスト1:
#############################
### Main
#############################

# 0: Get top n crypto market cap data

top = 10
currency = 'usd'
df = get_top_n_crypto_market_cap(top, currency)

# Convert symbol values to uppercase
df['symbol'] = df['symbol'].str.upper()

# Convert market cap values to billions for better readability
df['market_cap'] = df['market_cap'] / 1e9
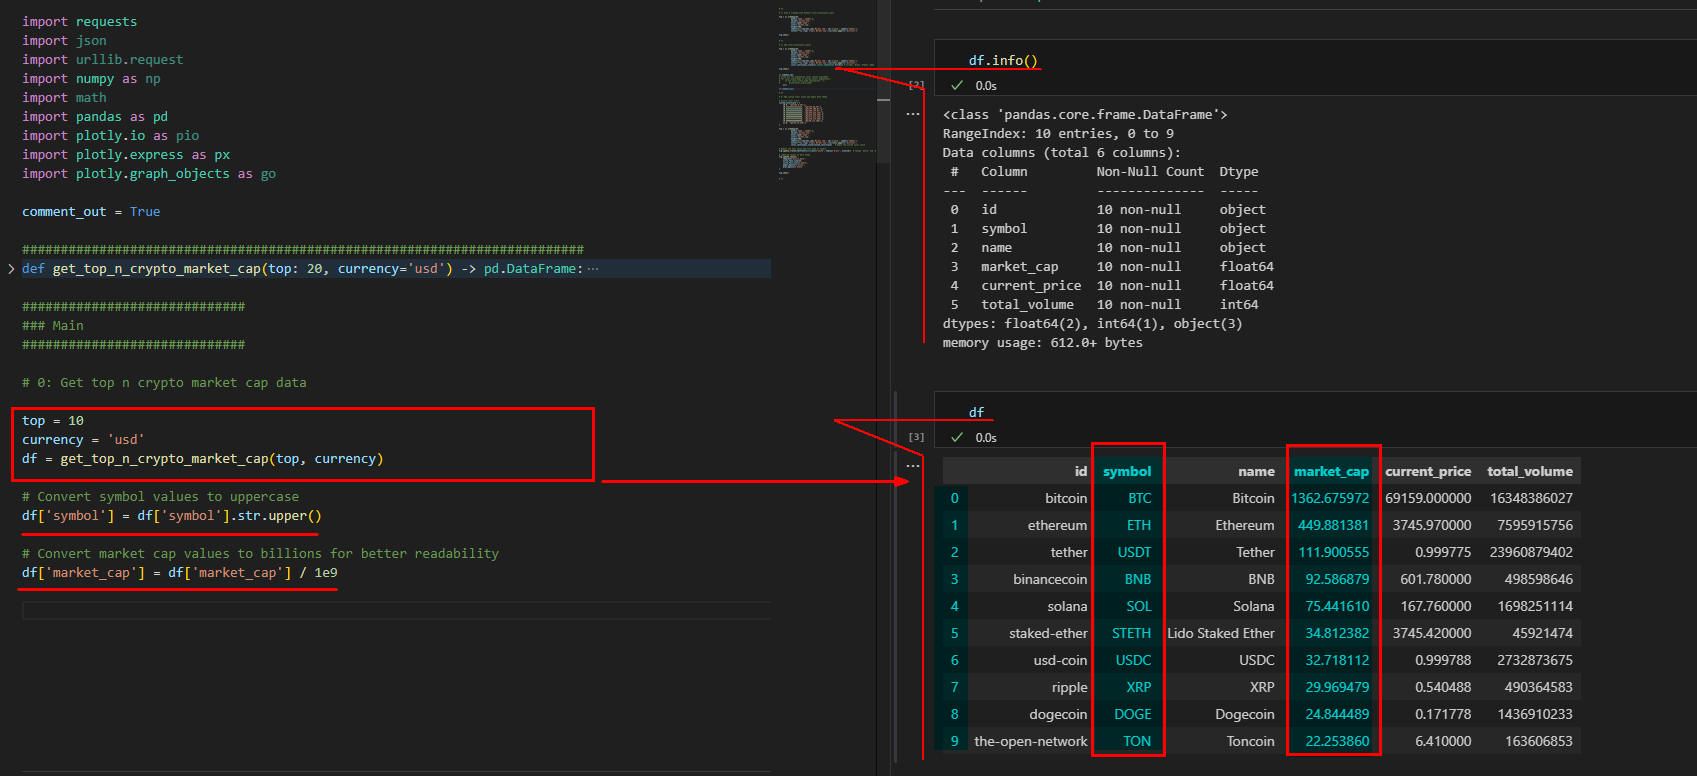 図1-1
図1-1では、PandasのDataFrameの構造と内容を表示しています。
DataFrameは列「id, symbol, name, market_cap, current_price, total_volume」から構成されます。
図1-1
図1-1では、PandasのDataFrameの構造と内容を表示しています。
DataFrameは列「id, symbol, name, market_cap, current_price, total_volume」から構成されます。
DataFrameの列「symbol」には仮想通貨のシンボルが大文字で格納されています。
列「name」には仮想通貨の名前が格納されています。
列「market_cap」には仮想通貨の時価総額が米ドルでビリオンの単位で格納されています。
-
Plotly Expressのtreemap()メソッドで仮想通貨のMarket Cap Top 10を視覚化する
ここでは、Plotly Expressの「treemap()」メソッドで仮想通貨の時価総額を視覚化しています。
リスト2:
# 1: Draw a treemap with default color_continuous_scale

fig = px.treemap(df,
            path=['name','symbol'],
            values='market_cap',
            hover_name='name',
            color='market_cap',
            height=700,
            labels=dict(market_cap='Market Cap', id='Crypto', symbol='Symbol'),
            title=f"Top {top} Crypto Market Cap ({currency.upper()} Billion)")

fig.show()
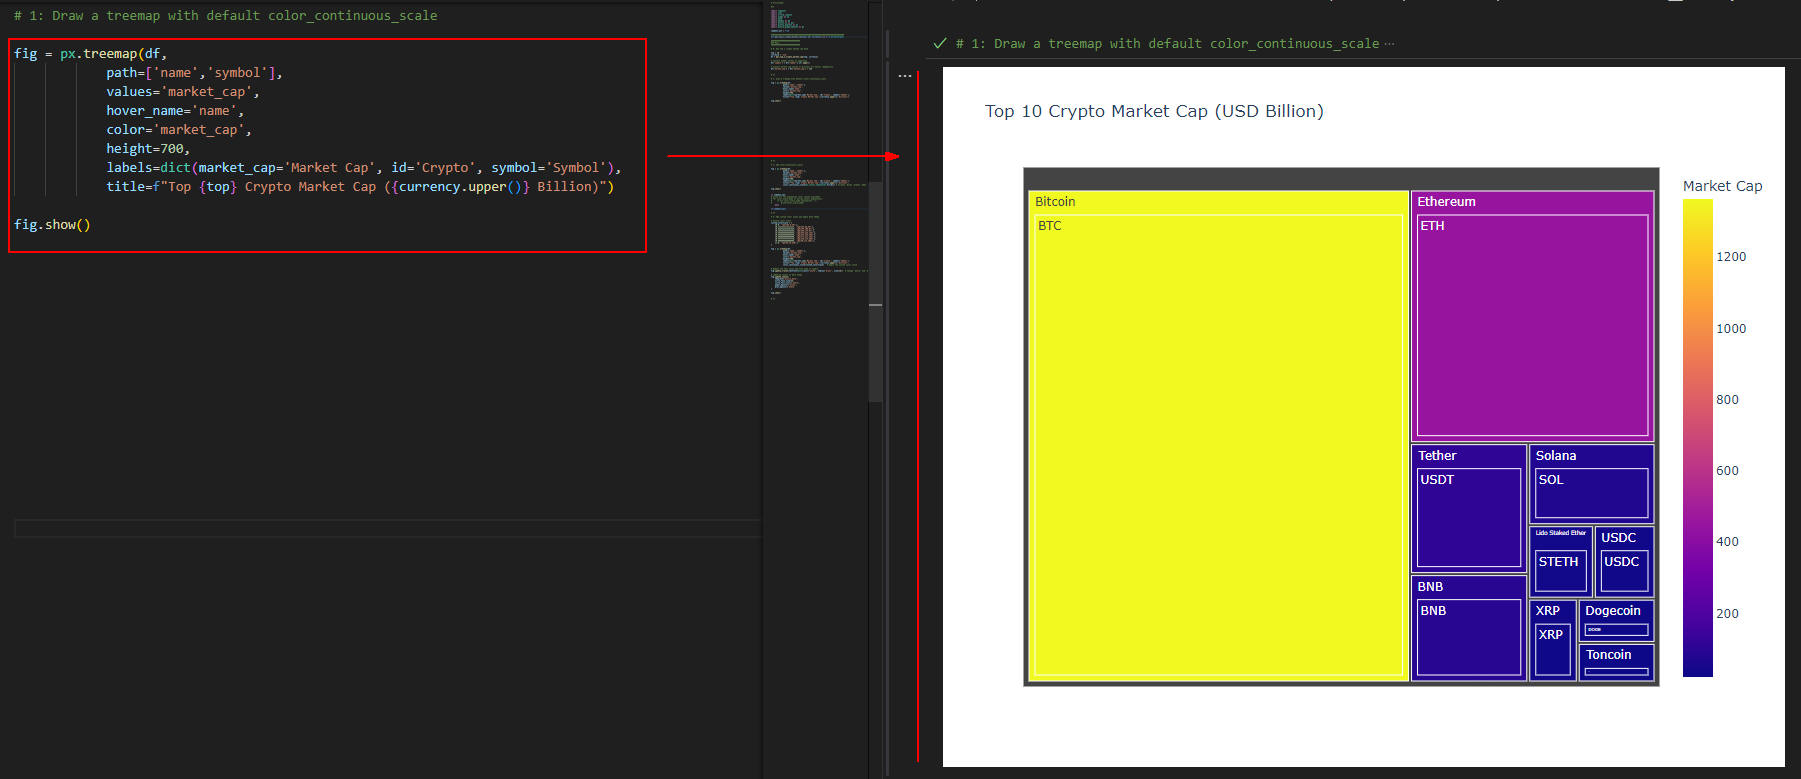 図2-1
図2-1には、仮想通貨の時価総額がツリーマップ(treemap)で表示されています。
ここでは、ツリーマップをデフォルトのオプションで作成しています。
図2-1
図2-1には、仮想通貨の時価総額がツリーマップ(treemap)で表示されています。
ここでは、ツリーマップをデフォルトのオプションで作成しています。
-
Plotly Expressのカラー・スケール「color_continuous_scale」をカスタマイズする
ここでは、Plotly Expressの「treemap()」メソッドに引数「color_continuous_scale=px.colors.sequential.Viridis)」
を追加してカラー・スケールをカスタマイズしています。
この引数には「Viridis, Blues, Greens, Reds,...」などが指定できます。
リスト3:
# 2: Add color_continuous_scale=

fig = px.treemap(df,
            path=['name','symbol'],
            values='market_cap',
            hover_name='name',
            color='market_cap',
            height=700,
            labels=dict(market_cap='Market Cap', id='Crypto', symbol='Symbol'),
            title=f"Top {top} Crypto Market Cap ({currency.upper()} Billion)",
            color_continuous_scale=px.colors.sequential.Viridis) # Viridis, Blues, Greens, Reds

fig.show()
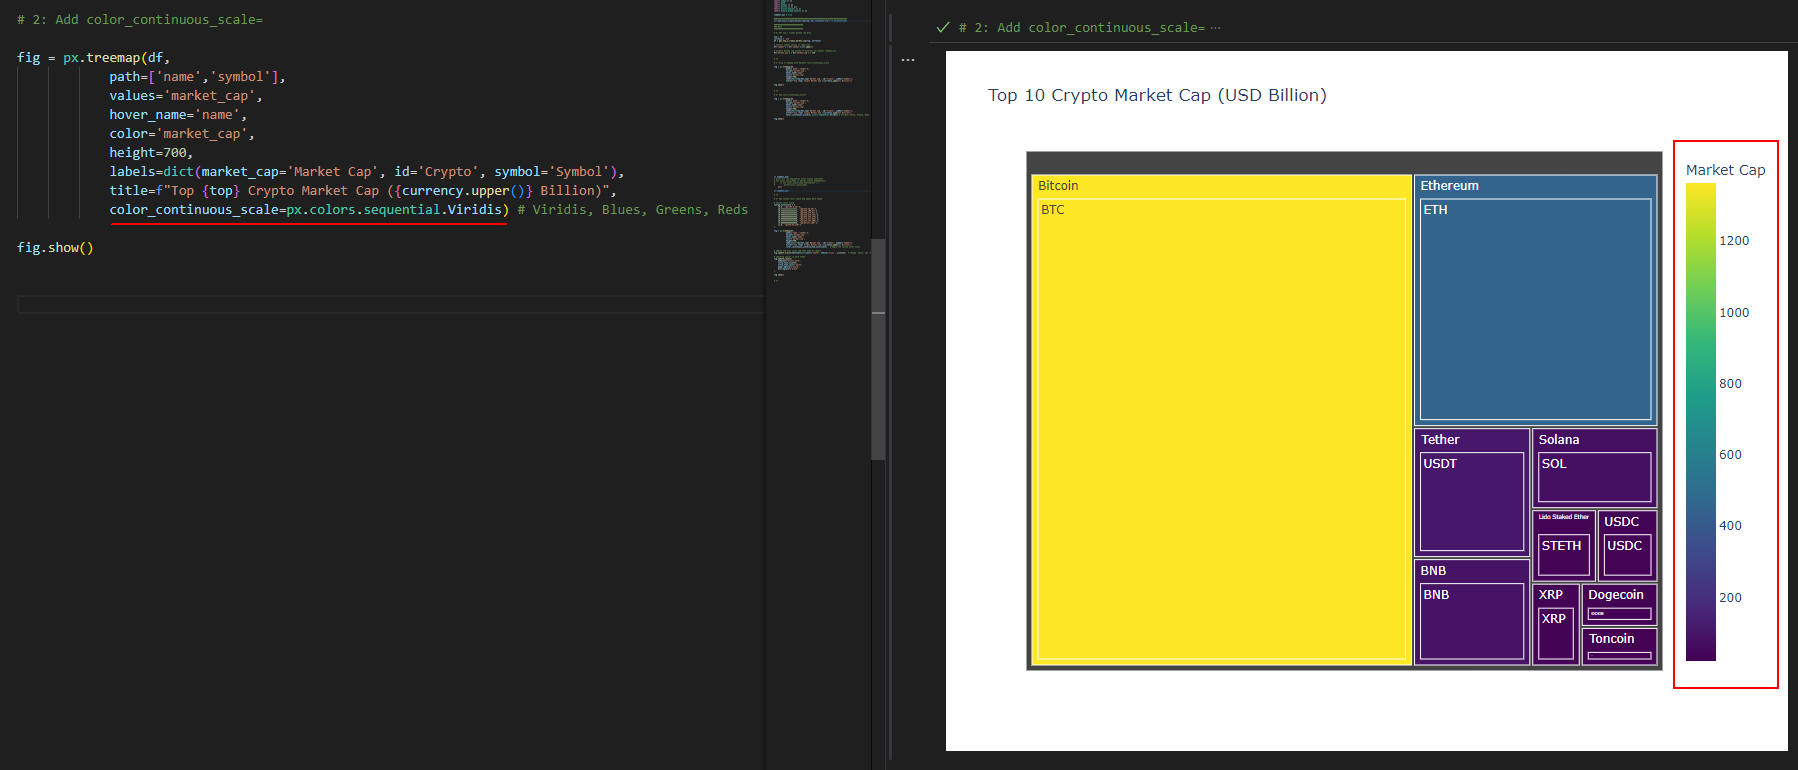 図3-1
図3-1では、「treemap()」メソッドに引数「color_continuous_scale=px.colors.sequential.Viridis」を追加してカラー・スケールをカスタマイズしています。
図3-1
図3-1では、「treemap()」メソッドに引数「color_continuous_scale=px.colors.sequential.Viridis」を追加してカラー・スケールをカスタマイズしています。
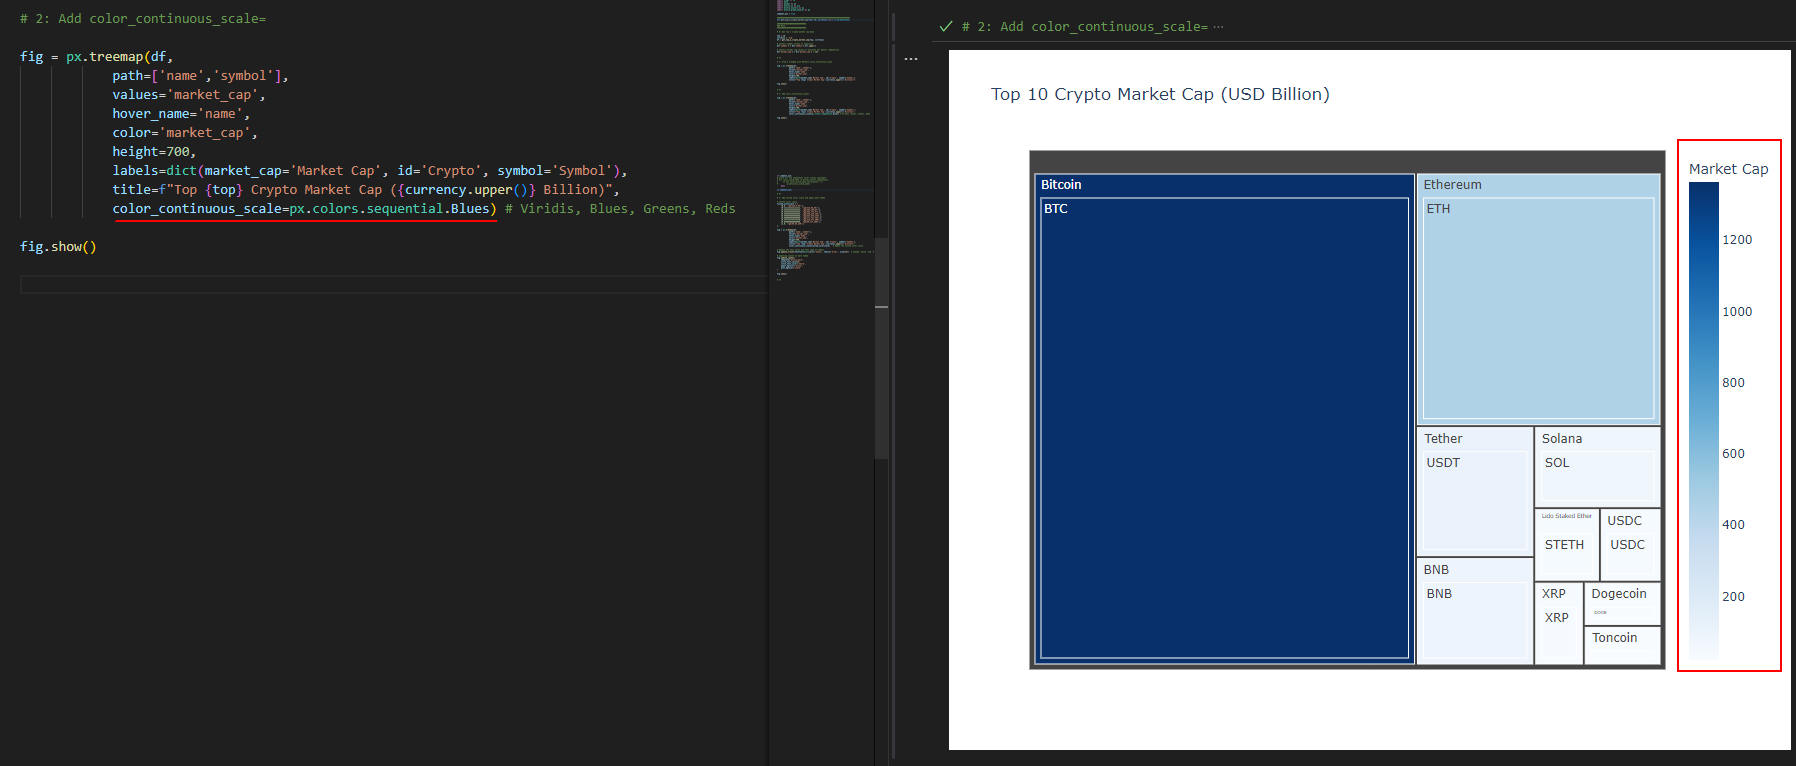 図3-2
図3-2では、「treemap()」メソッドに引数「color_continuous_scale=px.colors.sequential.Blues」を追加してカラー・スケールをカスタマイズしています。
図3-2
図3-2では、「treemap()」メソッドに引数「color_continuous_scale=px.colors.sequential.Blues」を追加してカラー・スケールをカスタマイズしています。
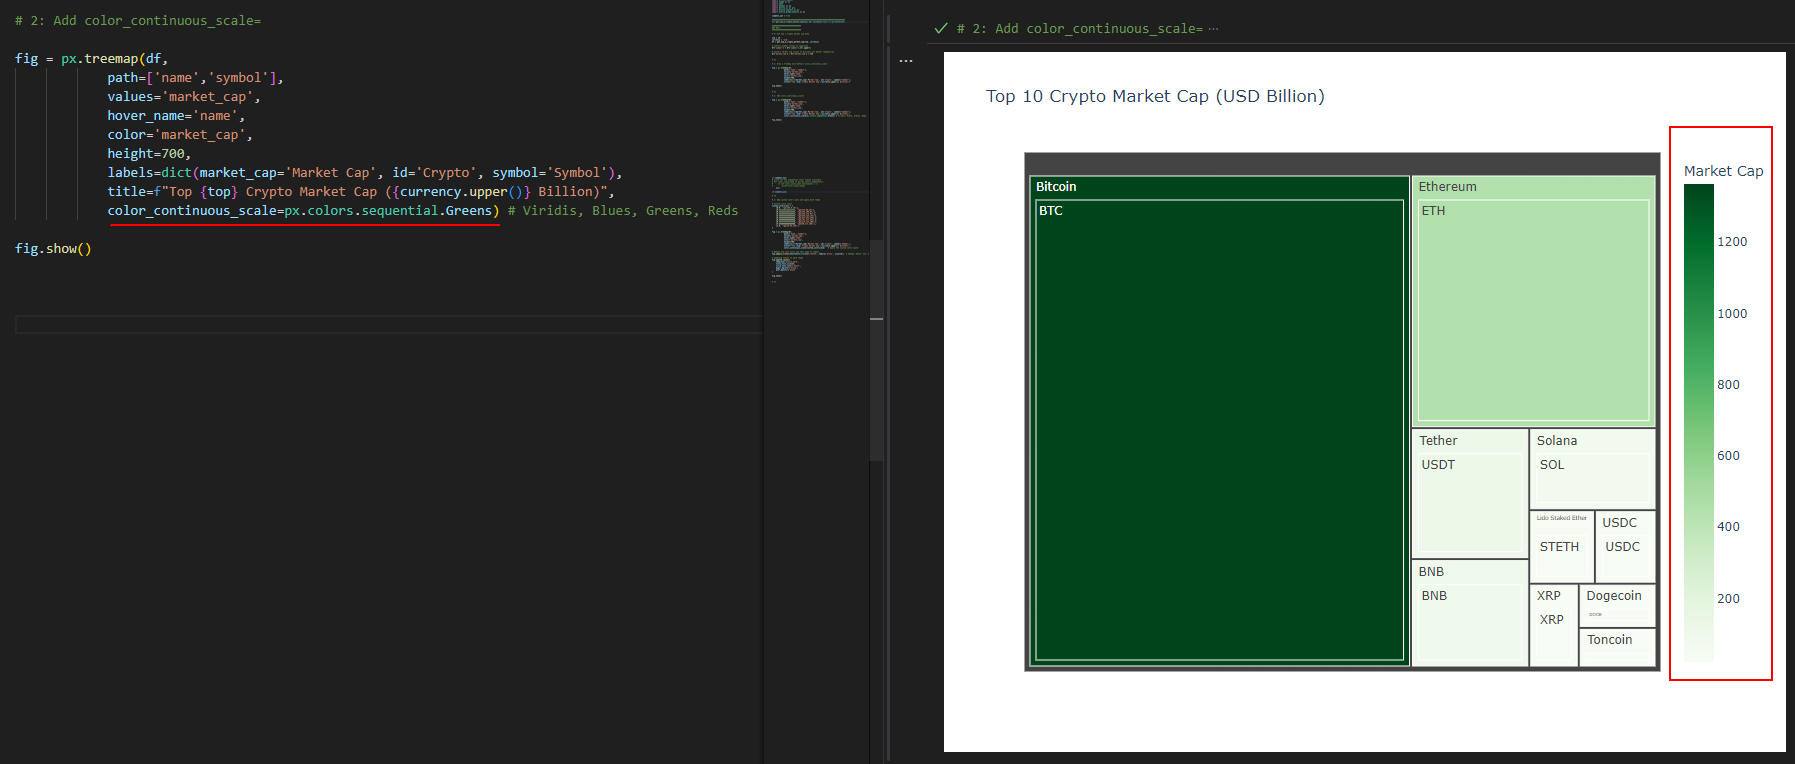 図3-3
図3-3では、「treemap()」メソッドに引数「color_continuous_scale=px.colors.sequential.Greens」を追加してカラー・スケールをカスタマイズしています。
図3-3
図3-3では、「treemap()」メソッドに引数「color_continuous_scale=px.colors.sequential.Greens」を追加してカラー・スケールをカスタマイズしています。
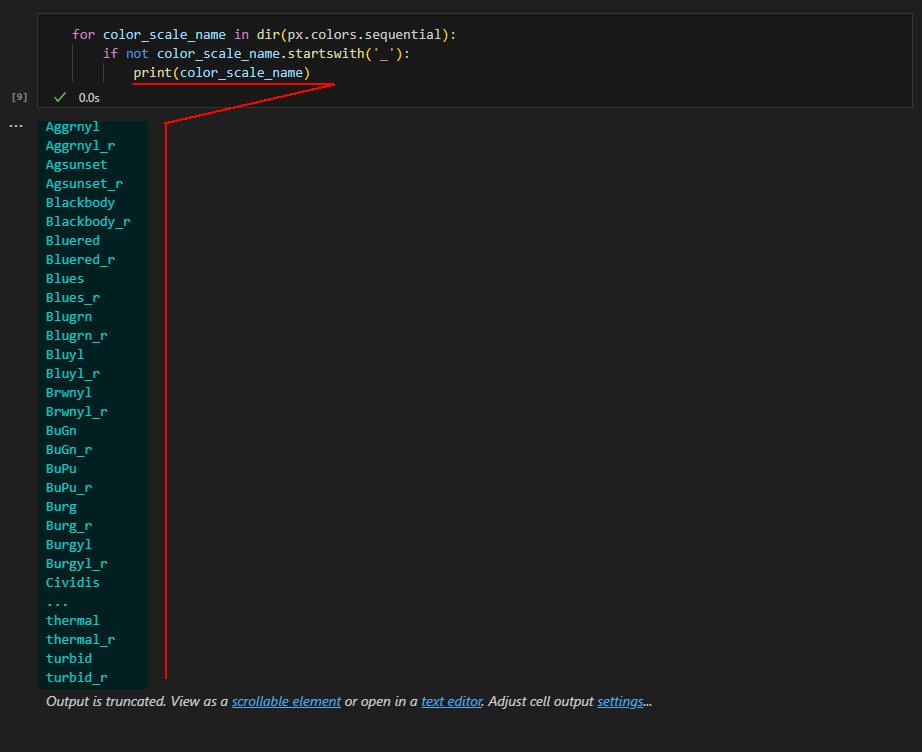 図3-4
図3-4では、「treemap()」メソッドの引数「color_continuous_scale=」に指定できるカラー・スケールの一覧を表示しています。
カラー・スケールを色々書き換えて最適なものを選択してください。
図3-4
図3-4では、「treemap()」メソッドの引数「color_continuous_scale=」に指定できるカラー・スケールの一覧を表示しています。
カラー・スケールを色々書き換えて最適なものを選択してください。
# print all the sequential color scales available
for color_scale_name in dir(px.colors.sequential):
    if not color_scale_name.startswith('_'):
        print(color_scale_name)
-
Plotly Expressをさらにカスタマイズして見栄えよくする
ここでは、Plotly Expressの「treemap()」メソッドをさらにカスタマイズしています。
引数「color_continuous_scale=」には、カスタム・カラー・スケール「custom_colorscale」を指定しています。
「update_traces()」メソッドでは、ラベルの色、フォント、フォントサイズをカスタマイズしています。
「update_layout()」メソッドでは、Plotly Expressのテーマ(theme)を「ダークモード」に設定しています。
リスト4:
# 3: Add custom color scale and apply dark theme

# Custom color scale
custom_colorscale = [
    [0.0, 'rgb(165,0,38)'],
    [0.1111111111111111, 'rgb(215,48,39)'],
    [0.2222222222222222, 'rgb(244,109,67)'],
    [0.3333333333333333, 'rgb(253,174,97)'],
    [0.4444444444444444, 'rgb(254,224,144)'],
    [0.5555555555555556, 'rgb(224,243,248)'],
    [0.6666666666666666, 'rgb(171,217,233)'],
    [0.7777777777777778, 'rgb(116,173,209)'],
    [0.8888888888888888, 'rgb(69,117,180)'],
    [1.0, 'rgb(49,54,149)']
]

fig = px.treemap(df,
            path=['name','symbol'],
            values='market_cap',
            hover_name='name',
            color='market_cap',
            height=700,
            labels=dict(market_cap='Market Cap', id='Crypto', symbol='Symbol'),
            title=f"Top {top} Crypto Market Cap ({currency.upper()} Billion)",
            color_continuous_scale=custom_colorscale)   # Apply the custom color scale

# Update the text color and font name of labels
fig.update_traces(textfont=dict(color='white', family='Arial', size=18))  # Change 'white' and 'Arial' to your preferences

# updating layout to dark theme
fig.update_layout(
    template='plotly_dark',
    title_font_size=24,
    title_font_color='white',
    paper_bgcolor='black',
    plot_bgcolor='black'
)

fig.show()
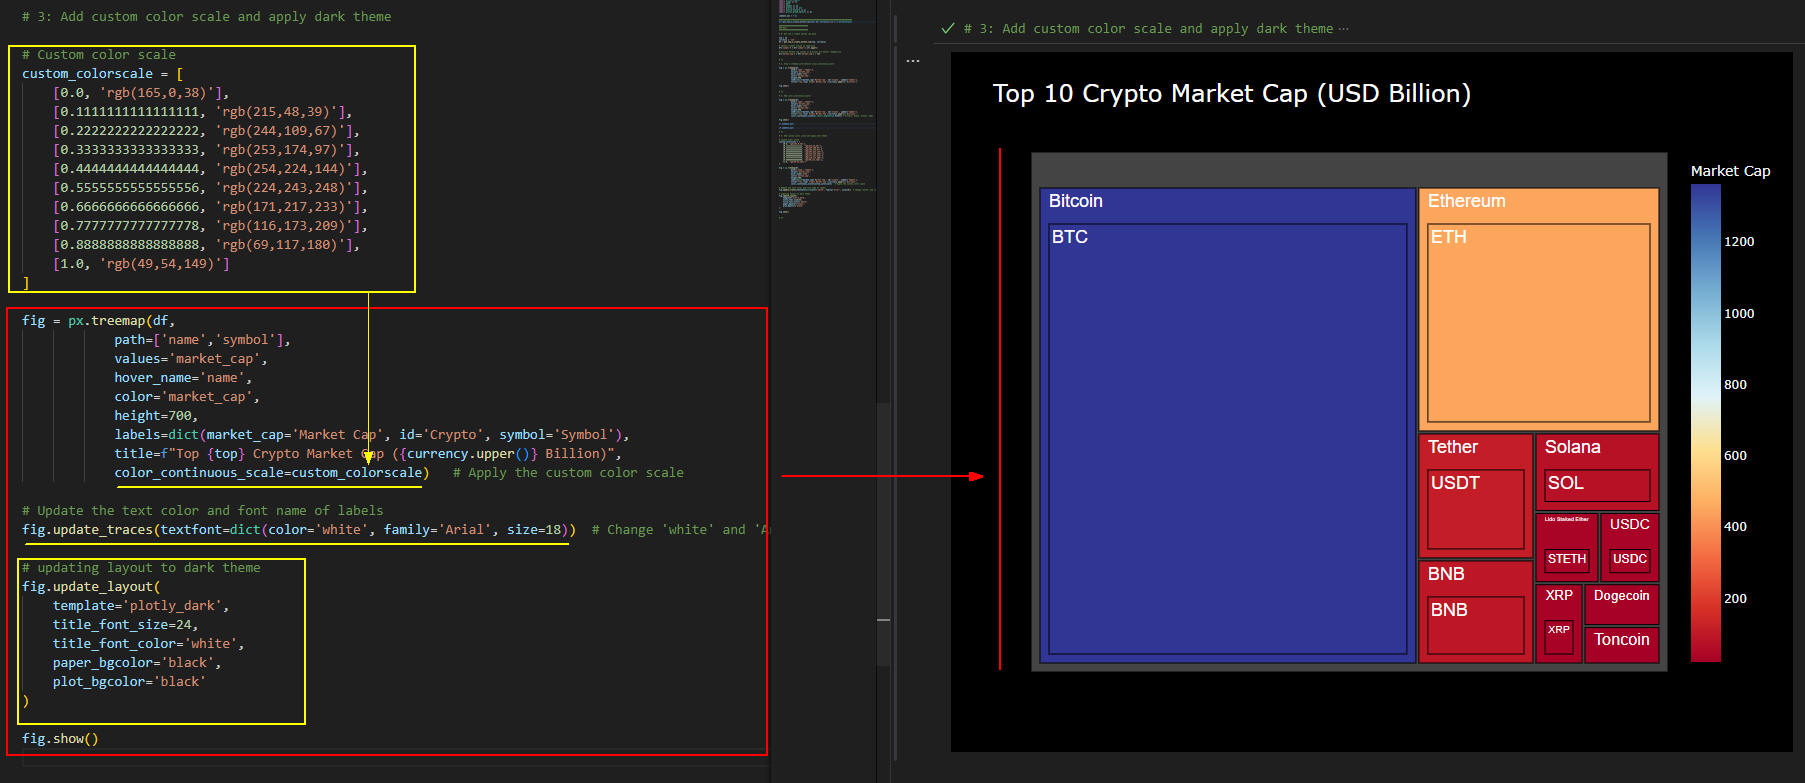 図4-1
図4-1では、ツリーマップのカラー・スケールを独自のカラーでカスタマイズしています。
図4-1
図4-1では、ツリーマップのカラー・スケールを独自のカラーでカスタマイズしています。
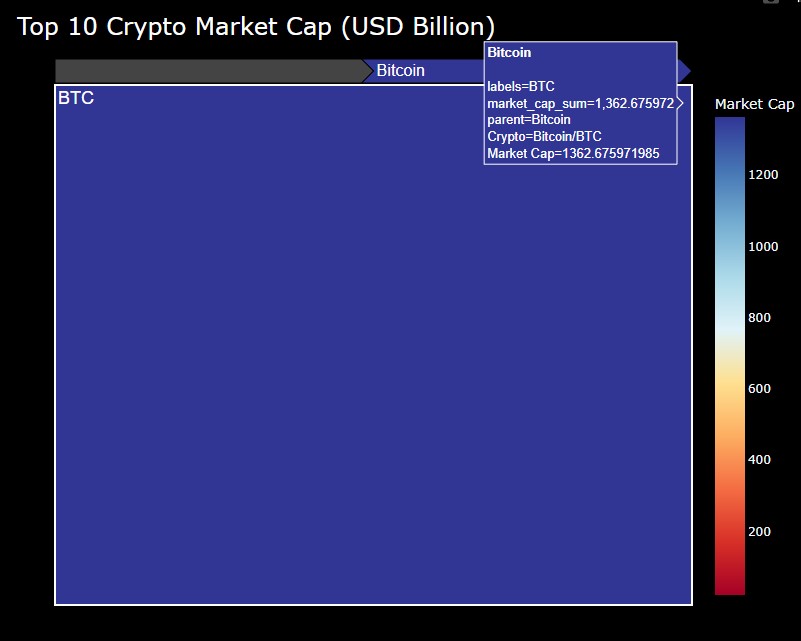 図4-2
図4-2では、ツリーマップの「Bitcoin」をクリックして拡大表示しています。
また、マウスをホバリングさせて「Bitcoin」のラベル情報も表示させています。
図4-2
図4-2では、ツリーマップの「Bitcoin」をクリックして拡大表示しています。
また、マウスをホバリングさせて「Bitcoin」のラベル情報も表示させています。
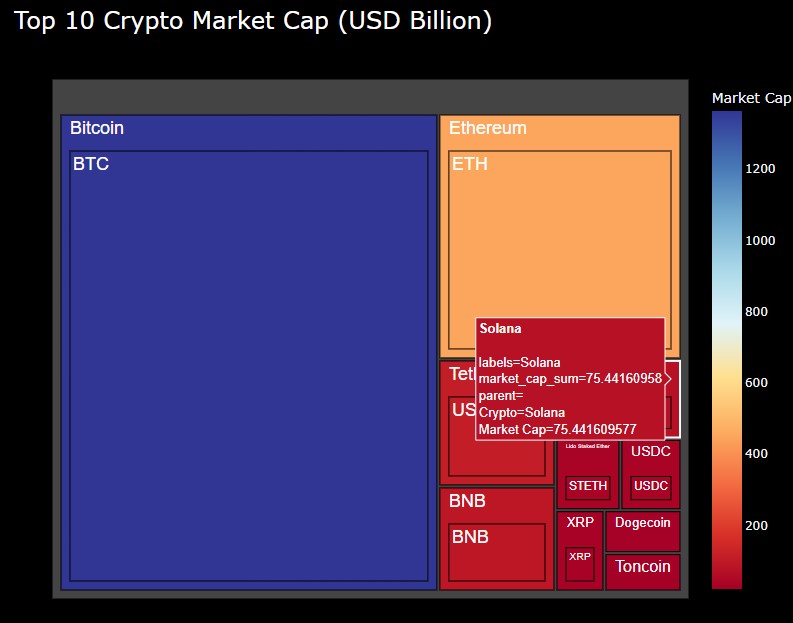 図4-3
図4-3では、ツリーマップの「Solana」にマウスをホバリングさせてラベルを表示させています。
図4-3
図4-3では、ツリーマップの「Solana」にマウスをホバリングさせてラベルを表示させています。
-
この記事で紹介している全てのソースコードを掲載
ここでは、本記事で解説している全てのコードを掲載しています。
コード内にコメント「#%%」が挿入されていますが、
これはセル単位でコードを実行するときに必要になります。
コードをセル単位で実行するには、セル(「#%%」で囲まれた部分」)を選択して[Ctrl + Enter]で実行します。
すると、VS Codeの右側の「インタラクティブ・ウィンドウ」に実行結果が表示されます。
「インタラクティブ・ウィンドウ」からは、Pythonのコードを入力して[Shift + Enter」で実行させることもできます。
リスト5:
# Article156:

#%%

import requests
import json
import urllib.request
import numpy as np
import math
import pandas as pd
import plotly.io as pio
import plotly.express as px
import plotly.graph_objects as go

comment_out = True

#########################################################################
def get_top_n_crypto_market_cap(top: 20, currency='usd') -> pd.DataFrame:

    # CoinGecko API endpoint for top 100 coins by market cap
    url = 'https://api.coingecko.com/api/v3/coins/markets'

    # Parameters for the API request
    params = {
        'vs_currency': currency,
        'order': 'market_cap_desc',
        'per_page': top,
        'page': 1,
        'sparkline': 'false'
    }

    # Sending a request to the API
    response = requests.get(url, params=params)

    # Converting the response to JSON
    data = response.json()

    # Creating a list of dictionaries with the relevant data

    crypto_data = []

    for item in data:
        crypto_data.append({
            'id': item['id'],
            'symbol': item['symbol'],
            'name': item['name'],
            'market_cap': item['market_cap'],
            'current_price': item['current_price'],
            'total_volume': item['total_volume']
        })

    # Creating a pandas dataframe from the list of dictionaries
    df = pd.DataFrame(crypto_data)

    return df

#############################
### Main
#############################

# 0: Get top n crypto market cap data

top = 10
currency = 'usd'
df = get_top_n_crypto_market_cap(top, currency)

# Convert symbol values to uppercase
df['symbol'] = df['symbol'].str.upper()

# Convert market cap values to billions for better readability
df['market_cap'] = df['market_cap'] / 1e9


# %%

# 1: Draw a treemap with default color_continuous_scale

fig = px.treemap(df,
            path=['name','symbol'],
            values='market_cap',
            hover_name='name',
            color='market_cap',
            height=700,
            labels=dict(market_cap='Market Cap', id='Crypto', symbol='Symbol'),
            title=f"Top {top} Crypto Market Cap ({currency.upper()} Billion)")

fig.show()


# %%

# 2: Add color_continuous_scale=

fig = px.treemap(df,
            path=['name','symbol'],
            values='market_cap',
            hover_name='name',
            color='market_cap',
            height=700,
            labels=dict(market_cap='Market Cap', id='Crypto', symbol='Symbol'),
            title=f"Top {top} Crypto Market Cap ({currency.upper()} Billion)",
            color_continuous_scale=px.colors.sequential.Viridis) # Viridis, Blues, Greens, Reds

fig.show()


if comment_out:
# print all the sequential color scales available
# for color_scale_name in dir(px.colors.sequential):
#     if not color_scale_name.startswith('_'):
#         print(color_scale_name)
    pass

if comment_out:
# Sequential Color Scales:
# Viridis
# Cividis
# Inferno
# Magma
# Plasma
# Turbo
# Bluered
# Blues
# Greens
# Greys
# Oranges
# Purples
# Reds
# RdBu
# YlGnBu
# YlOrRd

# Diverging Color Scales:
# Picnic
# Portland
# Blackbody
# Earth
# Electric
# Jet
# Rainbow

# Cyclical Color Scales:
# IceFire
# Edge
# HSV
    pass

# %%

# 3: Add custom color scale and apply dark theme

# Custom color scale
custom_colorscale = [
    [0.0, 'rgb(165,0,38)'],
    [0.1111111111111111, 'rgb(215,48,39)'],
    [0.2222222222222222, 'rgb(244,109,67)'],
    [0.3333333333333333, 'rgb(253,174,97)'],
    [0.4444444444444444, 'rgb(254,224,144)'],
    [0.5555555555555556, 'rgb(224,243,248)'],
    [0.6666666666666666, 'rgb(171,217,233)'],
    [0.7777777777777778, 'rgb(116,173,209)'],
    [0.8888888888888888, 'rgb(69,117,180)'],
    [1.0, 'rgb(49,54,149)']
]

fig = px.treemap(df,
            path=['name','symbol'],
            values='market_cap',
            hover_name='name',
            color='market_cap',
            height=700,
            labels=dict(market_cap='Market Cap', id='Crypto', symbol='Symbol'),
            title=f"Top {top} Crypto Market Cap ({currency.upper()} Billion)",
            color_continuous_scale=custom_colorscale)   # Apply the custom color scale

# Update the text color and font name of labels
fig.update_traces(textfont=dict(color='white', family='Arial', size=18))  # Change 'white' and 'Arial' to your preferences

# updating layout to dark theme
fig.update_layout(
    template='plotly_dark',
    title_font_size=24,
    title_font_color='white',
    paper_bgcolor='black',
    plot_bgcolor='black'
)

fig.show()


# %%