-
まずはPythonのライブラリを取り込む
Visual Studio Code(VSC)を起動したら新規ファイルを作成して行1-9をコピペします。
行2-7ではPythonのライブラリを取り込んでいます。
行9ではPythonの警告を抑止しています。
ライブラリをまだインストールしていないときは「pip install」で事前にインストールしておいてください。
### Import the libraries
from functools import reduce
import pandas as pd
import numpy as np
import matplotlib.pyplot as plt
import seaborn as sns
import warnings

warnings.simplefilter('ignore')
 図1
図1はVisual Studio Code(VSC)の画面です。
図1
図1はVisual Studio Code(VSC)の画面です。
-
PandasのDataFrameにタイタニックのサバイバルデータを取り込む
行2はCSVファイルのパスを定義しています。
CSVファイルを当サイトからダウンロードするときは行3のコメント(#)を外してください。
行4ではPandasのread_csv()メソッドでCSVファイルをPandasのDataFrameに取り込んでいます。
行5ではDataFrame(raw)を変数dfにコピーしています。
ちなみに、「df = raw」のように記述してコピーするとDataFrame(raw)のメモリが共有されます。
メモリを共有したくないときはDataFrameのcopy()メソッドでコピーする必要があります。
### Load the titanic train data
csv_file = 'data/csv/titanic/train.csv'
#csv_file = 'https://money-or-ikigai.com/menu/python/article/data/titanic/train.csv'
raw = pd.read_csv(csv_file)
df = raw.copy()
 図2
図2は実行画面です。
VSCのインタラクティブ・ウィンドウには「df.info()」と「df.head(1)」で出力した情報が表示されています。
CSVファイルには891人の乗船客のデータが格納されています。
列「Survived」には「0=死亡, 1=生存」が格納されています。
列「Sex:性別」には「male, female」が格納されています。
図2
図2は実行画面です。
VSCのインタラクティブ・ウィンドウには「df.info()」と「df.head(1)」で出力した情報が表示されています。
CSVファイルには891人の乗船客のデータが格納されています。
列「Survived」には「0=死亡, 1=生存」が格納されています。
列「Sex:性別」には「male, female」が格納されています。
-
PandasのDataFrameを作成する関数を定義する
行2-9では関数「get_dataframe」を定義しています。
この関数の引数1にはDataFrame、引数2には列名を指定します。
この関数からはDataFrameが戻り値として返されます。
具体的な使用例は図3で説明します。
### Define user function
def get_dataframe(df, col):
    survived_mask = df['Survived'] == 1
    dead_mask = df['Survived'] == 0
    survived = df[survived_mask][col].value_counts()
    dead = df[dead_mask][col].value_counts()
    dfx = pd.DataFrame([survived, dead])
    dfx.index = ['Survived','Dead']
    return dfx

#dfx = get_dataframe(df, 'Sex')
 図3
図3はVSCの画面です。
ここでは行11のコメント(#)を外して実行しています。
VSCのインタラクティブ・ウィンドウには戻り値「dfx」の構造と内容を表示しています。
「get_dataframe(df, 'Sex')」のように関数をコールすると戻り値には図3のようなDataFrame(dfx)が返されます。
DataFrame(df)の列「Survived」には生死の区分が数値「0=dead, 1=survived」で格納されています。
DataFrame(df)の列「Sex」には性別「female, male」が格納されています。
図3
図3はVSCの画面です。
ここでは行11のコメント(#)を外して実行しています。
VSCのインタラクティブ・ウィンドウには戻り値「dfx」の構造と内容を表示しています。
「get_dataframe(df, 'Sex')」のように関数をコールすると戻り値には図3のようなDataFrame(dfx)が返されます。
DataFrame(df)の列「Survived」には生死の区分が数値「0=dead, 1=survived」で格納されています。
DataFrame(df)の列「Sex」には性別「female, male」が格納されています。
行5を実行するとDataFrame(df)の男女の生存者数がPandasのSeriesとして変数「survived」に格納されます。
具体的には「female=233, male=109」が格納されます。
同様に行6を実行するとDataFrame(df)の男女の死亡者数がPandasのSeriesとして変数「dead」に格納されます。
具体的には「female=81, male=468」が格納されます。
行7ではPandasのDataFrame()メソッドでsurvivedとdeadに格納されてSeriesをDataFrameに取り込みます。
DataFrame(dfx)には列「female, male」が生成されます。
そして列「Sex」がDataFrameのindexになります。
この場合、indexは重複した「Sex」が2個生成されます。
行8ではDataFrame(dfx)の重複したindex(Sex, Sex)を(Survived, Dead)に変更しています。
これで図3のようなDataFrame(dfx)が戻り値として返されます。
-
男女別(male, female)の生死の棒グラフを表示する
行2では男女別の生死の人数をDataFrame(dfx)に格納しています。
行5-8ではDataFrameのplot()メソッドでスタック型の棒グラフを作成しています。
行11-14ではDataFrameのplot()メソッドで通常の棒グラフを作成しています。
# get a new dataframe
dfx = get_dataframe(df, 'Sex')

# making stacked bar plot
dfx.plot(kind='bar', stacked=True, grid=False, rot=0,
    xlabel='Survived or Dead', ylabel='Number of Passenger',
    title='Survived vs Dead Analysis\n(Gender)')
plt.show()

# making bar plot
dfx.plot(kind='bar', rot=0,
    xlabel='Survived or Dead', ylabel='Number of Passenger',
    title='Survived vs Dead Analysis\n(Gender)')
plt.show()
 図4
図4は実行結果です。
上図はスタック型の棒グラフで、下図は通常の棒グラフです。
個人的には下図のグラフが男女の人数差が分かりやすいと思います。
図4
図4は実行結果です。
上図はスタック型の棒グラフで、下図は通常の棒グラフです。
個人的には下図のグラフが男女の人数差が分かりやすいと思います。
-
乗船券クラス別(1st class, 2nd class, 3rd class)の生死の棒グラフを作成する
行2では乗船券クラス別の生死の人数をDataFrameに格納しています。
行4ではDataFrameの列名を変更しています。
行7-10ではスタック型の棒グラフ、行13-16では通常の棒グラフを作成しています。
### Survived vs Dead Analysis by Ticket Class (1st, 2nd, 3rd)
dfx = get_dataframe(df, 'Pclass')

dfx.columns = ['1st class','2nd class','3rd class']

# making stacked bar plot
dfx.plot(kind='bar', stacked=True, grid=False, rot=0,
    xlabel='Survived or Dead', ylabel='Number of Passenger',
    title='Survived vs Dead Analysis\n(Ticket Class)')
plt.show()

# making bar plot
dfx.plot(kind='bar', rot=0,
    xlabel='Survived or Dead', ylabel='Number of Passenger',
    title='Survived vs Dead Analysis\n(Ticket Class)')
plt.show()
 図5
図5は実行結果です。
ここではスタック型と通常の棒グラフを表示しています。
図5
図5は実行結果です。
ここではスタック型と通常の棒グラフを表示しています。
-
同乗者(兄弟・配偶者)別の生死の棒グラフを作成する
行4では同乗者(兄弟・配偶者)別の生死の人数をDataFrameに格納しています。
行6-7ではDataFrameの列名を変更しています。
行8ではDataFrameのNaN(Not a Number)の値を「0」にしてします。
行9ではDataFrameのNullの件数を列ごとに表示しています。
行10ではDataFrame(dfx)の先頭から3個までの列をコピーしています。
行13-16ではスタック型の棒グラフ、行19-23では通常の棒グラフを作成しています。
### SibSp: number of siblings / spouses aboard the Titanic

# get a new dataframe
dfx = get_dataframe(df, 'SibSp')

dfx.columns =  ['0 Sibling/Souses','1 Sibling/Souses','2 Sibling/Souses',
    '3 Sibling/Souses','4 Sibling/Souses','5 Sibling/Souses','8 Sibling/Souses']
dfx = dfx.fillna(0)
dfx.isnull().sum()
dfy = dfx.iloc[:,0:3]

# making stacked bar plot
dfy.plot(kind='bar', stacked=True, grid=False, rot=0,
    xlabel='Survived or Dead', ylabel='Number of Passenger',
    title='Survived vs Dead Analysis\n(Number of Siblings/Spouses Aboard)')
plt.show()

# making bar plot
dfx.plot(kind='bar', rot=0,
    xlabel='Survived or Dead', ylabel='Number of Passenger',
    title='Survived vs Dead Analysis\n(Number of Siblings/Spouses Aboard)',
    figsize=(10,5))
plt.show()
 図6
図6は実行結果です。
上図はスタック型の棒グラフです。
このグラフには同乗者の上位3件(0 Sibling/Souses, 1 Sibling/Souses, 2 Sibling/Souses)のみ表示しています。
下図は通常の棒グラフです。
このグラフには同乗者の全ての組み合わせを表示しています。
図6
図6は実行結果です。
上図はスタック型の棒グラフです。
このグラフには同乗者の上位3件(0 Sibling/Souses, 1 Sibling/Souses, 2 Sibling/Souses)のみ表示しています。
下図は通常の棒グラフです。
このグラフには同乗者の全ての組み合わせを表示しています。
-
親子別の生死の棒グラフを作成する
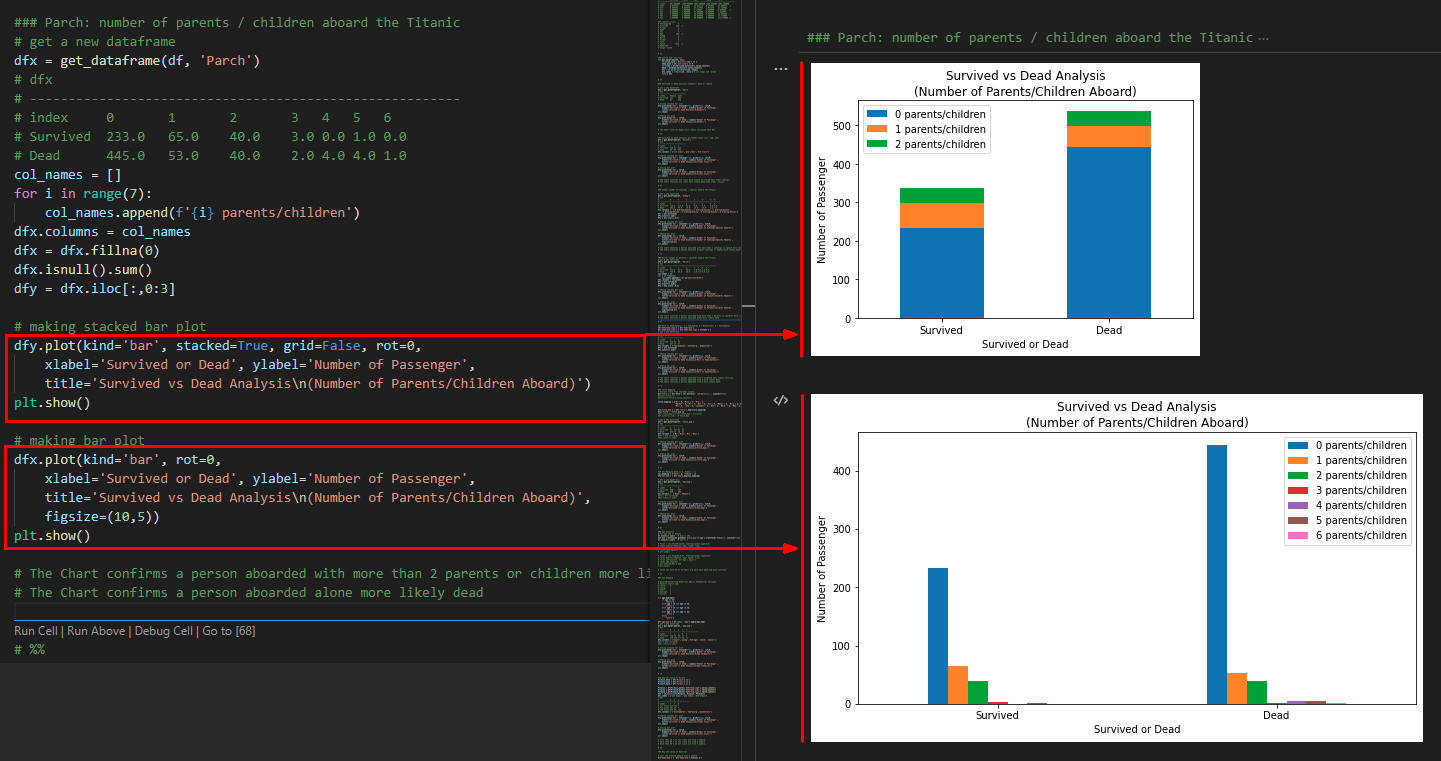
行3では親子別の生死の人数をDataFrameに格納しています。
行14-17ではスタック型の棒グラフ、行20-25では通常の棒グラフを作成しています。
### Parch: number of parents / children aboard the Titanic
# get a new dataframe
dfx = get_dataframe(df, 'Parch')

col_names = []
for i in range(7):
    col_names.append(f'{i} parents/children')
dfx.columns = col_names
dfx = dfx.fillna(0)
dfx.isnull().sum()
dfy = dfx.iloc[:,0:3]

# making stacked bar plot
dfy.plot(kind='bar', stacked=True, grid=False, rot=0,
    xlabel='Survived or Dead', ylabel='Number of Passenger',
    title='Survived vs Dead Analysis\n(Number of Parents/Children Aboard)')
plt.show()

# making bar plot
dfx.plot(kind='bar', rot=0,
    xlabel='Survived or Dead', ylabel='Number of Passenger',
    title='Survived vs Dead Analysis\n(Number of Parents/Children Aboard)',
    figsize=(10,5))
#plt.yscale('log')
plt.show()
 図7-1
図7-1は実行結果です。
ここではスタック型と通常の棒グラフを表示しています。
スタック型は親子(人数)の上位3件のみ表示しています。
図7-1
図7-1は実行結果です。
ここではスタック型と通常の棒グラフを表示しています。
スタック型は親子(人数)の上位3件のみ表示しています。
 図7-2
図7-2では通常の棒グラフに「plt.yscale('log')」を追加して親子(人数)の下位の棒グラフも表示されるようにしています。
図7-2
図7-2では通常の棒グラフに「plt.yscale('log')」を追加して親子(人数)の下位の棒グラフも表示されるようにしています。
-
乗船港別(Southampton, Cherbourg, Queenstown)の生死の棒グラフを作成する
行2-3では列「Embarked」の値がNaN(Not a Number)のとき「S」と置換して新規列「Embarked_copy」に格納しています。
行12-21では列「Embarked_copy」の棒グラフを作成しています。
### Port of Embarkation:  C = Cherbourg, Q = Queenstown, S = Southampton
df['Embarked_copy'] = df['Embarked']
df['Embarked_copy'] = df['Embarked_copy'].fillna('S')
# get a new dataframe
dfx = get_dataframe(df, 'Embarked_copy')

dfx.columns = ['Southampton','Cherbourg','Queenstown']
dfx = dfx.fillna(0)
dfx.isnull().sum()

# making stacked bar plot
dfx.plot(kind='bar', stacked=True, grid=False, rot=0,
    xlabel='Survived or Dead', ylabel='Number of Passenger',
    title='Survived vs Dead Analysis\n(Port of Embarkation)')
plt.show()

# making bar plot
dfx.plot(kind='bar', rot=0,
    xlabel='Survived or Dead', ylabel='Number of Passenger',
    title='Survived vs Dead Analysis\n(Port of Embarkation)')
plt.show()
 図8
図8は実行結果です。
ここではスタック型と通常の棒グラフを表示しています。
図8
図8は実行結果です。
ここではスタック型と通常の棒グラフを表示しています。
-
敬称別(Mr, Miss, Mrs, Misc)の生死の棒グラフを作成する
行3では列「Name」から敬称(Mr, Miss, Mrs,...)を抽出して新規列「Title」に格納しています。
行7-11では列「Title」を数値に変換(マッピング)して新規列「Title_map」に格納しています。
行24-33ではマッピングされた敬称「Title_map」の棒グラフを作成しています。
### Title Mapping
# Extract Title from the Name column
df['Title'] = df['Name'].str.extract(' ([A-Za-z]+)\.', expand=False)
#print('Title:')
#print(df['Title'].value_counts())

title_mapping = {'Mr': 0, 'Miss': 1, 'Mrs': 2,
                 'Master': 3, 'Dr': 3, 'Rev': 3, 'Col': 3, 'Major': 3, 'Mlle': 3,'Countess': 3,
                 'Ms': 3, 'Lady': 3, 'Jonkheer': 3, 'Don': 3, 'Dona' : 3, 'Mme': 3,'Capt': 3,'Sir': 3 }

df['Title_map'] = df['Title'].map(title_mapping)
df[['Title', 'Title_map']]
#df['Title_map'] = df['Title_map'].fillna(0)
#df.isnull().sum()  # Title_map

# get a new dataframe
dfx = get_dataframe(df, 'Title_map')

dfx.columns =  ['Mr','Miss','Mrs','Misc']
#dfx = dfx.fillna(0)
#dfx.isnull().sum()

# making stacked bar plot
dfx.plot(kind='bar', stacked=True, grid=False, rot=0,
    xlabel='Survived or Dead', ylabel='Number of Passenger',
    title='Survived vs Dead Analysis\n(Title_map)')
plt.show()

# making bar plot
dfx.plot(kind='bar', rot=0,
    xlabel='Survived or Dead', ylabel='Number of Passenger',
    title='Survived vs Dead Analysis\n(Title_map)')
plt.show()
 図9
図9は実行結果です。
ここではスタック型と通常の棒グラフを表示しています。
図9
図9は実行結果です。
ここではスタック型と通常の棒グラフを表示しています。
-
男女別('male': 0, 'female': 1)の生死の棒グラフを作成する
行2-3では列「Sex」を数値に変換(マッピング)して新規列「Sex_map」に格納しています。
行13-22ではマッピングされた列「Sex_map」の棒グラフを作成しています。
### Sex Mapping male => 0, femail => 1
sex_mapping = {'male': 0, 'female': 1}
df['Sex_map'] = df['Sex'].map(sex_mapping)

# get a new dataframe
dfx = get_dataframe(df, 'Sex_map')

dfx.columns =  ['Male','Female']
#dfx = dfx.fillna(0)
#dfx.isnull().sum()

# making stacked bar plot
dfx.plot(kind='bar', stacked=True, grid=False, rot=0,
    xlabel='Survived or Dead', ylabel='Number of Passenger',
    title='Survived vs Dead Analysis\n(Sex_map)')
plt.show()

# making bar plot
dfx.plot(kind='bar', rot=0,
    xlabel='Survived or Dead', ylabel='Number of Passenger',
    title='Survived vs Dead Analysis\n(Sex_map)')
plt.show()
 図10
図10は実行結果です。
この図は前出の男女別のグラフと同じですがDataFrameの列「Sex_map」をプロットしています。
列「Sex」には「male, female」が格納されていますが、
列「Sex_map」には数値にマッピングされた「0, 1」が格納されています。
図10
図10は実行結果です。
この図は前出の男女別のグラフと同じですがDataFrameの列「Sex_map」をプロットしています。
列「Sex」には「male, female」が格納されていますが、
列「Sex_map」には数値にマッピングされた「0, 1」が格納されています。
-
年齢別の生死のカーネル密度推定(KDE)グラフを作成する
行4では列「Age」の値がNaN(Not a Number)のとき中央値(median)の年齢と置換しています。
行7-13では列「Age」のカーネル密度推定(KDE)グラフを作成しています。
### Age Analysis
# Fix Age NaN => median
df.isnull().sum()   # Age => 263
df['Age'].fillna(df.groupby('Title_map')['Age'].transform('median'), inplace=True)
df.isnull().sum()   # Age => 0

# KDE(Kernel Density Estimation)
#facet = sns.displot(x='Age', hue='Survived', kind='kde', data=df)
facet = sns.displot(x='Age', hue='Survived', kind='kde', multiple='stack', data=df)
#facet = sns.displot(x='Age', hue='Survived', kind='kde', fill=True, data=df)

plt.title('Dead vs Survived Analysis\n(Age)')
plt.show()
 図11
図11は実行結果です。
ここではseabornで年齢別のカーネル密度推定(KDE)グラフを表示しています。
図11
図11は実行結果です。
ここではseabornで年齢別のカーネル密度推定(KDE)グラフを表示しています。
-
世代別(child: 0, young: 1, adult: 2, mid-age:3, senior: 4)の生死の棒グラフを作成する
行11-21では関数「age_map()」を定義しています。
この関数は年齢を5種類の世代(child, young, adult, mid-age, senior)に変換して数値を返します。
行23では列「Age」を世代に変換(マッピング)して新規列「Age_map」に格納しています。
行31-41では列「Age_map」の棒グラフを作成しています。
### Age Mapping

# Binning/Converting Numerical Age to Categorical Variable
# feature vector map:
# child:    0
# young:    1
# adult:    2
# mid-age:  3
# senior:   4

def age_map(age):
    if age <= 16:
        return 0
    elif age > 16 and age <= 26:
        return 1
    elif age > 26 and age <= 36:
        return 2
    elif age > 36 and age <= 62:
        return 3
    else:
        return 4

df['Age_map'] = df.loc[:, 'Age'].apply(age_map)
# get a new dataframe
dfx = get_dataframe(df, 'Age_map')

dfx.columns = ['adult','young','mid-age','child','senior']
#dfx = dfx.fillna(0)
#dfx.isnull().sum()

# making stacked bar plot
dfx.plot(kind='bar', stacked=True, grid=False, rot=0,
    xlabel='Survived or Dead', ylabel='Number of Passenger',
    title='Survived vs Dead Analysis\n(Age Category)')
plt.show()

# making bar plot
dfx.plot(kind='bar', rot=0,
    xlabel='Survived or Dead', ylabel='Number of Passenger',
    title='Survived vs Dead Analysis\n(Age Category)')
plt.show()
 図12
図12は実行結果です。
ここでは年齢を5世代に分離して棒グラフを表示しています。
child(16歳以下), young(17~26), adult(27~36), mid-age(37~62), senior(63以上)
図12
図12は実行結果です。
ここでは年齢を5世代に分離して棒グラフを表示しています。
child(16歳以下), young(17~26), adult(27~36), mid-age(37~62), senior(63以上)
-
乗船券クラス別(1, 2, 3)+乗船港別の生死の棒グラフを作成する
行15-25では乗船券クラス+乗船港別の棒グラフを作成しています。
### Map the value of Pclass
Pclass1_mask = df['Pclass'] == 1
Pclass2_mask = df['Pclass'] == 2
Pclass3_mask = df['Pclass'] == 3

Pclass1 = df[Pclass1_mask]['Embarked_copy'].value_counts()
Pclass2 = df[Pclass2_mask]['Embarked_copy'].value_counts()
Pclass3 = df[Pclass3_mask]['Embarked_copy'].value_counts()
dfx = pd.DataFrame([Pclass1, Pclass2, Pclass3])
dfx.index = ['1st Class','2nd Class','3rd Class']
# dfx

dfx.columns = ['Southampton','Cherbourg','Queenstown']

# making stacked bar plot
dfx.plot(kind='bar', stacked=True, grid=False, rot=0,
    xlabel='Survived or Dead', ylabel='Number of Passenger',
    title='Survived vs Dead Analysis\n(Ticket Class)')
plt.show()

# making bar plot
dfx.plot(kind='bar', rot=0,
    xlabel='Survived or Dead', ylabel='Number of Passenger',
    title='Survived vs Dead Analysis\n(Ticket Class)')
plt.show()
 図13
図13は実行結果です。
ここではスタック型と通常の棒グラフを表示しています。
図13
図13は実行結果です。
ここではスタック型と通常の棒グラフを表示しています。
-
乗船料金別の生死のカーネル密度推定(KDE)グラフを作成する
行4では列「Fare」の値がNaN(Not a Number)のとき乗船券クラス別の「Fare」の中央値(median)と置換しています。
行7-13では列「Fare」のカーネル密度推定(KDE)グラフを作成しています。
行17-25では関数「fare_map()」を定義しています。
この関数は「Fare(乗船料金)」の金額を0-3の数値に置換します。
行27では列「Fare」を数値(0-3)に変換して新規列「Fare_map」に格納します。
### Map the value of Fare

# Fill missing Fare with median fare for each Pclass
df['Fare'].fillna(df.groupby('Pclass')['Fare'].transform('median'), inplace=True)
#df.head(5)

# KDE(Kernel Density Estimation)
#facet = sns.displot(x='Fare', hue='Survived', kind='kde', data=df)
facet = sns.displot(x='Fare', hue='Survived', kind='kde', multiple='stack', data=df)
#facet = sns.displot(x='Fare', hue='Survived', kind='kde', fill=True, data=df)
#plt.xlim(-50, 200) # add
plt.title('Dead vs Survived Analysis\n(Fare)')
plt.show()

### Map Fare

def fare_map(fare):
    if fare <= 17:
        return 0
    elif fare > 17 and fare <= 30:
        return 1
    elif fare > 30 and fare <= 100:
        return 2
    else:
        return 3

df['Fare_map'] = df.loc[:, 'Fare'].apply(fare_map)
#df.head(5)
 図14
図14は実行結果です。
乗船料金別の生死のカーネル密度推定(KDE)グラフを表示しています。
下図は「plt.xlim(-50, 200)」を追加しています。
図14
図14は実行結果です。
乗船料金別の生死のカーネル密度推定(KDE)グラフを表示しています。
下図は「plt.xlim(-50, 200)」を追加しています。
-
キャビン別(C, B, D, E, A, T, F, G)の生死の棒グラフを作成する
行3では列「Cabin」の先頭1文字を抽出して新規列「Cabin-x」に格納します。
行33-44では列「Cabin-x」の棒グラフを作成しています。
行48-49では列「Cabin_x」を数値に変換(マッピング)して新規列「Cabin_map」に格納しています。
行54では列「Cabin_map」の値がNaN(Not a Number)のとき乗船券クラス別の「Cabin_map」の中央値(median)と置換しています。
### Map the value of Cabin
df['Cabin_x'] = df['Cabin'].str[:1] # X999 => X
Pclass1_mask = df['Pclass'] == 1
Pclass2_mask = df['Pclass'] == 2
Pclass3_mask = df['Pclass'] == 3
Pclass1 = df[Pclass1_mask]['Cabin_x'].value_counts()
Pclass2 = df[Pclass2_mask]['Cabin_x'].value_counts()
Pclass3 = df[Pclass3_mask]['Cabin_x'].value_counts()
dfx = pd.DataFrame([Pclass1, Pclass2, Pclass3])
dfx = dfx.fillna(0)
dfx.index = ['1st class','2nd class', '3rd class']
dfx.columns = ['C','B','D','E','A','T','F','G']
# making stacked bar plot
dfx.plot(kind='bar', stacked=True, grid=False, rot=0,
xlabel='Survived or Dead', ylabel='Number of Passenger',
title='Survived vs Dead Analysis\n(Cabin Class)')
plt.show()
# making bar plot
dfx.plot(kind='bar', rot=0,
xlabel='Survived or Dead', ylabel='Number of Passenger',
title='Survived vs Dead Analysis\n(Cabin Class)', figsize=(10,5))
#plt.yscale('log')
plt.show()
### Fill missing Cabin_map
cabin_mapping = {'A': 0, 'B': 0.4, 'C': 0.8, 'D': 1.2, 'E': 1.6, 'F': 2, 'G': 2.4, 'T': 2.8}
df['Cabin_map'] = df['Cabin_x'].map(cabin_mapping) # A => 0, B => 0.4
# Fill missing Cabin_map with median Cabin_map for each Pclass
#df = df.fillna(0)
df.isnull().sum()
df['Cabin_map'].fillna(df.groupby('Pclass')['Cabin_map'].transform('median'), inplace=True)
df.isnull().sum()
 図15
図15は実行結果です。
ここではスタック型と通常の棒グラフを表示しています。
図15
図15は実行結果です。
ここではスタック型と通常の棒グラフを表示しています。
-
家族サイズのカーネル密度推定(KDE)グラフを作成する
行3では「夫婦+子どもの人数」を計算して新規列「FamilySize」に格納しています。
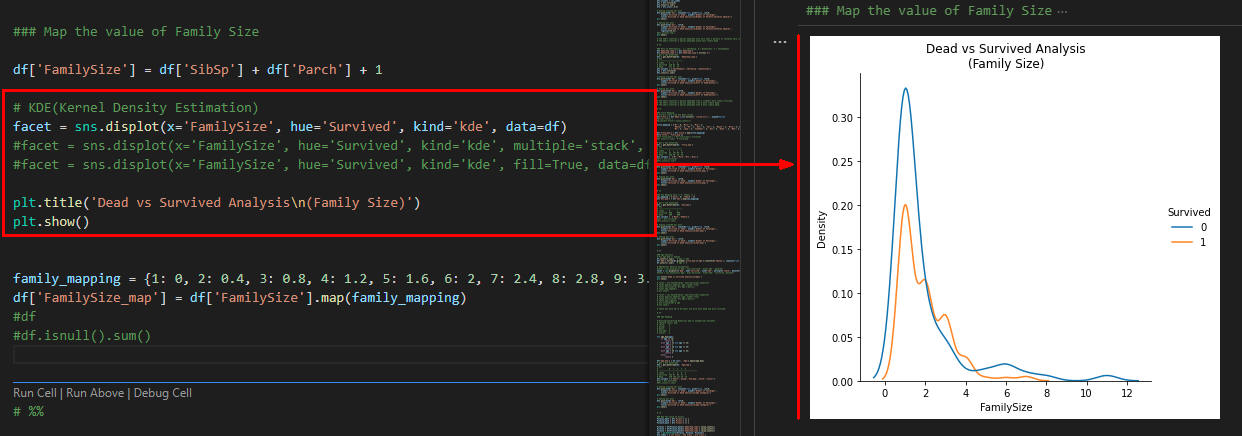
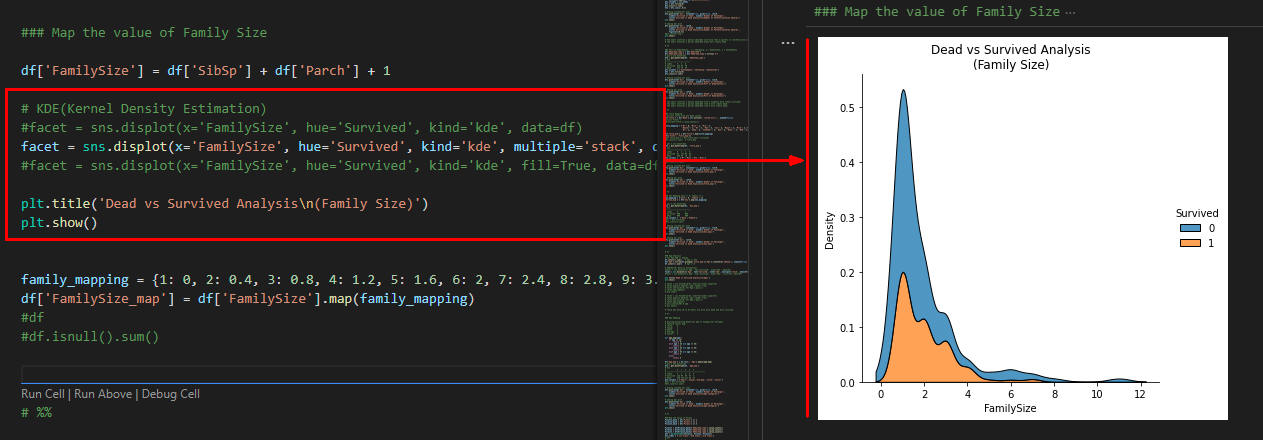
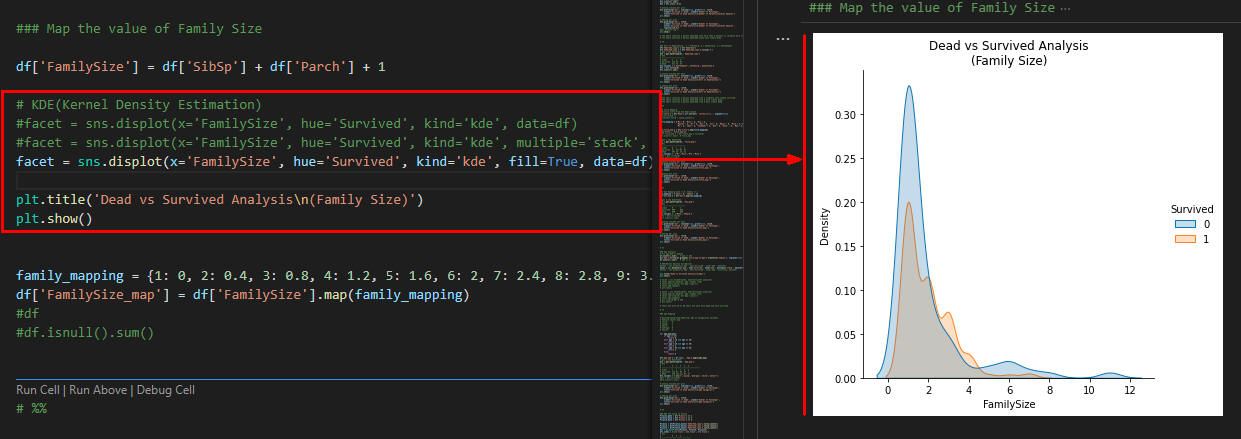
行5-8では家族サイズのカーネル密度推定(KDE)グラフを作成しています。
行13-14では列「FamilySize」を数値に変換(マッピング)して新規列「FamilySize_map」に格納しています。
### Map the value of Family Size

df['FamilySize'] = df['SibSp'] + df['Parch'] + 1

# KDE(Kernel Density Estimation)
#facet = sns.displot(x='FamilySize', hue='Survived', kind='kde', data=df)
facet = sns.displot(x='FamilySize', hue='Survived', kind='kde', multiple='stack', data=df)
#facet = sns.displot(x='FamilySize', hue='Survived', kind='kde', fill=True, data=df)

plt.title('Dead vs Survived Analysis\n(Family Size)')
plt.show()

family_mapping = {1: 0, 2: 0.4, 3: 0.8, 4: 1.2, 5: 1.6, 6: 2, 7: 2.4, 8: 2.8, 9: 3.2, 10: 3.6, 11: 4}
df['FamilySize_map'] = df['FamilySize'].map(family_mapping)
#df
#df.isnull().sum()
 図16-1
図16-1は実行結果結果です。
ここでは家族サイズのカーネル密度推定(KDE)グラフを表示しています。
図16-1
図16-1は実行結果結果です。
ここでは家族サイズのカーネル密度推定(KDE)グラフを表示しています。
 図16-2
図16-2は実行結果結果です。
ここでは「multiple='stack'」を追加しています。
図16-2
図16-2は実行結果結果です。
ここでは「multiple='stack'」を追加しています。
 図16-3
図16-3は実行結果結果です。
ここでは「fill=True」を追加しています。
図16-3
図16-3は実行結果結果です。
ここでは「fill=True」を追加しています。
-
ここで解説したコードをまとめて掲載
最後にここで解説したすべてのコードをまとめて掲載しましたので参考にしてください。
### Import the libraries
from functools import reduce
import pandas as pd
import numpy as np
import matplotlib.pyplot as plt
import seaborn as sns
import warnings

warnings.simplefilter('ignore')


# %%

### Load the titanic train data
csv_file = 'data/csv/titanic/train.csv'
#csv_file = 'https://money-or-ikigai.com/menu/python/article/data/titanic/train.csv'
raw = pd.read_csv(csv_file)

df = raw.copy()

#df.shape
# (1309, 12)    1309 rows, 12 columns

#df.info()
# Int64Index: 1309 entries, 0 to 417
# Data columns (total 12 columns):
#  #   Column       Non-Null Count  Dtype
# ---  ------       --------------  -----
#  0   PassengerId  891 non-null    int64
#  1   Survived     891 non-null    int64       0 = No, 1 = Yes
#  2   Pclass       891 non-null    int64       Ticket class 1 = 1st, 2 = 2nd, 3 = 3rd
#  3   Name         891 non-null    object
#  4   Sex          891 non-null    object      male or female
#  5   Age          714 non-null    float64
#  6   SibSp        891 non-null    int64       # of siblings / spouses aboard the Titanic
#  7   Parch        891 non-null    int64       # of parents / children aboard the Titanic
#  8   Ticket       891 non-null    object
#  9   Fare         891 non-null    float64     Ticket number
#  10  Cabin        204 non-null    object      Cabin number
#  11  Embarked     889 non-null    object      Port of Embarkation C = Cherbourg, Q = Queenstown, S = Southampton
# dtypes: float64(2), int64(5), object(5)

#df[['Survived','Pclass','Age','SibSp','Fare']].describe()
#           Survived	Pclass	    Age	        SibSp	    Fare
# --------------------------------------------------------------------------
# count	    891.000000	1309.000000	1046.000000	1309.000000	1308.000000
# mean	    0.383838	2.294882	29.881138	0.498854	33.295479   ★
# std	    0.486592	0.837836	14.413493	1.041658	51.758668
# min	    0.000000	1.000000	0.170000	0.000000	0.000000    ★
# 25%	    0.000000	2.000000	21.000000	0.000000	7.895800
# 50%	    0.000000	3.000000	28.000000	0.000000	14.454200
# 75%	    1.000000	3.000000	39.000000	1.000000	31.275000
# max	    1.000000	3.000000	80.000000	8.000000	512.329200  ★

#df.isnull().sum()
# PassengerId       0
# Survived        418   ★
# Pclass            0
# Name              0
# Sex               0
# Age             263   ★
# SibSp             0
# Parch             0
# Ticket            0
# Fare              1
# Cabin          1014   ★
# Embarked          2
# dtype: int64


# %%

### Define user function
def get_dataframe(df, col):
    survived_mask = df['Survived'] == 1
    dead_mask = df['Survived'] == 0
    survived = df[survived_mask][col].value_counts()    # Series(female:233, male:109)
    dead = df[dead_mask][col].value_counts()    # Series(male:468, female:81)
    dfx = pd.DataFrame([survived, dead])
    dfx.index = ['Survived','Dead'] # rename index 'Sex, Sex' => 'Survived, Dead'
    return dfx

dfx = get_dataframe(df, 'Sex')

# %%

# col = 'Sex'
# survived_mask = df['Survived'] == 1
# dead_mask = df['Survived'] == 0
# survived = df[survived_mask][col].value_counts()
# dead = df[dead_mask][col].value_counts()
# dfx = pd.DataFrame([survived, dead])


# %%

### Survived vs Dead Analysis (Gender): male or female

# get a new dataframe
dfx = get_dataframe(df, 'Sex')
# dfx
# --------------------------
# index     female	male
# Survived	233	    109
# Dead	    81	    468

# making stacked bar plot
dfx.plot(kind='bar', stacked=True, grid=False, rot=0,
    xlabel='Survived or Dead', ylabel='Number of Passenger',
    title='Survived vs Dead Analysis\n(Gender)')
plt.show()

# making bar plot
dfx.plot(kind='bar', rot=0,
    xlabel='Survived or Dead', ylabel='Number of Passenger',
    title='Survived vs Dead Analysis\n(Gender)')
plt.show()


# The Chart confirms Women more likely survivied than Men.

# %%

### Survived vs Dead Analysis by Ticket Class (1st, 2nd, 3rd)
dfx = get_dataframe(df, 'Pclass')
# dfx
# --------------------------
# index     1	2	3
# Survived	136	87	119
# Dead	    80	97	372
dfx.columns = ['1st class','2nd class','3rd class']

# making stacked bar plot
dfx.plot(kind='bar', stacked=True, grid=False, rot=0,
    xlabel='Survived or Dead', ylabel='Number of Passenger',
    title='Survived vs Dead Analysis\n(Ticket Class)')
plt.show()

# making bar plot
dfx.plot(kind='bar', rot=0,
    xlabel='Survived or Dead', ylabel='Number of Passenger',
    title='Survived vs Dead Analysis\n(Ticket Class)')
plt.show()

# The Chart confirms 1st class more likely survivied than other classes.
# The Chart confirms 3rd class more likely dead than other classes

# %%

### SibSp: number of siblings / spouses aboard the Titanic

# get a new dataframe
dfx = get_dataframe(df, 'SibSp')
# dfx
#           0       1       2       3       4       5   6
# ------------------------------------------------------------
# index	    0	    1	    2	    3	    4	    5	8
# Survived	210.0	112.0	13.0	4.0	    3.0	    0.0	0.0
# Dead	    398.0	97.0	15.0	12.0	15.0	5.0	7.0
dfx.columns =  ['0 Sibling/Souses','1 Sibling/Souses','2 Sibling/Souses',
    '3 Sibling/Souses','4 Sibling/Souses','5 Sibling/Souses','8 Sibling/Souses']
dfx = dfx.fillna(0)
dfx.isnull().sum()
dfy = dfx.iloc[:,0:3]

# making stacked bar plot
dfy.plot(kind='bar', stacked=True, grid=False, rot=0,
    xlabel='Survived or Dead', ylabel='Number of Passenger',
    title='Survived vs Dead Analysis\n(Number of Siblings/Spouses Aboard)')
plt.show()

# making bar plot
dfx.plot(kind='bar', rot=0,
    xlabel='Survived or Dead', ylabel='Number of Passenger',
    title='Survived vs Dead Analysis\n(Number of Siblings/Spouses Aboard)',
    figsize=(10,5))
plt.show()

# The Chart confirms a person aboarded with more than 2 siblings or spouse more likely survived.
# The Chart confirms a person aboarded without siblings or spouse more likely dead

# %%

### Parch: number of parents / children aboard the Titanic
# get a new dataframe
dfx = get_dataframe(df, 'Parch')
# dfx
# --------------------------------------------------------
# index     0	    1	    2	    3	4	5	6
# Survived	233.0	65.0	40.0	3.0	0.0	1.0	0.0
# Dead	    445.0	53.0	40.0	2.0	4.0	4.0	1.0

col_names = []
for i in range(7):
    col_names.append(f'{i} parents/children')
dfx.columns = col_names
dfx = dfx.fillna(0)
dfx.isnull().sum()
dfy = dfx.iloc[:,0:3]

# making stacked bar plot
dfy.plot(kind='bar', stacked=True, grid=False, rot=0,
    xlabel='Survived or Dead', ylabel='Number of Passenger',
    title='Survived vs Dead Analysis\n(Number of Parents/Children Aboard)')
plt.show()

# making bar plot
dfx.plot(kind='bar', rot=0,
    xlabel='Survived or Dead', ylabel='Number of Passenger',
    title='Survived vs Dead Analysis\n(Number of Parents/Children Aboard)',
    figsize=(10,5))
#plt.yscale('log')
plt.show()

# The Chart confirms a person aboarded with more than 2 parents or children more likely survived.
# The Chart confirms a person aboarded alone more likely dead

# %%

### Port of Embarkation:  C = Cherbourg, Q = Queenstown, S = Southampton
df['Embarked_copy'] = df['Embarked']
df['Embarked_copy'] = df['Embarked_copy'].fillna('S')
# get a new dataframe
dfx = get_dataframe(df, 'Embarked_copy')
# dfx
# -----------------------
# index     S	C	Q
# Survived	219	93	30
# Dead	    427	75	47
dfx.columns = ['Southampton','Cherbourg','Queenstown']
dfx = dfx.fillna(0)
dfx.isnull().sum()

# making stacked bar plot
dfx.plot(kind='bar', stacked=True, grid=False, rot=0,
    xlabel='Survived or Dead', ylabel='Number of Passenger',
    title='Survived vs Dead Analysis\n(Port of Embarkation)')
plt.show()

# making bar plot
dfx.plot(kind='bar', rot=0,
    xlabel='Survived or Dead', ylabel='Number of Passenger',
    title='Survived vs Dead Analysis\n(Port of Embarkation)')
plt.show()

# The Chart confirms a person aboarded from C slightly more likely survived.
# The Chart confirms a person aboarded from Q more likely dead.
# The Chart confirms a person aboarded from S more likely dead.

# %%

### Title Mapping
# Extract Title from the Name column
df['Title'] = df['Name'].str.extract(' ([A-Za-z]+)\.', expand=False)
#print('Title:')
#print(df['Title'].value_counts())

title_mapping = {'Mr': 0, 'Miss': 1, 'Mrs': 2,
                 'Master': 3, 'Dr': 3, 'Rev': 3, 'Col': 3, 'Major': 3, 'Mlle': 3,'Countess': 3,
                 'Ms': 3, 'Lady': 3, 'Jonkheer': 3, 'Don': 3, 'Dona' : 3, 'Mme': 3,'Capt': 3,'Sir': 3 }

df['Title_map'] = df['Title'].map(title_mapping)
df[['Title', 'Title_map']]
#df['Title_map'] = df['Title_map'].fillna(0)
#df.isnull().sum()  # Title_map

# get a new dataframe
dfx = get_dataframe(df, 'Title_map')
# dfx
# -----------------------
# index	    0	1	2	3
# Survived	81	127	99	35
# Dead	    436	55	26	32
dfx.columns =  ['Mr','Miss','Mrs','Misc']
#dfx = dfx.fillna(0)
#dfx.isnull().sum()

# making stacked bar plot
dfx.plot(kind='bar', stacked=True, grid=False, rot=0,
    xlabel='Survived or Dead', ylabel='Number of Passenger',
    title='Survived vs Dead Analysis\n(Title_map)')
plt.show()

# making bar plot
dfx.plot(kind='bar', rot=0,
    xlabel='Survived or Dead', ylabel='Number of Passenger',
    title='Survived vs Dead Analysis\n(Title_map)')
plt.show()


# %%

### Sex Mapping male => 0, femail => 1
sex_mapping = {'male': 0, 'female': 1}
df['Sex_map'] = df['Sex'].map(sex_mapping)

# get a new dataframe
dfx = get_dataframe(df, 'Sex_map')
# dfx
# -----------------------
# index	    0       1
# Survived	999     999
# Dead	    999     999
dfx.columns =  ['Male','Female']
#dfx = dfx.fillna(0)
#dfx.isnull().sum()

# making stacked bar plot
dfx.plot(kind='bar', stacked=True, grid=False, rot=0,
    xlabel='Survived or Dead', ylabel='Number of Passenger',
    title='Survived vs Dead Analysis\n(Sex_map)')
plt.show()

# making bar plot
dfx.plot(kind='bar', rot=0,
    xlabel='Survived or Dead', ylabel='Number of Passenger',
    title='Survived vs Dead Analysis\n(Sex_map)')
plt.show()


# %%

### Age Analysis
# Fix Age NaN => median
df.isnull().sum()   # Age => 263
df['Age'].fillna(df.groupby('Title_map')['Age'].transform('median'), inplace=True)
df.isnull().sum()   # Age => 0

# KDE(Kernel Density Estimation)
#facet = sns.displot(x='Age', hue='Survived', kind='kde', data=df)
facet = sns.displot(x='Age', hue='Survived', kind='kde', multiple='stack', data=df)
#facet = sns.displot(x='Age', hue='Survived', kind='kde', fill=True, data=df)

plt.title('Dead vs Survived Analysis\n(Age)')
plt.show()

# facet = sns.FacetGrid(df, hue="Survived",aspect=4)
# facet.map(sns.kdeplot,'Age',shade= True)
# facet.set(xlim=(0, df['Age'].max()))
# facet.add_legend()
# plt.show()

# facet = sns.FacetGrid(df, hue="Survived",aspect=4)
# facet.map(sns.kdeplot,'Age',shade= True)
# facet.set(xlim=(0, df['Age'].max()))
# facet.add_legend()
# plt.xlim(10,50) # add
# plt.show()

# Those who were 20 to 30 years old were more dead and more survived.

# %%

### Age Mapping

# Binning/Converting Numerical Age to Categorical Variable
# feature vector map:
# child:    0
# young:    1
# adult:    2
# mid-age:  3
# senior:   4

def age_map(age):
    if age <= 16:
        return 0
    elif age > 16 and age <= 26:
        return 1
    elif age > 26 and age <= 36:
        return 2
    elif age > 36 and age <= 62:
        return 3
    else:
        return 4

df['Age_map'] = df.loc[:, 'Age'].apply(age_map)
# get a new dataframe
dfx = get_dataframe(df, 'Age_map')
# dfx
#           0   1   2   3   4
# --------------------------------------
# index     2	1	3	0	4
# Survived	116	97	69	57	3
# Dead	    220	158	111	48	12
dfx.columns = ['adult','young','mid-age','child','senior']
#dfx = dfx.fillna(0)
#dfx.isnull().sum()

# making stacked bar plot
dfx.plot(kind='bar', stacked=True, grid=False, rot=0,
    xlabel='Survived or Dead', ylabel='Number of Passenger',
    title='Survived vs Dead Analysis\n(Age Category)')
plt.show()

# making bar plot
dfx.plot(kind='bar', rot=0,
    xlabel='Survived or Dead', ylabel='Number of Passenger',
    title='Survived vs Dead Analysis\n(Age Category)')
plt.show()


# %%

### Map the value of Pclass
Pclass1_mask = df['Pclass'] == 1
Pclass2_mask = df['Pclass'] == 2
Pclass3_mask = df['Pclass'] == 3

Pclass1 = df[Pclass1_mask]['Embarked_copy'].value_counts()
Pclass2 = df[Pclass2_mask]['Embarked_copy'].value_counts()
Pclass3 = df[Pclass3_mask]['Embarked_copy'].value_counts()
dfx = pd.DataFrame([Pclass1, Pclass2, Pclass3])
dfx.index = ['1st Class','2nd Class','3rd Class']
# dfx
#           0   1   2
# -----------------------------
# index     S	C	Q
# 1st Class	179	141	3
# 2nd Class	242	28	7
# 3rd Class	495	101	113
dfx.columns = ['Southampton','Cherbourg','Queenstown']

# making stacked bar plot
dfx.plot(kind='bar', stacked=True, grid=False, rot=0,
    xlabel='Survived or Dead', ylabel='Number of Passenger',
    title='Survived vs Dead Analysis\n(Ticket Class)')
plt.show()

# making bar plot
dfx.plot(kind='bar', rot=0,
    xlabel='Survived or Dead', ylabel='Number of Passenger',
    title='Survived vs Dead Analysis\n(Ticket Class)')
plt.show()

# more than 50 % of 1st class are from S embark.
# more than 50 % of 2st class are from S embark.
# more than 50 % of 3st class are from S embark.

# %%

### Map the value of Embarked

# fill out missing embark with S embark
df['Embarked'] =  df['Embarked'].fillna('S')

embarked_mapping = {'S':0,'C':1,'Q':2}
df['Embarked_map'] = df['Embarked'].map(embarked_mapping)


# %%

### Map the value of Fare

# Fill missing Fare with median fare for each Pclass
df['Fare'].fillna(df.groupby('Pclass')['Fare'].transform('median'), inplace=True)
#df.head(5)

# KDE(Kernel Density Estimation)
#facet = sns.displot(x='Fare', hue='Survived', kind='kde', data=df)
facet = sns.displot(x='Fare', hue='Survived', kind='kde', multiple='stack', data=df)
#facet = sns.displot(x='Fare', hue='Survived', kind='kde', fill=True, data=df)
plt.xlim(-50, 200) # add
plt.title('Dead vs Survived Analysis\n(Fare)')
plt.show()

# facet = sns.FacetGrid(df, hue='Survived',aspect=4 )
# facet.map(sns.kdeplot, 'Fare', shade = True)
# facet.set(xlim = (0, df['Fare'].max()))
# facet.add_legend()
# plt.show()

# facet = sns.FacetGrid(df, hue="Survived",aspect=4)
# facet.map(sns.kdeplot,'Fare',shade= True)
# facet.set(xlim=(0, df['Fare'].max()))
# facet.add_legend()
# plt.xlim(0, 20) # add
# plt.show()

### Map Fare

def fare_map(fare):
    if fare <= 17:
        return 0
    elif fare > 17 and fare <= 30:
        return 1
    elif fare > 30 and fare <= 100:
        return 2
    else:
        return 3

df['Fare_map'] = df.loc[:, 'Fare'].apply(fare_map)
#df.head(5)


# %%

### Map the value of Cabin

df['Cabin_x'] =  df['Cabin'].str[:1]    # X999 => X

Pclass1_mask = df['Pclass'] == 1
Pclass2_mask = df['Pclass'] == 2
Pclass3_mask = df['Pclass'] == 3

Pclass1 = df[Pclass1_mask]['Cabin_x'].value_counts()
Pclass2 = df[Pclass2_mask]['Cabin_x'].value_counts()
Pclass3 = df[Pclass3_mask]['Cabin_x'].value_counts()
dfx = pd.DataFrame([Pclass1, Pclass2, Pclass3])
dfx = dfx.fillna(0)
dfx.index = ['1st class','2nd class', '3rd class']

# dfx                               *
#           0       1       2       3       4       5   6       7
# ------------------------------------------------------------------------
# index     C	    B	    D	    E	    A	    T	F	    G
# 1st class	94.0	65.0	40.0	34.0	22.0	1.0	NaN	    NaN
# 2nd class	NaN	    NaN	    6.0	    4.0	    NaN	    NaN 13.0	NaN
# 3rd class	NaN	    NaN	    NaN	    3.0	    NaN	    NaN	8.0	    5.0

dfx.columns = ['C','B','D','E','A','T','F','G']

# making stacked bar plot
dfx.plot(kind='bar', stacked=True, grid=False, rot=0,
    xlabel='Survived or Dead', ylabel='Number of Passenger',
    title='Survived vs Dead Analysis\n(Cabin Class)')
plt.show()

# making bar plot
dfx.plot(kind='bar', rot=0,
    xlabel='Survived or Dead', ylabel='Number of Passenger',
    title='Survived vs Dead Analysis\n(Cabin Class)', figsize=(10,5))
#plt.yscale('log')
plt.show()


# %%

### Fill missing Cabin_map

cabin_mapping = {'A': 0, 'B': 0.4, 'C': 0.8, 'D': 1.2, 'E': 1.6, 'F': 2, 'G': 2.4, 'T': 2.8}
df['Cabin_map'] = df['Cabin_x'].map(cabin_mapping)  # A => 0, B => 0.4

# Fill missing Cabin_map with median Cabin_map for each Pclass
#df = df.fillna(0)
df.isnull().sum()
df['Cabin_map'].fillna(df.groupby('Pclass')['Cabin_map'].transform('median'), inplace=True)
df.isnull().sum()


# %%

### Map the value of Family Size

df['FamilySize'] = df['SibSp'] + df['Parch'] + 1

# KDE(Kernel Density Estimation)
#facet = sns.displot(x='FamilySize', hue='Survived', kind='kde', data=df)
#facet = sns.displot(x='FamilySize', hue='Survived', kind='kde', multiple='stack', data=df)
facet = sns.displot(x='FamilySize', hue='Survived', kind='kde', fill=True, data=df)

plt.title('Dead vs Survived Analysis\n(Family Size)')
plt.show()


family_mapping = {1: 0, 2: 0.4, 3: 0.8, 4: 1.2, 5: 1.6, 6: 2, 7: 2.4, 8: 2.8, 9: 3.2, 10: 3.6, 11: 4}
df['FamilySize_map'] = df['FamilySize'].map(family_mapping)
#df
#df.isnull().sum()


# %%