ビットコインの価格を予測するプログラムでTensorFlowが正常に動作するか確認する
VS Codeを起動したら新規ファイルを作成して行1-139をコピペして保存します。
Tensorflow Predicting Crypto Prices.py:
TensorFlow Predicting Crypto Prices in Python.py
import os
os.environ['TF_CPP_MIN_LOG_LEVEL'] = '3'
# In detail:-
# 0 = all messages are logged (default behavior)
# 1 = INFO messages are not printed
# 2 = INFO and WARNING messages are not printed
# 3 = INFO, WARNING, and ERROR messages are not printed

import numpy as np              # pip install numpy or # pip install numpy==1.19.5
import matplotlib.pyplot as plt # pip install matplotlib
import pandas as pd             # pip install pandas
import datetime as dt
from time import sleep

import yfinance as yf           # pip install yfinance

# pip install tensorflow-cpu
# pip install sklearn
# pip install scikit-learn

from sklearn.preprocessing import MinMaxScaler
from keras import models
from keras.layers import Dense, Dropout, LSTM
from keras.models import Sequential

###############################################################################################################################################
def load_historic_data(symbol: str, start_date: dt.datetime , end_date: dt.datetime, period='1d', interval='1d', prepost=True) -> pd.DataFrame:
    # valid periods: 1d,5d,1mo,3mo,6mo,1y,2y,5y,10y,ytd,max
    # fetch data by interval (including intraday if period < 60 days)
    # valid intervals: 1m,2m,5m,15m,30m,60m,90m,1h,1d,5d,1wk,1mo,3mo
    try:
        start_date_str = dt.datetime.strftime(start_date, "%Y-%m-%d")
        end_date_str = dt.datetime.strftime(end_date, "%Y-%m-%d")
        df = yf.download(symbol, start=start_date_str, end=end_date_str, period=period, interval=interval, prepost=prepost)
        #  Add symbol
        df["Symbol"] = symbol
        return df
    except:
        print('Error loading stock data for ' + symbol)
        return pd.DataFrame()

### Main

crypto_currency = 'BTC'
against_currency = 'USD'

start = dt.datetime(2016,1,1)
end = dt.datetime.now()
symbol = f"{crypto_currency}-{against_currency}"    # 'BTC-USD'
print(f"Loading data for {symbol}")
data = load_historic_data(symbol, start, end)

# print('-'*200)
# print(data.info())
# print('-'*200)
# print(data.head(3))
# print('-'*200)
# print(data.tail(3))
# print('-'*200)

# DatetimeIndex: 1824 entries, 2018-01-23 00:00:00+00:00 to 2023-01-21 00:00:00+00:00
# Data columns (total 7 columns):
#  #   Column     Non-Null Count  Dtype
# ---  ------     --------------  -----
#  0   Open       1824 non-null   float64
#  1   High       1824 non-null   float64
#  2   Low        1824 non-null   float64
#  3   Close      1824 non-null   float64
#  4   Adj Close  1824 non-null   float64
#  5   Volume     1824 non-null   int64
#  6   Symbol     1824 non-null   object
# dtypes: float64(5), int64(1), object(1)

# Prepare data

scaler = MinMaxScaler(feature_range=(0,1))
scaled_data = scaler.fit_transform(data['Close'].values.reshape(-1,1))

prediction_days = 60
x_train, y_train = [], []

for x in range(prediction_days, len(scaled_data)):
    x_train.append(scaled_data[x-prediction_days:x, 0])
    y_train.append(scaled_data[x, 0])

x_train, y_train = np.array(x_train), np.array(y_train)
x_train = np.reshape(x_train, (x_train.shape[0], x_train.shape[1], 1))

# Create Neural Network
# pip install numpy==1.19.5  # install numpy 1.19.5 if you get an error

model = Sequential()

model.add(LSTM(units=50, return_sequences=True, input_shape=(x_train.shape[1], 1)))
model.add(Dropout(0.2))
model.add(LSTM(units=50, return_sequences=True))
model.add(Dropout(0.2))
model.add(LSTM(units=50))
model.add(Dropout(0.2))
model.add(Dense(units=1))

model.compile(optimizer='adam', loss='mean_squared_error')
model.fit(x_train, y_train, epochs=25, batch_size=32)

# Testing model

test_start = dt.datetime(2020,1,1)
test_end = dt.datetime.now()

print(f"Loading test data for {symbol}")
test_data = load_historic_data(symbol, test_start, test_end)

actual_prices = test_data['Close'].values

total_dataset = pd.concat((data['Close'], test_data['Close']), axis=0)

model_inputs = total_dataset[len(total_dataset) - len(test_data) - prediction_days:].values
model_inputs = model_inputs.reshape(-1, 1)
model_inputs = scaler.fit_transform(model_inputs)

x_test = []

for x in range(prediction_days, len(model_inputs)):
    x_test.append(model_inputs[x-prediction_days:x, 0])

x_test = np.array(x_test)
x_test = np.reshape(x_test, (x_test.shape[0], x_test.shape[1], 1))

prediction_prices = model.predict(x_test)
prediction_prices = scaler.inverse_transform(prediction_prices)

plt.plot(actual_prices, color='black', label='Actual Prices')
plt.plot(prediction_prices, color='green', label='Predicted Prices')
plt.title(f'{crypto_currency} price prediction')
plt.xlabel('Time')
plt.ylabel('Price')
plt.legend(loc='upper left')
plt.show()
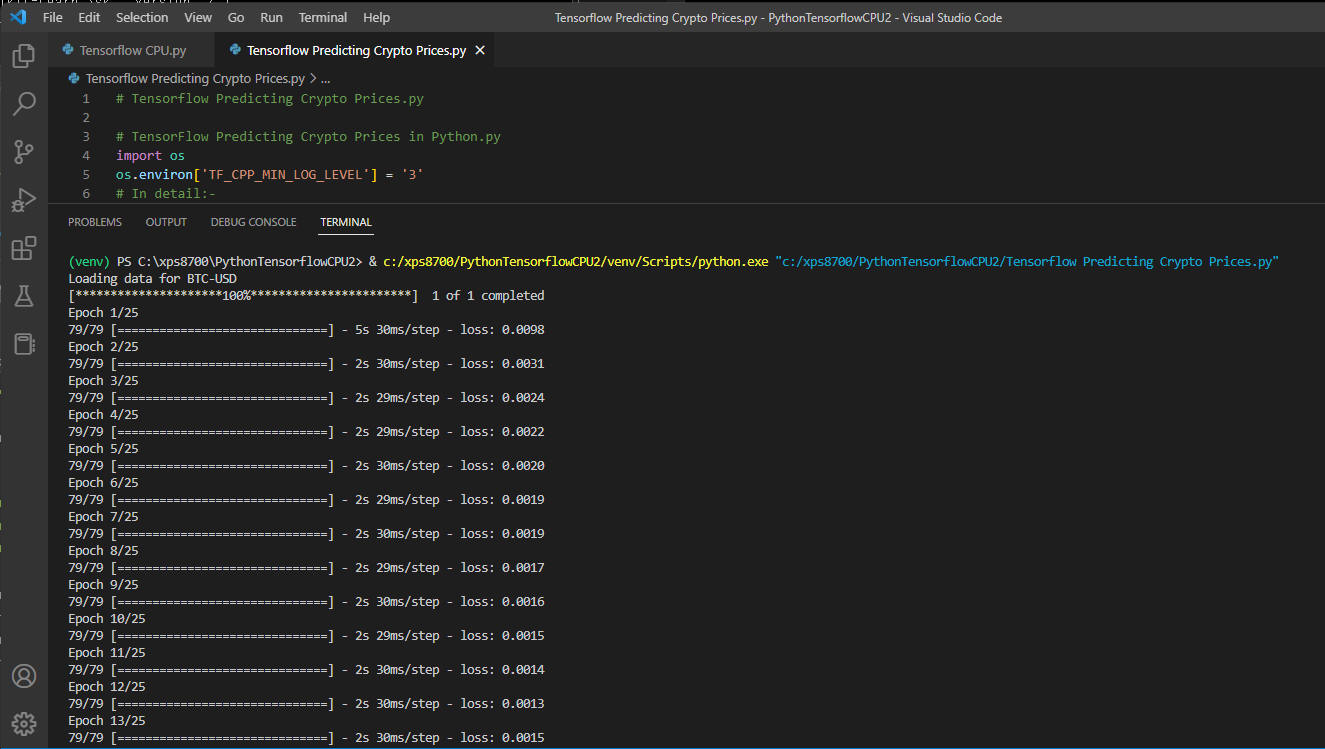
 図6-1
Pythonのライブラリ「matplotlib, yfinance」をまだインストールしていないときは、
事前に「pip install」コマンドでインストールしておいてください。
インストールのコマンドはソースコードのコメントに記載しています。
VS Codeから起動ボタンをクリックしてプログラムを起動します。
プログラムが起動されると学習経過が表示されます。
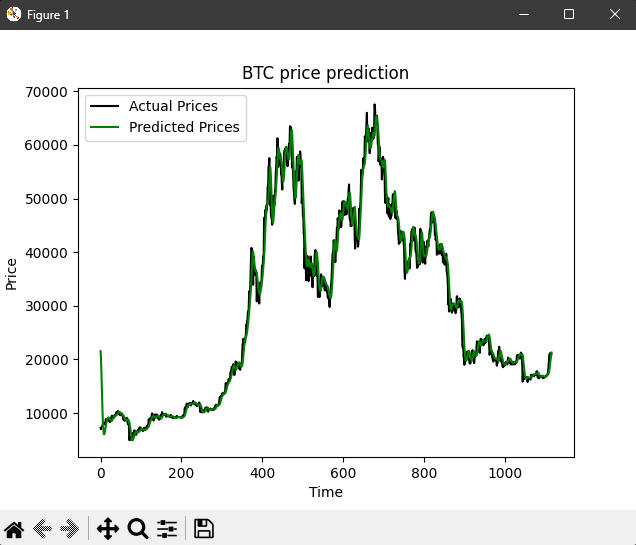
そして最後にビットコインの価格と予想価格のグラフが表示されます。
 図6-2
この図はビットコインの実価格と予想価格のグラフです。
これでTensorFlow(CPU)が正常に動作することが確認できました。